OpenSandbox on Amazon EKS: Stress Testing Two Nodes
By Fabio Douek
Jump to section
- Overview
- Architecture
- Setup
- Step 1: The companion code
- Step 2: Container Insights, metrics only
- Step 3: A kubelet sampler for the fine-grained view
- Step 4: Start every test from zero
- Testing
- Test 1: Density, three ways
- Test 2: Create latency, cold and from a Pool
- Test 3: A pause storm
- Test 4: The egress overhead ladder
- Test 5: Control-plane load
- Test 6: Noisy neighbors
- What CloudWatch saw
- Results summary
- Pricing
- Cleanup
- Verdict
- What you sign up for
- Who should use it
Explain (TLDR) like I am...
Imagine two toy boxes and a pile of little robot rooms to fit inside them. I kept adding rooms until the boxes said no more, then did it again with a guard at every door, and again with rooms that have thick walls of their own.
The plain rooms stopped when the boxes ran out of spots, not space. Each guard made a room much heavier, but the boxes never noticed. The thick-walled rooms ran out much sooner, and the box's own counter never showed the space each of them used.
This post stress-tests OpenSandbox 1.2.0, an Apache 2.0 project of the Agentic AI Foundation, on two Amazon EKS nodes, and sets the results beside the project's published numbers, whose conditions differ from these and in one case are not stated at all. Each test ran three times on a cluster with no other sandboxes.
The material findings concern what the platform does not account for. The egress sidecar that holds credentials reserves no memory with the scheduler, and a Kata virtual machine uses slightly more memory than its reservation covers, while the node agent reports none of it.
The presenting question was how far two m7i.2xlarge nodes carry OpenSandbox 1.2.0 on Amazon EKS, and whether the published numbers hold. I ran six tests, three times each with no other sandboxes: density, create latency, a pause storm, egress overhead, control-plane load and noisy neighbors.
Findings: 89 idle container sandboxes fit, limited by pod slots, not memory. Under Kata 24 fit, held back by a Kubernetes scheduler bug that counts the VM's CPU overhead twice, and the node agent reported none of a virtual machine's memory. In the stricter dns+nft egress mode this series uses, every lookup of an allowed name waited about 59 ms for a firewall update, one at a time.
Benchmarks invite a quiet anxiety: is my setup as fast as the one in the docs? Part of this work is letting that comparison go, because the published numbers came from other machines, other runtimes and, in one case, no stated setup at all.
What helps more is knowing your own limits before they surprise you. On these two nodes the first wall was a count of slots, not memory. The subtler worry is the memory nobody counts: the egress sidecar's, which the scheduler never sees, and the virtual machine's, which the node agent does not report.
Think of the two nodes as a stage with a fixed number of music stands. I kept adding players until the stage manager said no. Plain players filled every stand, players who each brought an egress roadie still filled every stand, and players in their own soundproof booths ran out of room much sooner.
The tempo told its own story. Called from inside the hall, a player already warming up in the wings walked on in 130 ms at the median; one who had to set up from scratch took 1,712 ms, and longer when forty arrived at once.
The story is capacity planning you can check in your own AWS account: how many OpenSandbox sandboxes two m7i.2xlarge nodes hold, how fast they start, and what each layer of egress control costs, measured three times each with no other sandboxes and set beside the project's published numbers.
The honest positioning has caveats buyers will ask about. The first limit on these nodes was pod slots, not memory. The egress sidecar adds memory without reserving any, every allowed name lookup in the stricter dns+nft egress mode waits for a firewall update, and the Firecracker numbers were not tested.
 See the source code here: opensandbox-stress
Overview
OpenSandbox has been a project of the Agentic AI Foundation, a directed fund of the Linux Foundation, since the announcement on October 22, 2026; part 1 covers that move.
This post, part 6 of 6, takes part 2’s cluster, two m7i.2xlarge nodes with nothing added, and pushes it until something gives: six tests, each run three times on a cluster with no other sandboxes.
What I found:
- In
dns+nftmode, the Helm chart’s and this series’ setting, every lookup of an allowed name waits about 59 ms for annftprocess. The sidecar writes each answer into nftables before it replies, one write at a time per sandbox, and each write waits out a kernel RCU grace period. Clients that resolve before every connection pay it each time (16 of them got 14.3 requests per second); one that reuses connections pays it once per connection. Server-widednsmode, the server’s built-in default, avoids it but filters names only and refuses the credential proxy. - The transparent proxy is one process on one core that nothing reserves. With the lookup out of the way it added about 3.3 ms per new connection and topped out near 385 new connections a second per sandbox.
- The first limit was pod slots, not memory. Two nodes held 89 idle sandboxes with or without the egress sidecar, which added about 60 MiB each and reserved none.
- Kata density was set by Kubernetes, not OpenSandbox. Kubernetes 1.37’s scheduler counts a running pod’s RuntimeClass overhead twice (#143257), about 600m per Kata sandbox against 350m declared, so 24 fit.
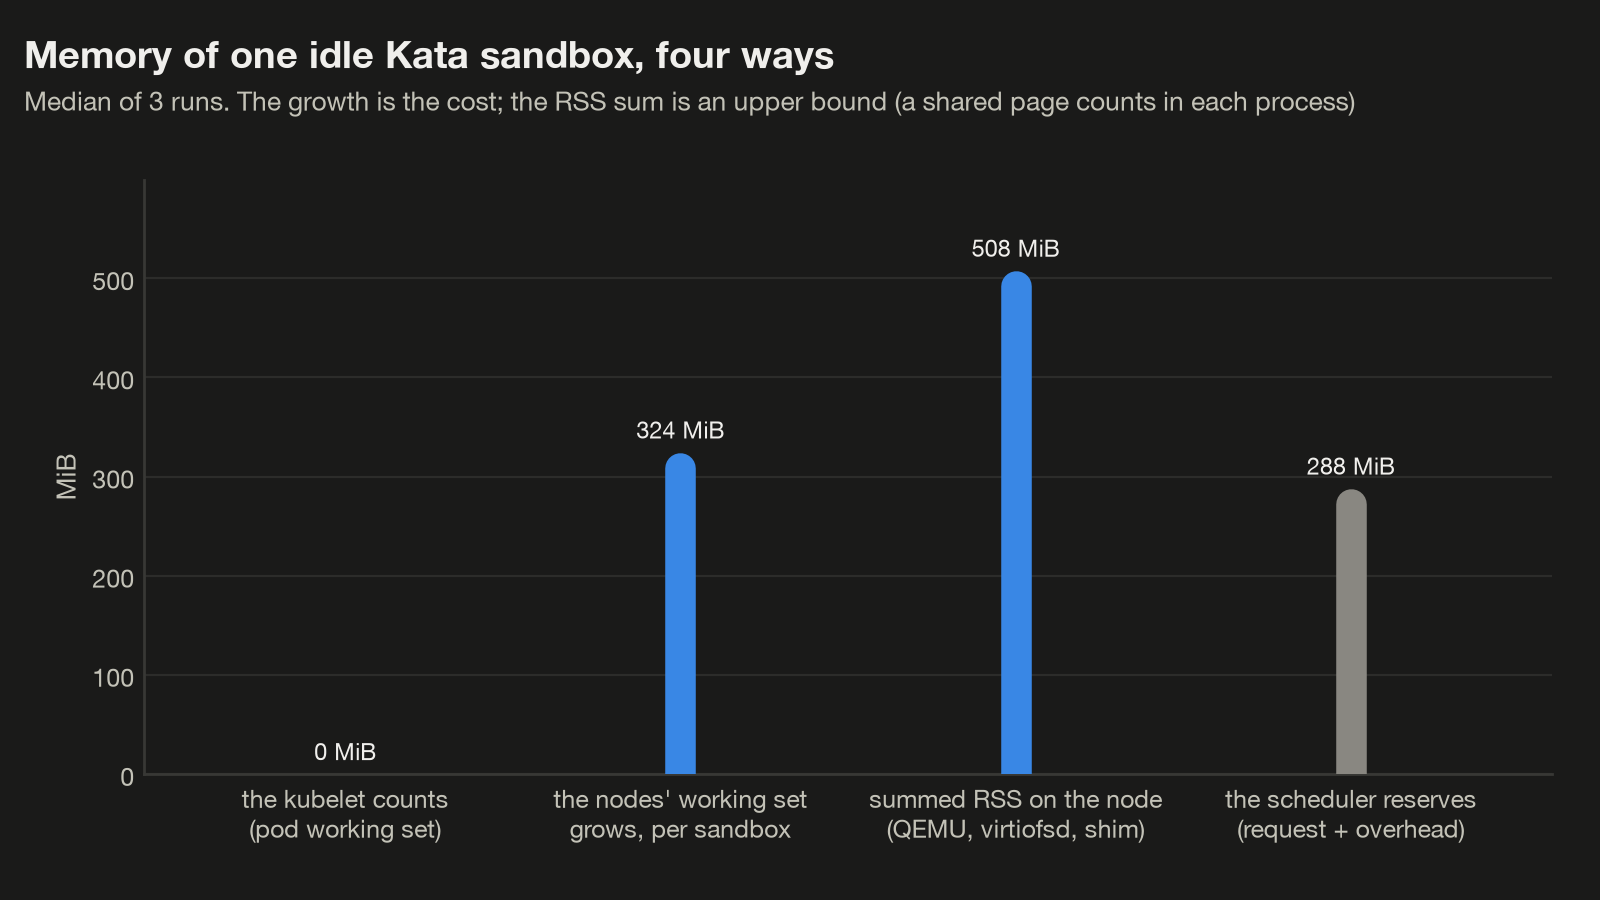
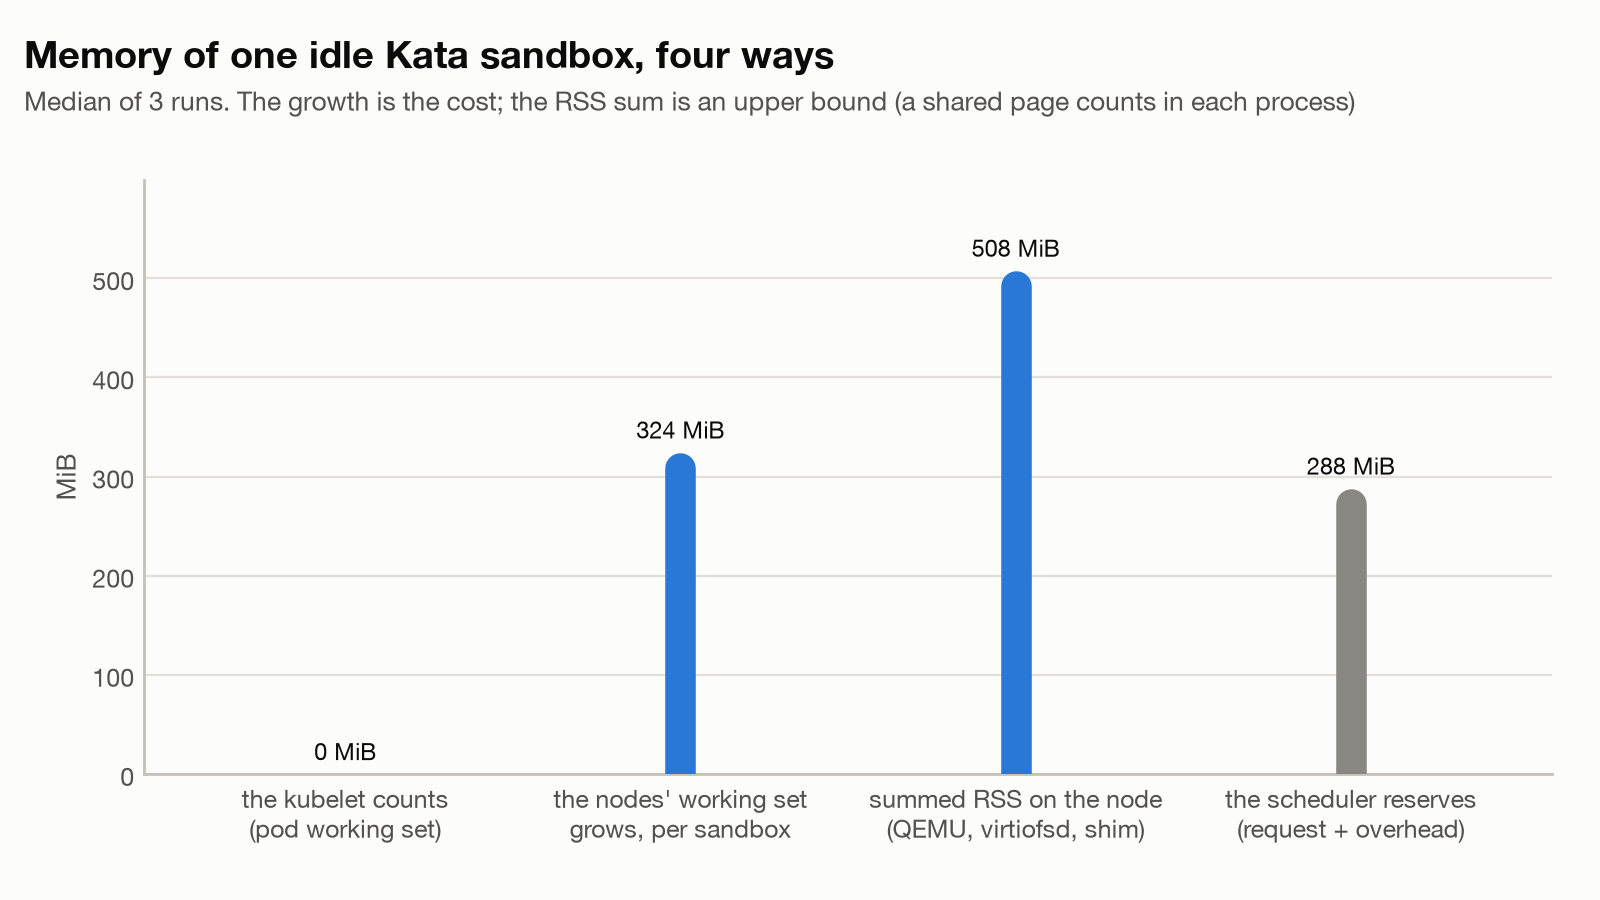
- The kubelet doesn’t see a Kata sandbox’s memory. Each cost the nodes about 324 MiB, a little over the 288 reserved, and the kubelet reported 0 MiB for its pod.
- Disk isn’t isolated, under either runtime. Eight disk hogs made the victims’ 64 MiB write and fsync 2.51x slower under runc and 4.57x under Kata; CPU hogs cost 1.02x and 1.27x.
- Where the client runs is most of a warm create: 130 ms at the median from a pod in the cluster, 1,245 ms from my Mac through the port-forward.
The project and others have published numbers for some of this. None comes from a setup like this one, and one states no setup at all:
| Published number | Where | Conditions it states | What I ran |
|---|---|---|---|
| 100 sandboxes delivered from a pool in 0.92 s | The release’s controller docs | None: no hardware, cluster or client | A delivery of as many pooled sandboxes as these nodes have pod slots for, through the controller alone and through the server (Test 2) |
| About 230 ms to claim a warm sandbox (an average of about 140 ms when claiming 10 in a batch), about 3.1 s cold | An AWS China blog post, July 15, 2026 | Kata 3.31.0 with Cloud Hypervisor, c5.metal bare metal, EKS 1.34, clients in a pod inside the cluster; its install guide deploys the controller alone (no lifecycle server, egress sidecar or ingress), which it doesn’t call out | Creates through the full server under runc, cold and from a Pool, 1 to 40 in flight, plus controller-only claims (Test 2) |
| With the transparent proxy: -47.6% requests per second, +91.9% mean latency, +595.2% p99, about 5x the sidecar’s memory | The egress component’s benchmark notes, “illustrative only” | One machine; HEAD requests over HTTPS to 40 public sites at once, 400 in all; the memory figure from a separate download run; against the sidecar without the proxy | The same comparison over plain HTTP inside the cluster, with the name lookup taken out because here it costs more than the proxy, plus the other egress layers and part 5’s SigV4 addon (Test 4) |
| Firecracker creates: 64 ms p50 one at a time, 125.4 ms p99 at 10 in flight | The Fast Sandbox performance notes, “engineering measurements, not a production latency guarantee” | Two ACK (Alibaba Cloud’s Kubernetes service) nodes with 192 AMD EPYC 9T95 CPUs each, release 1.1.1-rc.1; the two figures come from two different runs | Not tested |
The Firecracker numbers weren’t tested, and couldn’t be here. They belong to the Fast Sandbox profile, a separate platform for Firecracker microVMs that this series never installed (part 1 lists what it needs). Kata with Firecracker isn’t here either: part 2 installed only Kata’s QEMU and Cloud Hypervisor runtime classes, and every Kata number below is kata-qemu.
It reuses part 3’s Pools and Kata switch, part 4’s egress sidecar and vault, and part 5’s SigV4 addon. Every number comes from my runs on November 1, 2026 (UTC); I say when something comes from the code or the docs instead.
Architecture
A stress test measures its own harness as much as the system, unless the harness stays out of the way. Most of this one is about where each client runs and what reads the numbers:
The client paths matter most, because a number from one path can’t be set beside a number from another:
| Client | Path | Used by |
|---|---|---|
A pod next to the server, osb-stress-client | The SDK, opensandbox==1.2.0, to the server’s Service, server proxy on | Test 2’s timed creates, cold, warm and the delivery |
| My Mac | The SDK through kubectl port-forward to 127.0.0.1:18080 | The creates of Tests 1, 3, 4 and 6 and Test 5’s waves, where the create time isn’t the result; Test 3’s pauses and resumes; one comparison pair in Test 2 |
| My Mac, no server | A BatchSandbox sent straight to the Kubernetes API through kubectl proxy, timed with a watch | Test 2’s controller-path claims |
| A Job next to the server | 1 to 64 keep-alive clients to the server’s Service | Test 5’s API ramp |
| Inside a sandbox | A load generator to the echo server, or boto3 to STS | Test 4’s ladder; Test 6’s victims |
The numbers come from a kubelet sampler on my Mac every 2 or 5 seconds, a VM sampler on each node during the Kata runs, and Container Insights for the one-minute view.
Setup
Step 1: The companion code
The scripts need part 2’s 01_cluster.sh to 05_gateway.sh, part 3’s server_config.py (every server change goes through it) and its 00_snapshot_config.sh before the pause storm, and, for the SigV4 rung only, part 5’s roles, broker and images, plus Docker with buildx and uv for its build_egress.sh.
git clone https://github.com/fabiodouek/my2centsai-blog-samples.git
cd my2centsai-blog-samples/opensandbox-stress
uv sync| Script | What it measures | Server changes, always put back |
|---|---|---|
01_metrics.sh | Turns Container Insights on, metrics only (Step 2) | None; the cluster gets the CloudWatch add-on |
02_density.py | Test 1: idle sandboxes until refusal, three ways | --runtime kata-qemu for the Kata runs |
03_latency.py | Test 2: creates at 1 to 40 in flight, cold and warm, the controller path, a Pool delivery | None |
04_pause_storm.py | Test 3: 20 pauses and 20 resumes at once | None |
05_egress_ladder.py | Test 4: the egress overhead ladder; with --resolve-once, the lookup-free variant | --egress-mode dns for one rung; part 5’s egress-sigv4 image for the last |
06_control_plane.py | Test 5: the server and controller under an API ramp and create waves | None |
07_noisy.py | Test 6: CPU and disk hogs next to victims, runc and Kata | --runtime kata-qemu for the Kata runs |
08_cloudwatch.py | What CloudWatch saw: the window’s Container Insights and NAT gateway metrics, read-only | None |
probes/kata_probe.py | Test 1: what one Kata sandbox asks the scheduler for | --runtime kata-qemu, then the baseline |
probes/kata_ceiling.py | Test 1: the scheduler’s accounting at the Kata refusal | --runtime kata-qemu, then the baseline |
probes/kata_plain.py | Test 1: the same fill with bare pods and no OpenSandbox, Kata and runc with a RuntimeClass overhead | None; a namespace and a RuntimeClass of its own, deleted |
probes/nft_probe.py | Test 4: what a dns+nft lookup’s time is made of, inside the egress sidecar | None |
09_charts.py | Every chart below, light and dark, from results/ | None |
99_cleanup.py | Removes what these scripts leave and turns Container Insights off | --baseline, only if a killed script left the server changed |
Every script prints its plan with --dry-run, without calling kubectl, helm, terraform or aws, and so do the four probes under probes/, which I ran after the main run to answer what it raised. RUNS=1 uv run python ... makes a quick pass; the default of three took 2.4 hours for 02 to 07.
Step 2: Container Insights, metrics only
Container Insights, the one-minute view, was on for every measurement of the main run. Part 2’s Terraform has it behind one variable, container_insights; when it’s on, the CloudWatch Observability add-on is installed with container logs and Application Signals off:
amazon-cloudwatch-observability = {
  addon_version = "v7.0.0-eksbuild.1"
  # Metrics only: no container logs, no Application Signals.
  configuration_values = jsonencode({
    containerLogs = { enabled = false }
    manager       = { applicationSignals = { autoMonitor = { monitorAllServices = false } } }
  })
  pod_identity_association = [{
    role_arn        = aws_iam_role.pod_identity["cloudwatch-agent"].arn
    service_account = "cloudwatch-agent"
  }]
}
01_metrics.sh plans with that variable flipped and the values the cluster was built with, read from the Terraform state, refuses any plan that changes more than the add-on, and applies exactly that saved plan, because part 2’s Terraform also owns the node group and the allow-list:
$ ./01_metrics.sh

== terraform plan -var container_insights=true
  Plan: 3 to add, 0 to change, 0 to destroy.
  ok    aws_iam_role.pod_identity["cloudwatch-agent"]: create
  ok    aws_iam_role_policy_attachment.cloudwatch[0]: create
  ok    module.eks.aws_eks_addon.this["amazon-cloudwatch-observability"]: create
3 change(s), all of them the CloudWatch add-on's
   took 7s

== terraform apply (the saved plan, nothing else)
Apply complete! Resources: 3 added, 0 changed, 0 destroyed.
   took 39s

== checks
  ok    add-on amazon-cloudwatch-observability ACTIVE
  ok    DaemonSet amazon-cloudwatch/cloudwatch-agent 2/2 Ready
  ok    2 agent pod(s) with EKS Pod Identity credentials
  ok    metrics window starts 2026-11-01T13:58:43Z (results/metrics-window.json)
   took 5s

  total                      54s
Container Insights is on
99_cleanup.py turns it off through the same checked plan.
Step 3: A kubelet sampler for the fine-grained view
One-minute points can’t show a 30-second load phase, so every script also runs Sampler (in common.py, on top of measure.py), which reads GET /api/v1/nodes/<node>/proxy/stats/summary for both nodes every 2 or 5 seconds and writes results/<name>.csv:
t,node,pod,cpu_m,mem_mib
781.1,node-a,_node,646.0,4552.9
781.1,node-a,50541061-aa1e-4179-9f88-feee7c81e6be-0,0.8,67.9
781.1,node-a,414858c7-edb9-4962-8883-6aca5f1d7b7d-0,150.9,66.3
781.1,node-a,bc689c38-0d7b-4e40-bd57-d8a89d1215c6-0,0.8,67.0
cpu_m is millicores and mem_mib the kubelet’s working set; a value not reported yet stays empty, never 0 (though the kubelet itself reports 0 before a container’s first CPU rate), and nodes are node-a and node-b because an EKS node name holds its IP. Tests 1, 4 and 5 also record each container’s resident memory and cumulative CPU counter, which the kubelet refreshes about every 10 seconds, so an average over a load phase (window_cpu() in measure.py) needs two readings inside it at least 10 seconds apart; without them the CPU is “unknown”, never idle.
Step 4: Start every test from zero
Each script first calls preconditions() (in common.py), which refuses to start unless no sandboxes, Pools or leftover objects exist, both nodes are Ready, and the server is on runc, the base egress image and dns+nft, on a settled Helm release:
== preconditions
  ok    no sandboxes, no Pools, none of this directory's objects; server runc, egress base dns+nft, ingress gateway (revision 29, Helm's latest); 2 nodes Ready
Three more rules hold everywhere:
- Three runs, the median and the spread (max minus min), next to the pooled percentiles.
- Failures are never samples. A failed create, request, resume or claim is counted, never timed, and a run with any is left out of the medians.
- The server always comes back. Changes go through part 3’s
server_config.pyinsideserver_session()(incommon.py), whosefinallyruns--baselineand reads it back, also after Ctrl-C or a closed terminal.
Part 4’s echo server, part 5’s broker, the console and the gateway stayed up, as on a real cluster, and they count in Test 1’s pod-slot arithmetic.
Testing
All output below is from the recorded runs, trimmed and masked: nodes as node-a and node-b, the registry as <registry>.
Test 1: Density, three ways
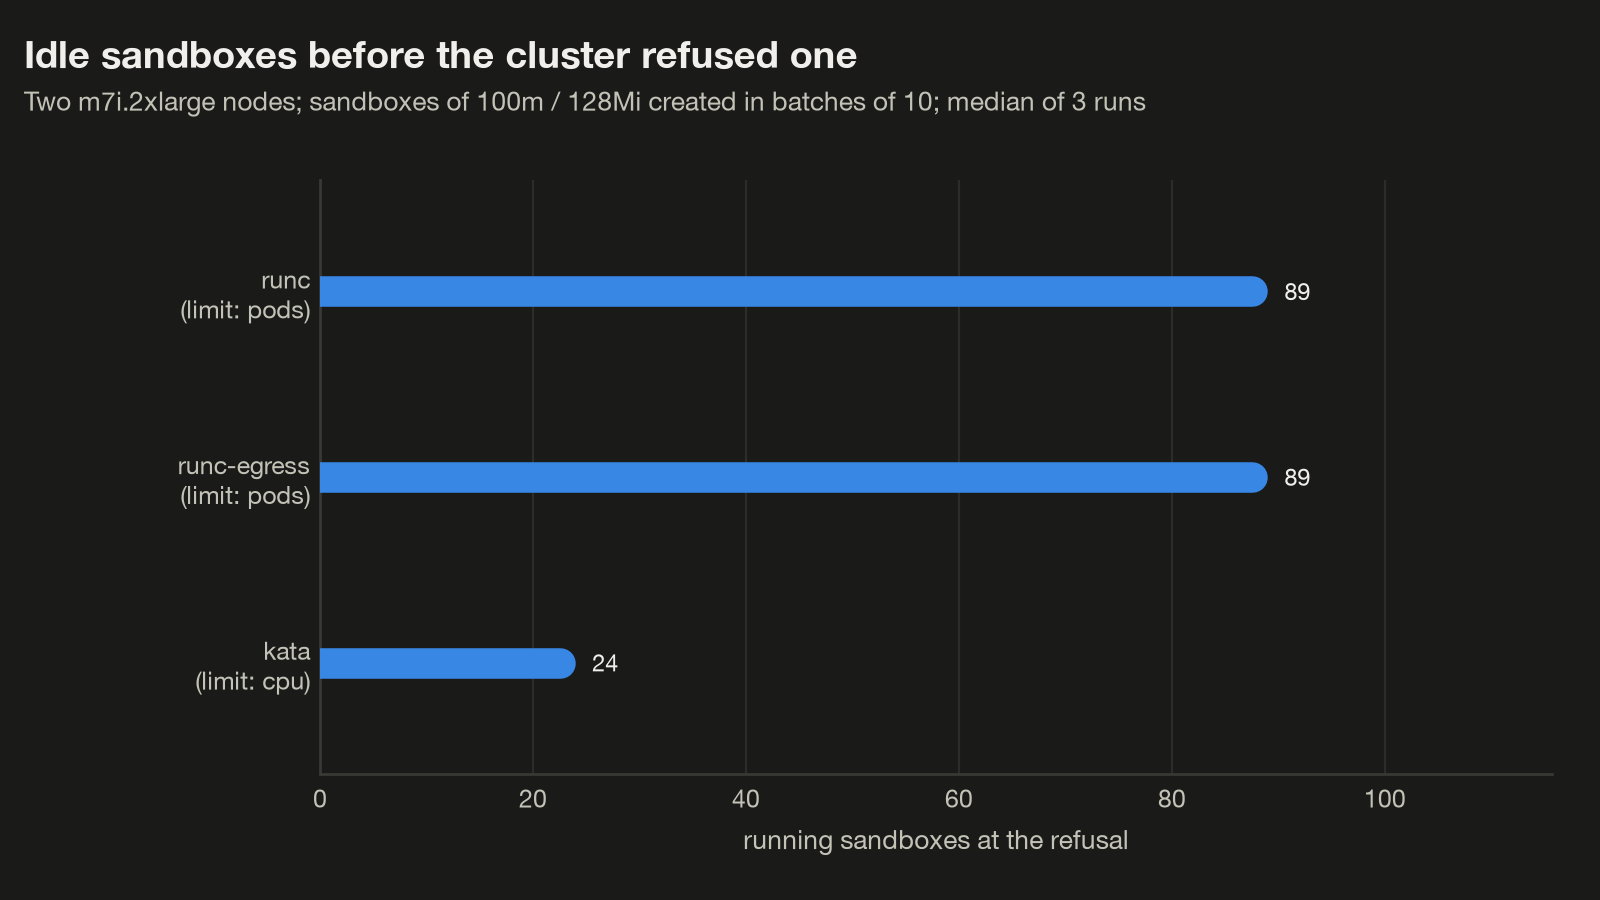
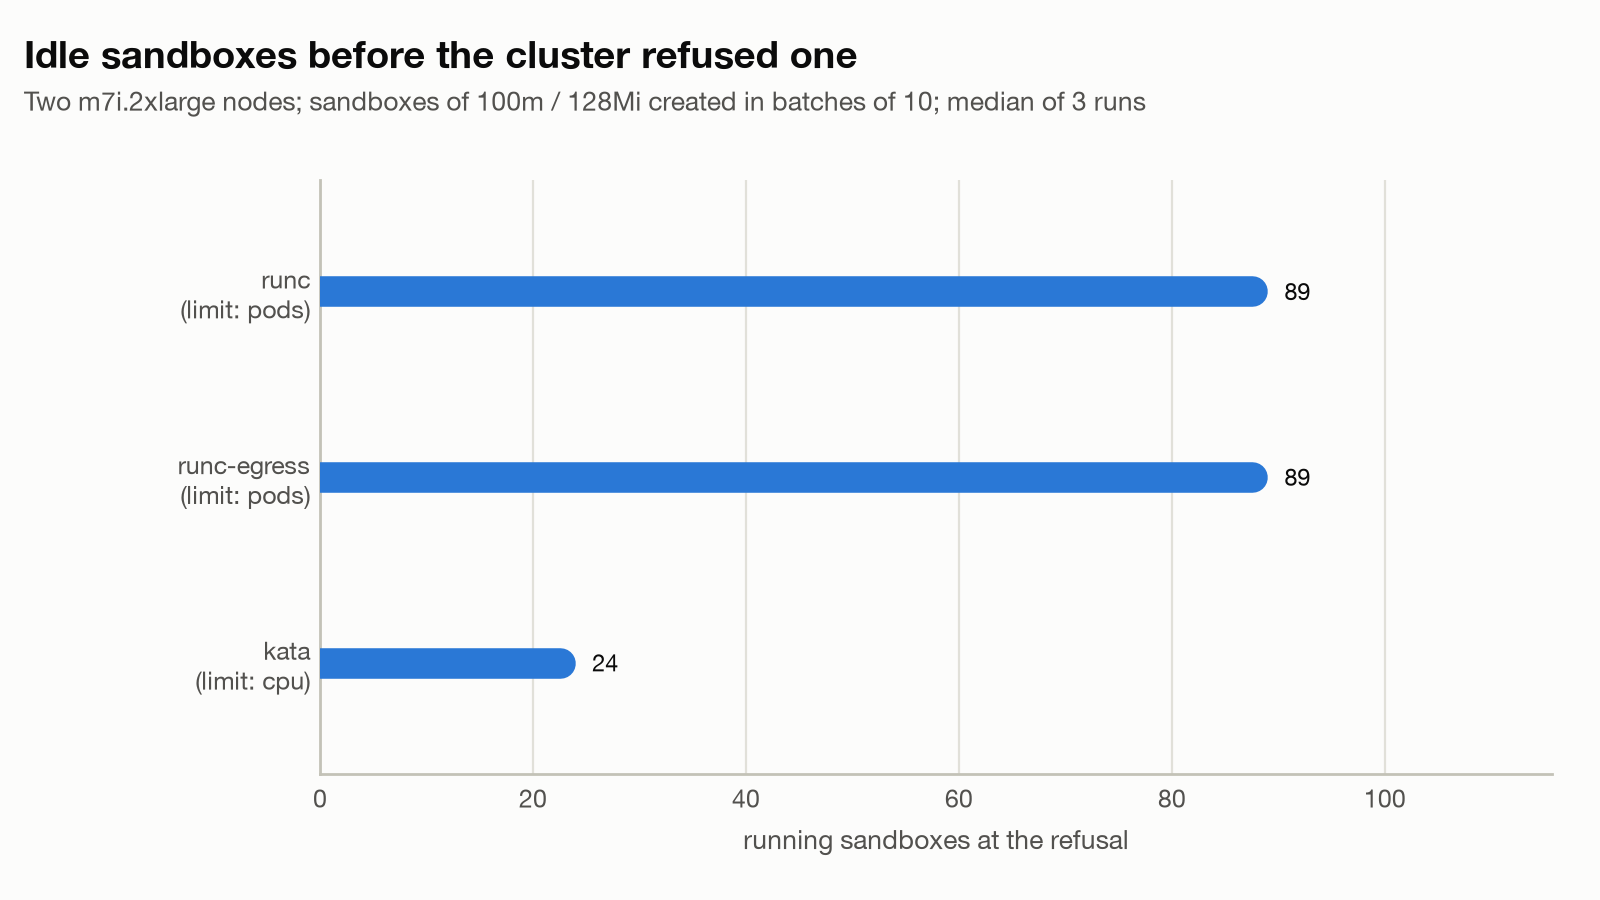
02_density.py creates idle sandboxes, 100m CPU and 128Mi each with requests equal to limits, 10 at a time, until a create fails, and does it three times from zero in each of three modes:
- runc: no network policy, so one container per sandbox.
- runc with egress: a deny-by-default policy that allows one host, and the credential proxy on, the way parts 4 and 5 run it. Every sandbox gets the egress sidecar with its DNS proxy, nftables and transparent proxy.
- Kata: the server switched to
kata-qemu, a VM per sandbox. The RuntimeClass adds 250m CPU and 160Mi to every pod’s request.
The sandboxes are idle and small on purpose, so what runs out is the platform’s own cost per sandbox. The server deletes a sandbox whose create timed out (more on that below), so a Watcher thread in 02_density.py keeps every pod the scheduler failed to place, and refusal() in checks.py reads the reason from them.
== density
  mode           ceiling (median, spread)  limit           MiB per sandbox  sidecar RSS
  runc                             89 (0)  pods                        5.7            -
  runc-egress                      89 (0)  pods                       69.0         58.9
  kata                             24 (1)  cpu                         0.0            -
  the egress sidecar multiplies an idle sandbox's memory by 12.11
  kata: the scheduler reserves 288 MiB per sandbox (128Mi request + the RuntimeClass's 160Mi overhead)
        on the node a VM's processes hold 507.7 MiB (QEMU 364.5); the kubelet counts 0.0 MiB for the pod: a gap of 507.7 MiB per sandbox (medians of 3 runs)
The log’s last line calls the summed resident memory of a Kata VM’s processes a per-sandbox gap; that sum counts shared pages more than once, as below.
| Mode | Ceiling, median of 3 (spread) | What ran out | The pod’s working set, per the kubelet | The nodes’ working set, per added sandbox |
|---|---|---|---|---|
| runc | 89 (0) | Pod slots | 5.7 MiB | 13 MiB |
| runc with egress | 89 (0) | Pod slots | 69.0 MiB, the sidecar’s resident memory 58.9 MiB | 72 MiB |
| Kata | 24 (1) | CPU, as the scheduler counts it (overhead twice) | 0 MiB | 324 MiB |
The last column is the growth of both nodes’ working set per added sandbox, median of the three runs, over 70 sandboxes under runc and over the step from 10 to 20 under Kata (runs: 324.4, 352.3 and 321.8 MiB).
runc stopped at pod slots, with or without the sidecar. An m7i.2xlarge takes 58 pods, the VPC CNI’s limit for this instance type without prefix delegation, so the two nodes have 116 slots. Everything else held 27: kube-system, the CloudWatch agent, OpenSandbox’s own pods, part 4’s echo server and part 5’s broker. Every run ended on 0/2 nodes are available: 2 Too many pods., with the two nodes’ working set at 5.6 GiB without the sidecar and 10.9 GiB with it, of 64. Prefix delegation or bigger nodes would move the ceiling; this test doesn’t say where to.
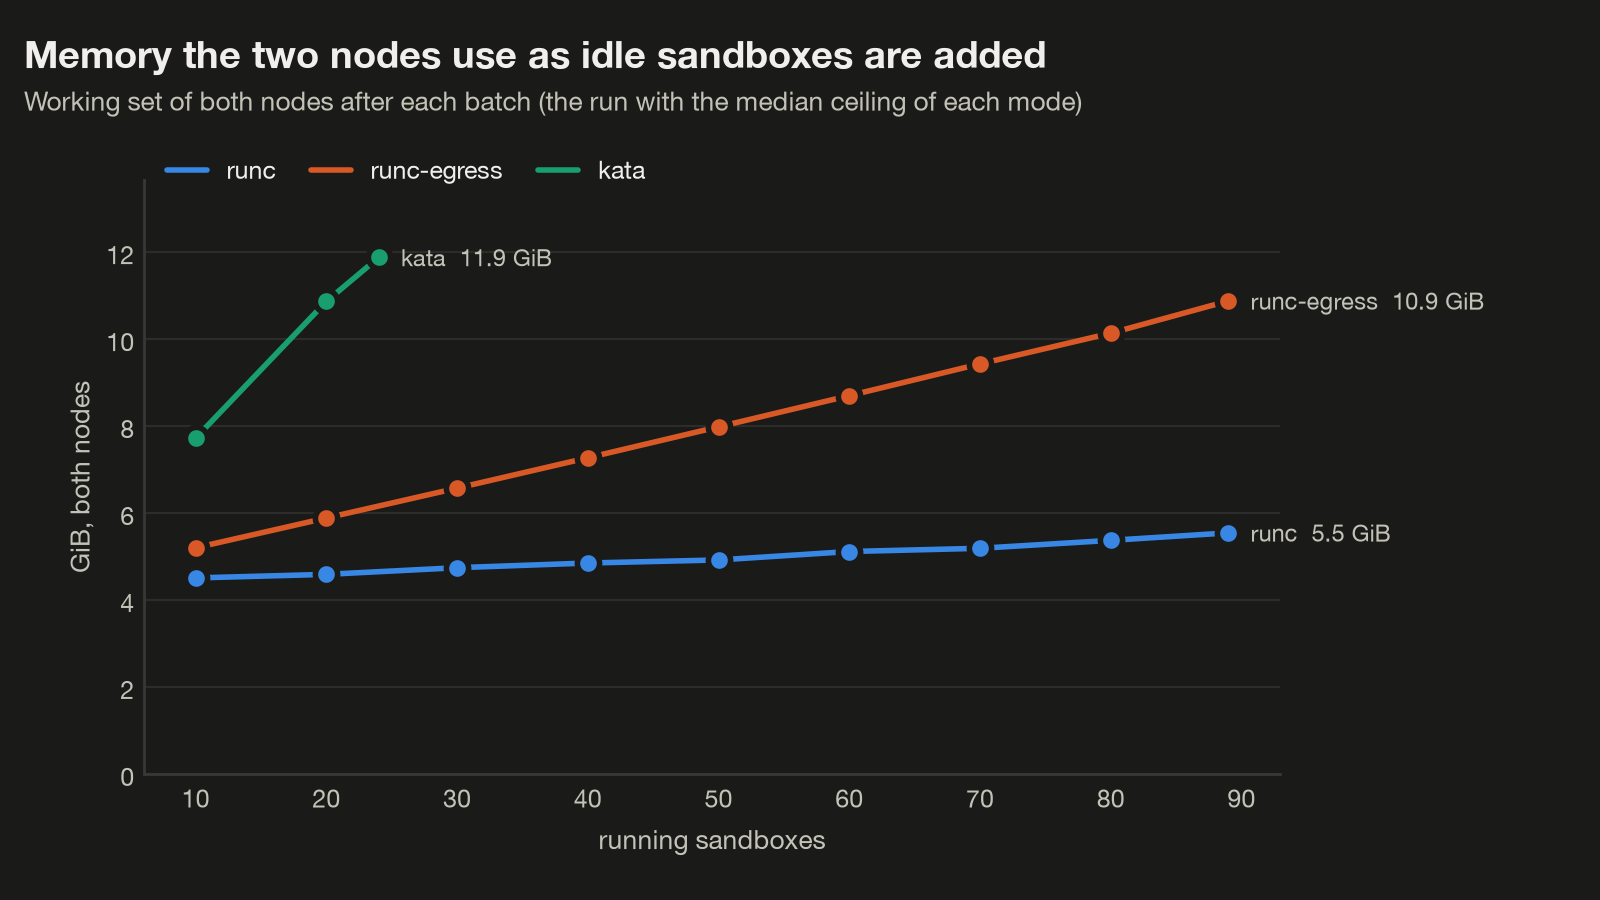
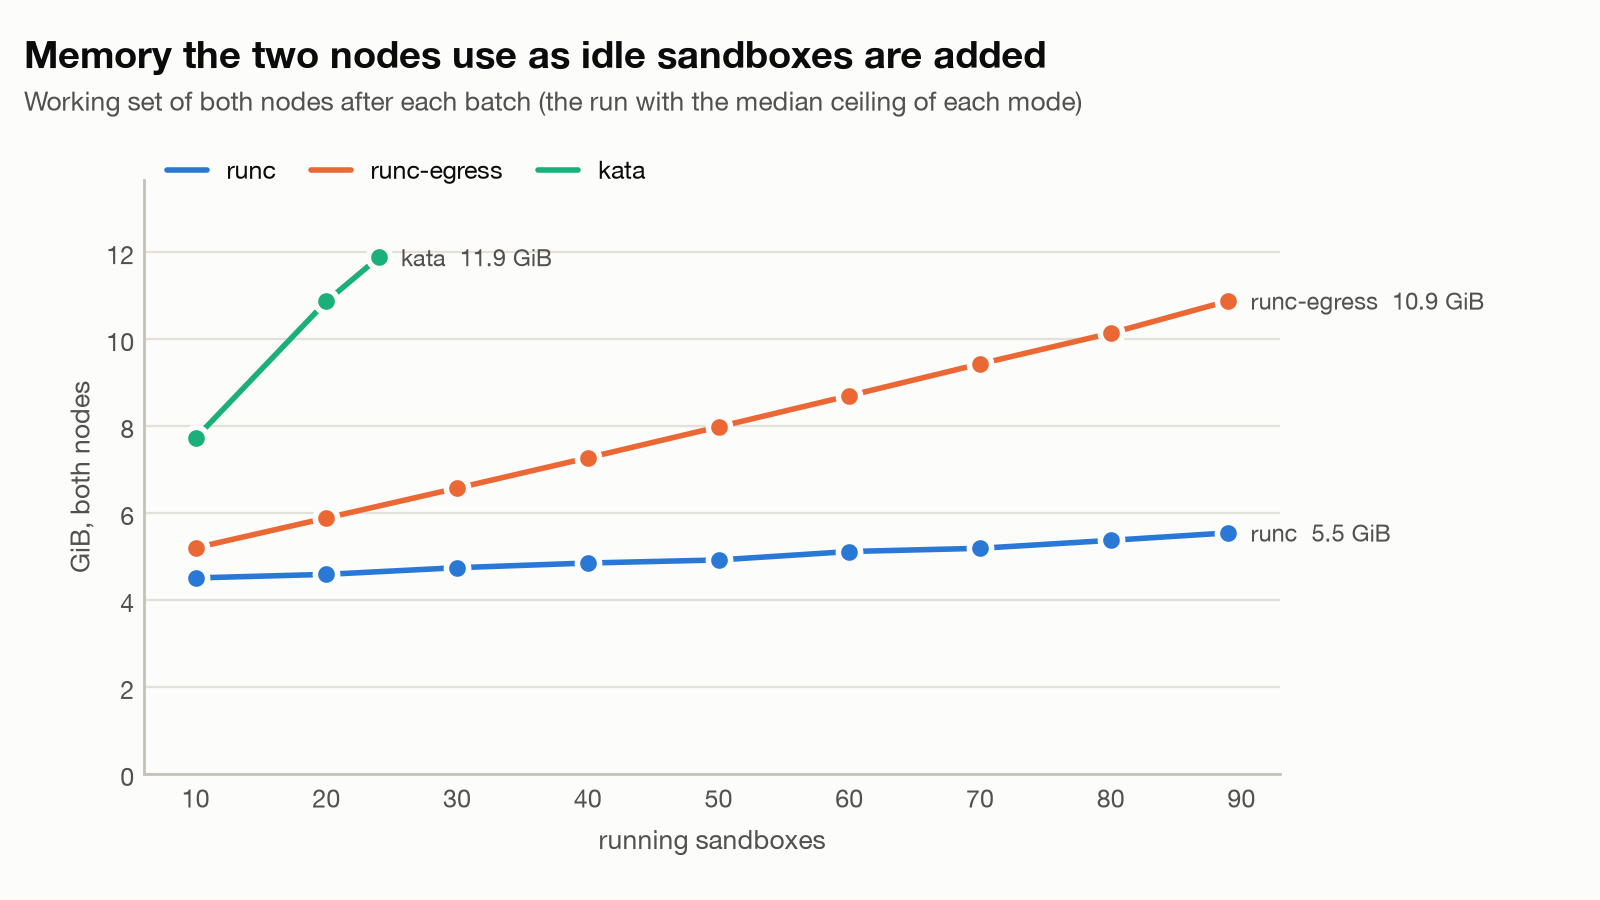
The egress sidecar is invisible to the scheduler. It took an idle sandbox’s pod from 5.7 to 69.0 MiB and cost the nodes about 60 MiB more per sandbox, yet the ceiling didn’t move. 1.2.0 can give the sidecar requests and limits under [egress] (config.py), but part 2’s config, like the default, sets neither. At the ceiling that was 5.3 GiB no reservation covered: harmless here, not on nodes with less memory per pod slot.
Kata stopped at CPU, because Kubernetes counts its overhead twice. Every run ended on 0/2 nodes are available: 2 Insufficient cpu. at 24 sandboxes at the median, 12 a node (13 on node-b in run 1), though each pod asks for only 350m (its 100m plus the RuntimeClass’s 250m, as probes/kata_probe.py confirmed). probes/kata_ceiling.py reproduced it with about 3 CPU free per node in every view I checked (59.9% and 62.3% requested); working back from the counts, the scheduler counted 567 to 599m per Kata pod. A control run without OpenSandbox, probes/kata_plain.py, stopped at the same 12 per node, with bare kata-qemu pods and with plain runc pods under a RuntimeClass with the same overhead.
The cause is in Kubernetes 1.37, not in OpenSandbox or Kata: since 1.36 the kubelet writes a pod’s total request, overhead included, into its status, and the scheduler adds the overhead again for every pod already on the node, about 600m each, while it counts the pod being placed at 350m. It’s kubernetes/kubernetes#143257, open since October 21, 2026, with a fix, #143263, unmerged as of November 7, 2026. Until a fix ships, that accounting, not memory, sets Kata density here.
The arithmetic, the Kubernetes source and the options
probes/kata_ceiling.py placed 24 sandboxes, 12 per node, with nothing terminating or nominated and every pod Ready 2 to 3 seconds after binding; pod specs, container statuses and kubectl describe node left 3,170 and 2,985m free. A Kata sandbox’s pod has no init-container request and no sidecar (probes/kata_probe.py). The runc pods in probes/kata_plain.py carried the same 250m and 160Mi overhead and counted 567 to 599m each.
The mechanism is verified in the v1.37.2 source, though I didn’t check which 1.37 patch version EKS runs. The status write comes with InPlacePodLevelResourcesVerticalScaling, on by default since 1.36: 350m per Kata pod here, by the code (I didn’t read that field on the cluster; the runc control with the same overhead reproduced the count). At the probe, node-a’s other pods requested 540m: 540 + 11 × 600 + 350 = 7,490m admits the 12th sandbox, and a 13th would make 8,090m, over the 7,910m allocatable; node-b’s other pods, at 725m, leave room for 12 as well. In Test 1, with Container Insights’ pods also on the nodes, node-b’s other pods requested about 995m, so the strict model admits only 11 there (7,945m with the 12th); 12 landed in every run and 13 in run 1, all in batches of ten created at once. A pod whose status the kubelet hasn’t written yet counts once, which would leave room for them (inferred). kubectl describe node counts each pod once, hence the 60%. Counted once, the same CPU would fit about 21 and 20 per node, if memory, pod slots or VM start-up didn’t bind first; that’s inferred, not measured.
Kubernetes source, v1.37.2: the scheduler’s per-pod count in types.go, the status read in helpers.go and the overhead added on top at L167-L170, the incoming pod’s count in fit.go, and the kubelet’s status write in kubelet_pods.go.
Three things would lift it: the upstream fix, once a Kubernetes patch release carries it and the cluster runs that release; the feature gate turned off on kube-scheduler and the kubelets, which I didn’t check EKS’s managed control plane allows; or a RuntimeClass with no overhead, which is yours to change but makes the scheduler reserve nothing for the VM.
The kubelet doesn’t see a Kata sandbox’s memory. For one idle Kata sandbox, four numbers:
| One idle Kata sandbox | MiB, median of 3 runs |
|---|---|
| What the scheduler reserves: the 128Mi request plus the RuntimeClass’s 160Mi | 288 |
| What the kubelet reports for the pod, its working set | 0 |
| How much the nodes’ working set grew per added Kata sandbox | 324 |
| The resident memory of the VM’s processes, summed: QEMU 364.5, virtiofsd 99.1, the Kata shim 44.2 | 507.7 |
The sum is an upper bound: resident memory counts a page in every process that maps it, and virtiofsd, a vhost-user backend, maps the guest’s memory, so pages QEMU holds can count twice. The nodes’ working-set growth is the better measure. The chart shows all four:
How the VMs' memory was read
The nodes run Kata with sandbox_cgroup_only = false, under which a VM’s processes may be accounted outside the pod’s cgroup, so I measured the result: VmmSampler (in common.py) put a privileged busybox pod on each node (manifests/vmm-sampler.yaml) that read every QEMU, virtiofsd and shim process from /proc every 5 seconds and matched each VM to its pod (25 of 25, 24 of 24, 24 of 24).
So an idle Kata sandbox cost the nodes about 324 MiB, 36 MiB more than reserved, about 437 MiB on a full node of 12. That answers the question part 3 left open: the gap is smaller than setting one QEMU process (272 MiB in part 2) against the 160Mi overhead suggested, because the guest’s memory lives in QEMU’s and the 128Mi request covers it (inferred). The reporting is the problem: the kubelet counted 0 MiB for each Kata pod, so anything watching the kubelet’s pod numbers sees a Kata sandbox as almost free. Here none of it became memory pressure (11.9 GiB on the two nodes at the ceiling). These were idle sandboxes a minute or two after boot; I didn’t measure a busy guest.
A Kata run, batch by batch
$ uv run python 02_density.py
...
== kata, run 1 of 3 (sandboxes tagged run=1c618cbe19)
  [14:25:05] +1581.7s  batch  1:  10 running {'node-a': 5, 'node-b': 5}, 0 failed; nodes node-a 3.3 GiB, node-b 3.7 GiB; sandbox 0.0 MiB
  [14:25:21] +1597.3s  batch  2:  20 running {'node-a': 11, 'node-b': 9}, 0 failed; nodes node-a 5.7 GiB, node-b 4.5 GiB; sandbox 0.0 MiB
  [14:26:01] +1637.6s  batch  3:  25 running {'node-a': 12, 'node-b': 13}, 5 failed; nodes node-a 6.0 GiB, node-b 6.1 GiB; sandbox 0.0 MiB
  [14:26:04] +1640.9s  refused: cpu (0/2 nodes are available: 2 Insufficient cpu.)
  [14:26:29] +1665.7s  node side: a VM's processes hold 507.7 MiB (QEMU 364.5), the kubelet sees 0.0 MiB for its pod: 507.7 MiB it does not count (25 of 25 VMs paired by pod)
  [14:26:29] +1665.7s  deleting 25 sandboxes of this run
A full cluster also doesn’t say it’s full. Every failing create ended in the SDK’s SandboxTimeoutException, the reason only in the scheduler’s events. By the code, the SDK gives up after its default 30 seconds (connection_sync.py), and the server, after sandbox_create_timeout_seconds (60 by default, config.py), answers 504 KUBERNETES::POD_READY_TIMEOUT (kubernetes_service.py) and deletes the workload (L1260-L1283). A control plane that fills a cluster has to watch scheduling events and retry refused creates itself.
Test 2: Create latency, cold and from a Pool
Part 3 timed its creates from my Mac through kubectl port-forward, fine one at a time but not at 40. 03_latency.py times them from osb-stress-client, a pod next to the server with the same SDK, calling the server’s Service; my Mac drives it with kubectl exec, outside the timed span.
A create is timed from the SDK call until SandboxSync.create() returns with a healthy sandbox, polled every 200 ms, the SDK’s default (sandbox.py); the Fast Sandbox measurements polled every 10 ms. Sandboxes are 250m and 512Mi, so 40 fit at once. Every level has at least 30 samples after a discarded warm-up; below 100, the nearest-rank p99 is the maximum, so I report p95.
Cold creates start a new pod each, with the image already on both nodes. Warm ones pass extensions={"poolRef": "osb-stress-pool"} and take a Ready pod from a Pool of 40 that may not grow, so no replacement starts during a measured round; between rounds it refills. It filled 21.2 seconds after kubectl apply.
$ uv run python 03_latency.py
...
== create latency (ms; in-cluster client; p99 is the maximum below 100 samples, so p95)
  in flight   cold p50     p95    warm p50     p95
          1     1712.1  1995.7       130.4   233.5
          5     1371.2  1930.3       218.0   294.3
         10     1980.8  2879.6       428.3   782.7
         20     3487.3  4124.3       647.7  1195.2
         40     5297.0 26140.7      1283.5  1733.3
  via port-forward (laptop), x1: cold p50 2277.4 ms, warm p50 1245.0 ms (a different path: not comparable with the rows above)
  delivery of 84 (58 pod slots per node x 2 nodes = 116, minus 28 pods already placed (system pods), minus 4 headroom = 84: 84 instead of 100)
controller path allocated in 473.8 ms (median), in-cluster API path 4060.8 ms; published: 100 in 920 ms (no setup stated)| In flight | Cold p50 | Cold p95 | Warm p50 | Warm p95 |
|---|---|---|---|---|
| 1 | 1,712 ms | 1,996 ms | 130 ms | 234 ms |
| 5 | 1,371 ms | 1,930 ms | 218 ms | 294 ms |
| 10 | 1,981 ms | 2,880 ms | 428 ms | 783 ms |
| 20 | 3,487 ms | 4,124 ms | 648 ms | 1,195 ms |
| 40 | 5,297 ms | 26,141 ms | 1,284 ms | 1,733 ms |
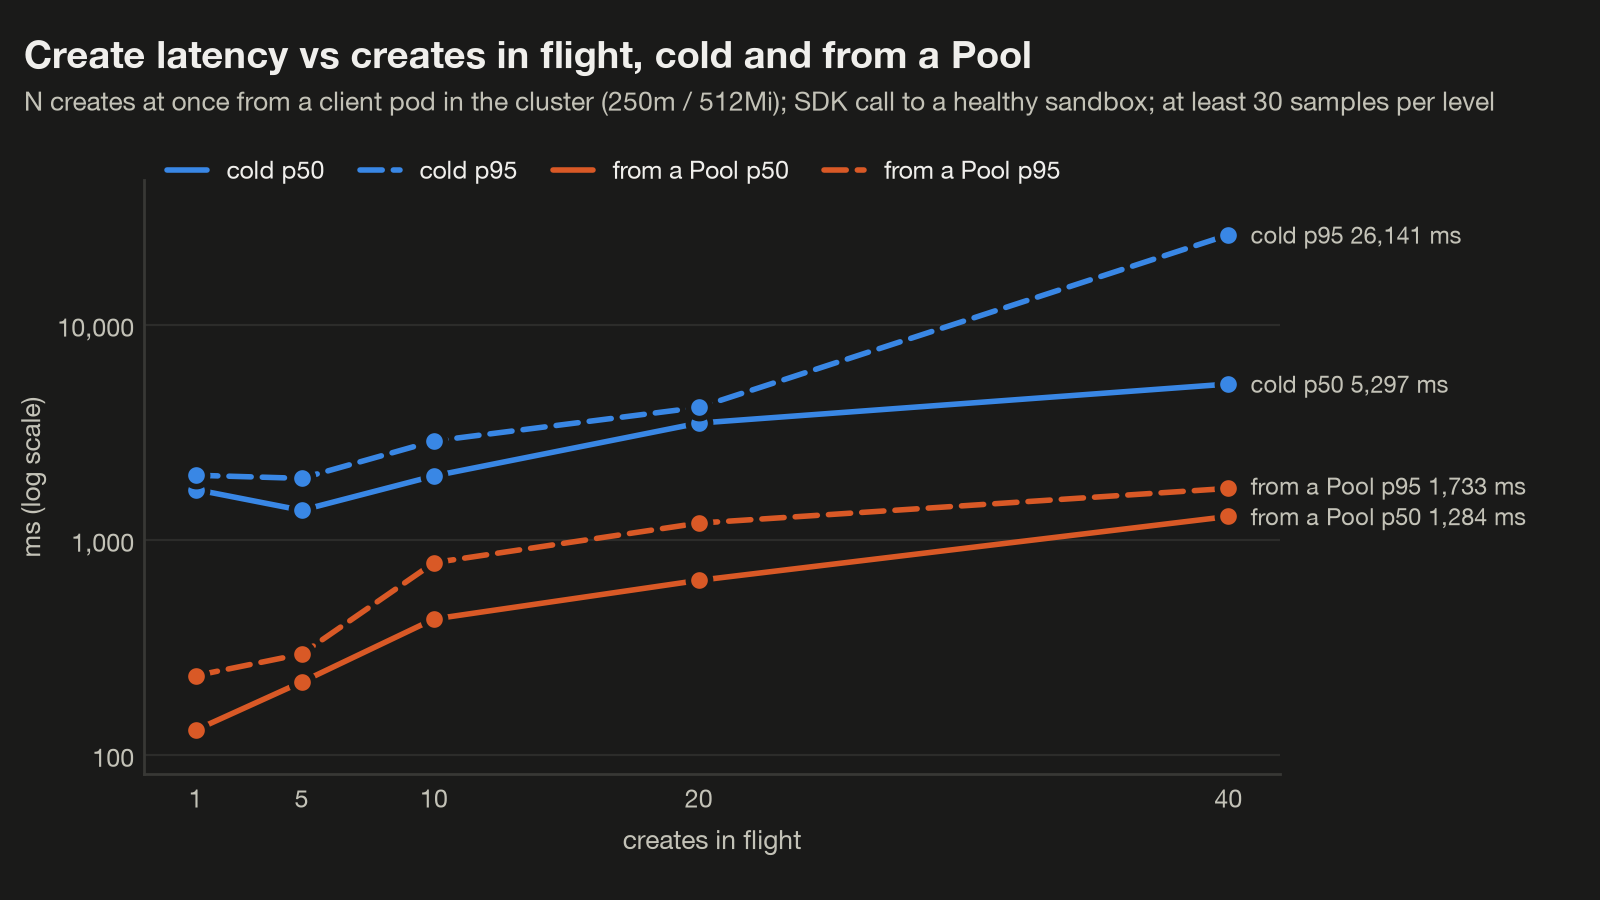
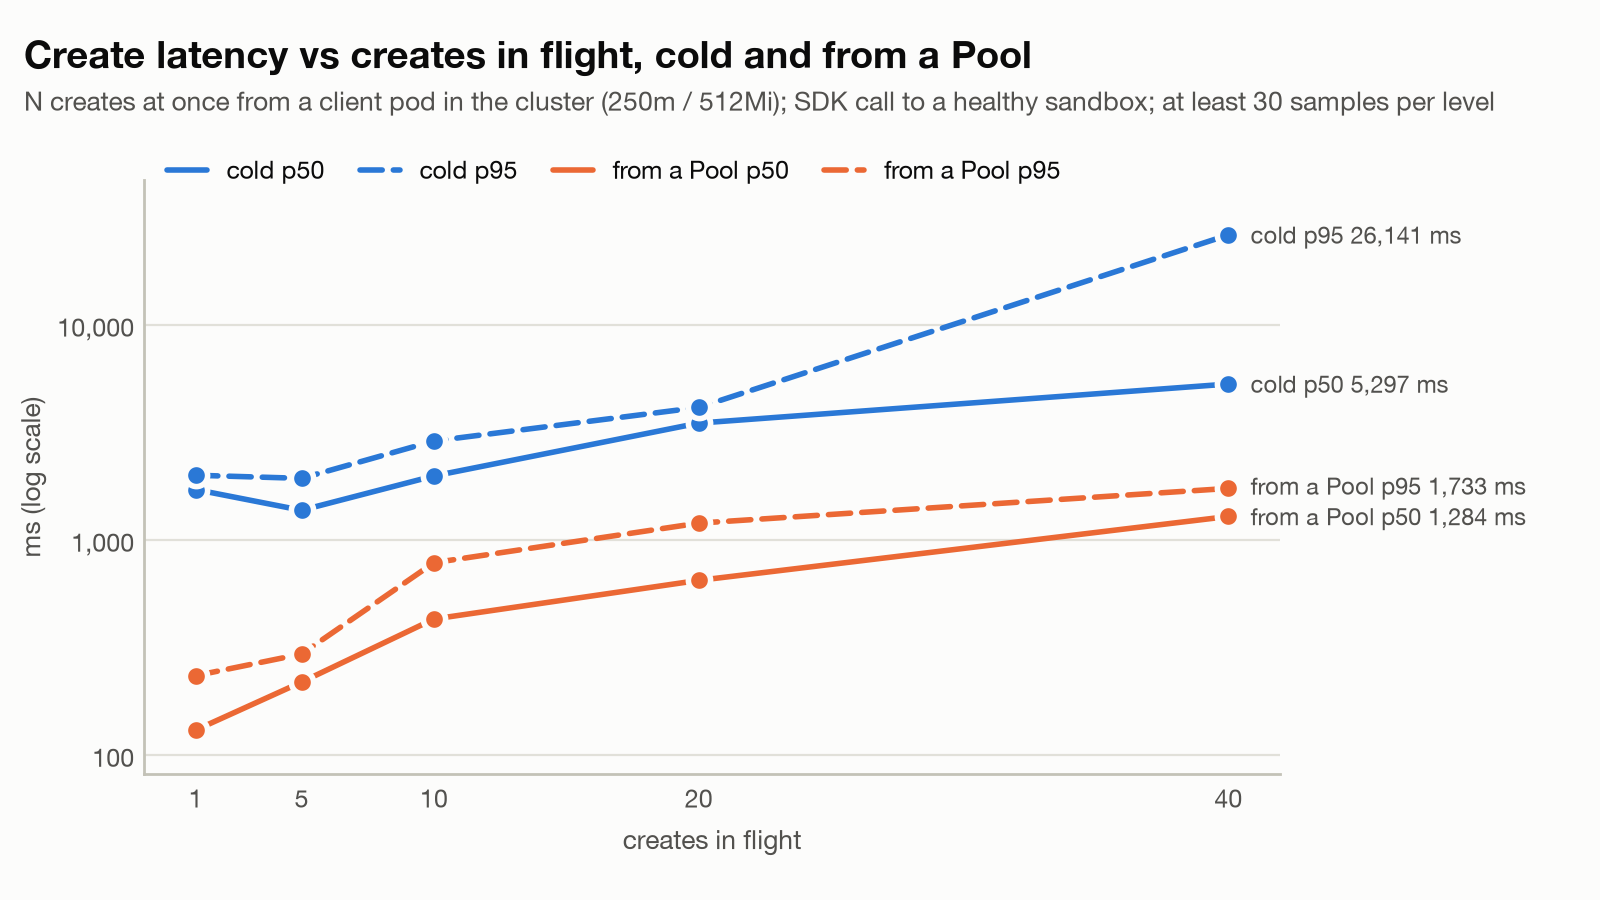
Cold creates stay between 1,371 and 1,981 ms at the median up to 10 in flight and then climb; from a Pool they grow steadily, about 30 ms per extra create in flight. The cold p95 at 40 is a tail: a fifth of the creates at 40 in flight took over 10 seconds (24 of 120; 8 over 20 s; the slowest 31.2 s), and the results don’t say what they waited on. The client, one Python process, didn’t reach the 800m that flags a round as client-bound in any of the 90 rounds, and no create failed.
The port-forward pair. To set beside part 3, single creates also ran from my Mac through the port-forward, same shape and SDK:
| One create at a time, p50 | In-cluster client | My Mac, through the port-forward | Part 3 (port-forward, 1 CPU / 2 GiB, median of 3) |
|---|---|---|---|
| Cold | 1,712 ms | 2,277 ms | 2.7 s |
| Warm, from a Pool | 130 ms | 1,245 ms | 1.3 s |
The forward added 565 ms to a cold create and 1,115 ms to a warm one. So most of part 3’s 1.3 seconds for a warm create was the path from my Mac, not the Pool (its pods were bigger, so treat its column as context).
The controller alone. With a BatchSandbox that has a poolRef sent straight to the Kubernetes API, and no lifecycle server, as the AWS China post’s install guide sets it up, a single claim was allocated in 192 ms at the median from my Mac, about 99 ms without its round trip: the same order as the post’s 230 ms, on different hardware and runtime (Kata with Cloud Hypervisor on c5.metal there, runc on m7i.2xlarge here).
The controller path, claim by claim
The script applies the BatchSandbox through kubectl proxy and times it with a watch: ten single claims and one claim of ten per run, three runs. Each includes my Mac’s round trip to the EKS API, 93 ms (median of ten GET /version).
| Controller path, from my Mac | Allocated, p50 | Ready, p50 | AWS China post |
|---|---|---|---|
| One sandbox | 192 ms | 192 ms | About 230 ms |
| Ten in one object, until all ten | 195 ms | 195 ms | An average of about 140 ms, claiming 10 in a batch |
Ten in one object took 195 ms in all; the post’s 140 ms is an average over a batch claim, likely per sandbox, not the same measure. Its 3.1 seconds cold compares, loosely, with a runc cold create of 1,712 ms through the whole server here and part 3’s Kata creates at 4.2 seconds.
A Pool delivery against 0.92 s. The controller docs give 0.92 seconds for 100 pooled sandboxes as one BatchSandbox, with no setup stated. Here 100 don’t fit: 58 pod slots per node on two nodes, 116, minus the 28 pods already running (Test 1’s 27 plus the in-cluster client), minus 4 of headroom, leaves 84. The script filled a Pool of 84 small pods (100m / 128Mi) in 56.8 seconds and handed them out at once, twice per run: as one BatchSandbox with 84 replicas, and as 84 creates from the in-cluster client.
| Delivery of 84 warm sandboxes | Median of 3 runs (spread) |
|---|---|
Controller: one BatchSandbox, every pod allocated | 474 ms (272) |
| Controller: every pod ready | 474 ms (272) |
| Server: 84 creates at once from the in-cluster client, every one answered; the client was the limit in 3 of 3 runs | 4,061 ms (2,204) |
| Published: 100, setup not stated | 920 ms |
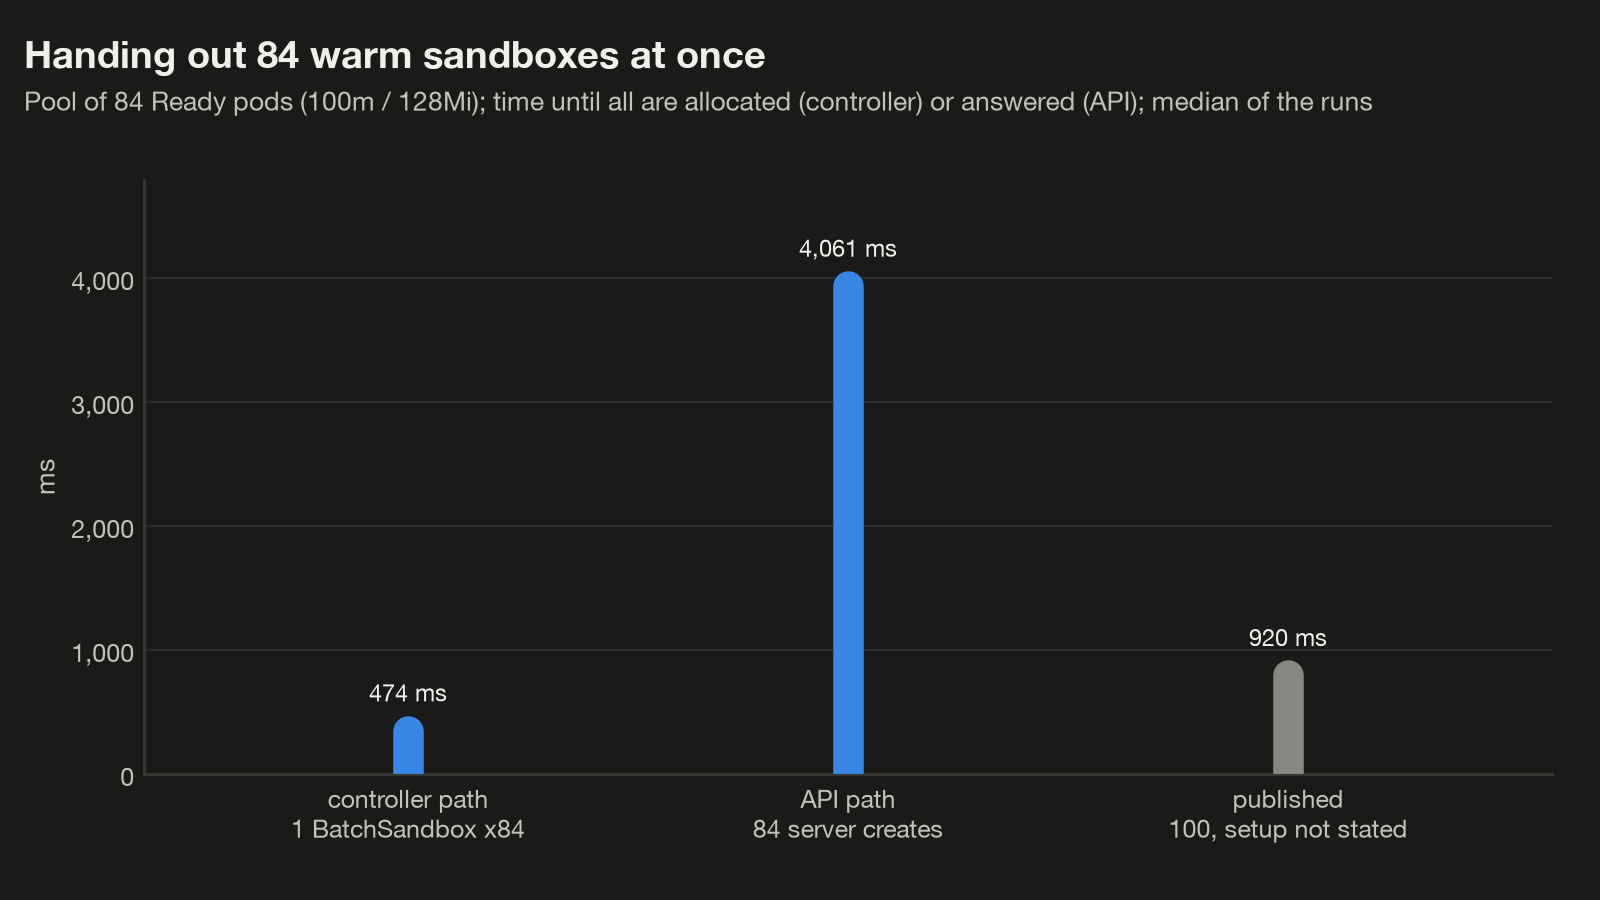
Through the controller, all 84 were allocated in 474 ms at the median (464 to 736 ms over the runs), my Mac’s round trip included: beside the published 0.92 seconds for 100, it neither confirms nor refutes it. Through the server, the in-cluster client was the limit in 3 of 3 runs, so its 4,061 ms is the client’s limit, not the server’s.
Test 3: A pause storm
04_pause_storm.py creates 20 sandboxes (250m / 512Mi), has each write 100 MiB of random data, which doesn’t compress, and record its sha256, then pauses all 20 at once. A snapshot is durable once its SandboxSnapshot reaches Succeed (the commit Job pushed the image to ECR); that and Paused are polled about every 3.4 seconds (a 2-second pause plus the poll itself), which is the resolution of these times. Then all 20 resume at once, timed to a healthy sandbox and to a first command that checks the sha256. Three storms, through part 3’s single ECR repository, from my Mac through the port-forward, as in part 3.
$ uv run python 04_pause_storm.py
...
== storm 1 of 3: 20 sandboxes x 100 MiB (run=61aa1c764a)
  [15:26:25] +  19.6s  20 sandboxes created
  [15:26:30] +  25.4s  20 sandboxes hold 100 MiB of random data each
  [15:26:54] +  49.3s  durable: first after 18.1 s, all 20 after 21.4 s; all Paused after 21.4 s
  [15:26:57] +  51.9s  ECR: 20 image(s) for this storm, 2.96 GB compressed
  [15:27:08] +  62.8s  resumed 20: healthy p50 6612.1 ms, p95 9744.6; data intact in 20
...
== pause storm
  every snapshot durable after 21.4 s (median of 3, spread 3.0 s); all Paused after 21.4 s
resume to healthy p50 7300.6 ms (median of the runs' p50)| Per storm of 20 | Median of 3 storms (spread) |
|---|---|
| First snapshot durable | 14.5 s |
| Every snapshot durable | 21.4 s (3.0) |
Every sandbox Paused | 21.4 s (0.5) |
| One commit Job, p50 | 18.0 s |
| Snapshot images in ECR | 20, 2.96 GB compressed |
| Resume of all 20, to a healthy sandbox, p50 | 7,301 ms (2,140) |
| Resume of all 20, to the first command, p95 | 10,301 ms (651) |
| Data intact after the resume | 60 of 60 |
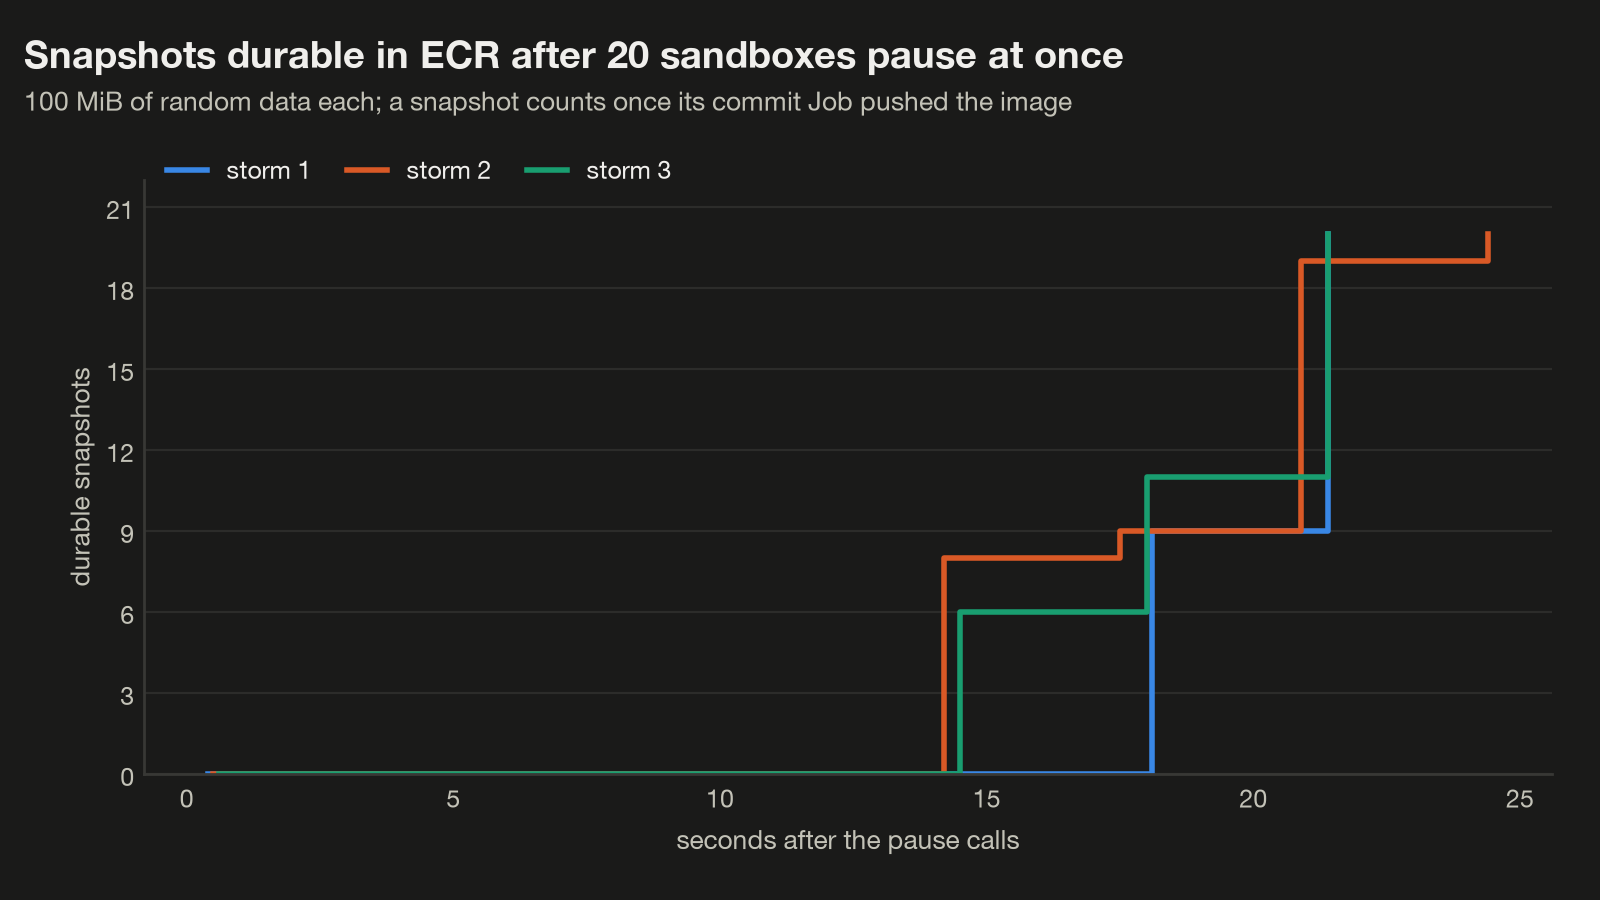
The first snapshot was durable 14.5 seconds after the pause calls and the last at 21.4: the 20 commit Jobs ran side by side, 11 and 9 on the two nodes, each taking 18.0 seconds at the median against 5 for part 3’s single pause. All 60 resumes brought the data back, at 7,301 ms to healthy at the median against 5.3 seconds for part 3’s single resume.
Pushes to ECR leave through the NAT gateway: part 2’s VPC has an S3 gateway endpoint, which ECR’s layer downloads can use, but no ECR endpoint. What CloudWatch saw is below.
Test 4: The egress overhead ladder
05_egress_ladder.py sends the same requests through one more layer of egress control per rung:
| Rung | What’s on the path |
|---|---|
none | No network policy, so no sidecar |
dns | A deny-by-default policy allowing the echo host, with the server in egress mode dns: the sidecar’s DNS proxy filters names, nothing filters packets |
dns+nft | The same in mode dns+nft, the server Helm chart’s default (values.yaml) and the series’ setting since part 2; the server’s built-in default is dns (config.py): resolved addresses also go into nftables, and a connection to any other address is dropped |
mitm | dns+nft plus the credential proxy: mitmproxy takes every connection to ports 80 and 443 |
vault | mitm plus a Credential Vault binding for the echo host that injects an apiKey header with a dummy value |
sigv4 | Part 5’s addon re-signing STS GetCallerIdentity with the broker’s short-lived credentials, the sandbox holding placeholders only |
Rungs 1 to 5 call echo-stress, part 4’s echo program in three replicas of 500m (limit 1 CPU each), over plain HTTP inside the cluster, from a new 2 CPU / 2 GiB sandbox per run: 50 warm-up requests, 500 one at a time, then 16 clients for 30 seconds. Every request opens a new connection after a name lookup, like one curl per request, and the lookup is timed on its own; one over 10 seconds counts as failed.
A run is flagged target-bound when any echo replica (one Python process) averaged 800m over the load phase, client-bound when the load generator averaged 1,600m of its 2 CPUs, and unknown without two counter readings 10 seconds apart (Step 3).
The SigV4 rung calls STS for real, since part 5’s addon kills any host that isn’t AWS, with boto3 keeping its connections open; aws-floor makes the same calls unsigned from a sandbox with no sidecar, and AWS answers 403.
$ uv run python 05_egress_ladder.py
...
== the ladder (medians over the runs)
  rung        1-at-a-time p50      p99    req/s  load p99  sidecar RSS             vs dns+nft
  none                    5.6      7.9   2590.6       7.9         None 18016.1% req/s, -99.7% p99 ?
  dns                     2.5      4.0   4342.5       5.6          8.6 30267.1% req/s, -99.8% p99 * ?
  dns+nft                62.2    148.0     14.3    2271.9         10.3                      - ?
  mitm                   67.5    149.9     14.3    2230.2         64.3  0.0% req/s, -1.8% p99
  vault                  62.4    150.6     14.2    2179.8         64.5 -0.7% req/s, -4.1% p99 ?
  aws-floor               2.8      5.0    819.8      21.5         None 5632.9% req/s, -99.1% p99
  sigv4                   8.1     11.0    133.1     448.4         60.4 830.8% req/s, -80.3% p99
  * an echo replica (one Python process, limit 1000m) reached 800m: that rung's req/s is the echo server's ceiling, not the path's (per-replica numbers in results/ladder.json)
  c the load generator's CPU reached 1600m: the client, not the path, was the cap
  ? in a run of that rung the CPU over the load phase is unknown (counter readings under 10 s apart): whether the echo server or the client was the cap is not known, not ruled out
  published (dns+nft + transparent MITM vs dns+nft, short HTTPS requests to public sites): -47.6% req/s, +91.9% mean, +595.2% p99, ~5x RSS
the sigv4 rung includes AWS's own latency; aws-floor is the unsigned call without a sidecar| Rung | Lookup, p50 | One at a time, p50 / p99 | Requests per second, 16 clients | p50 / p99, 16 clients | Sidecar peak RSS | Flags |
|---|---|---|---|---|---|---|
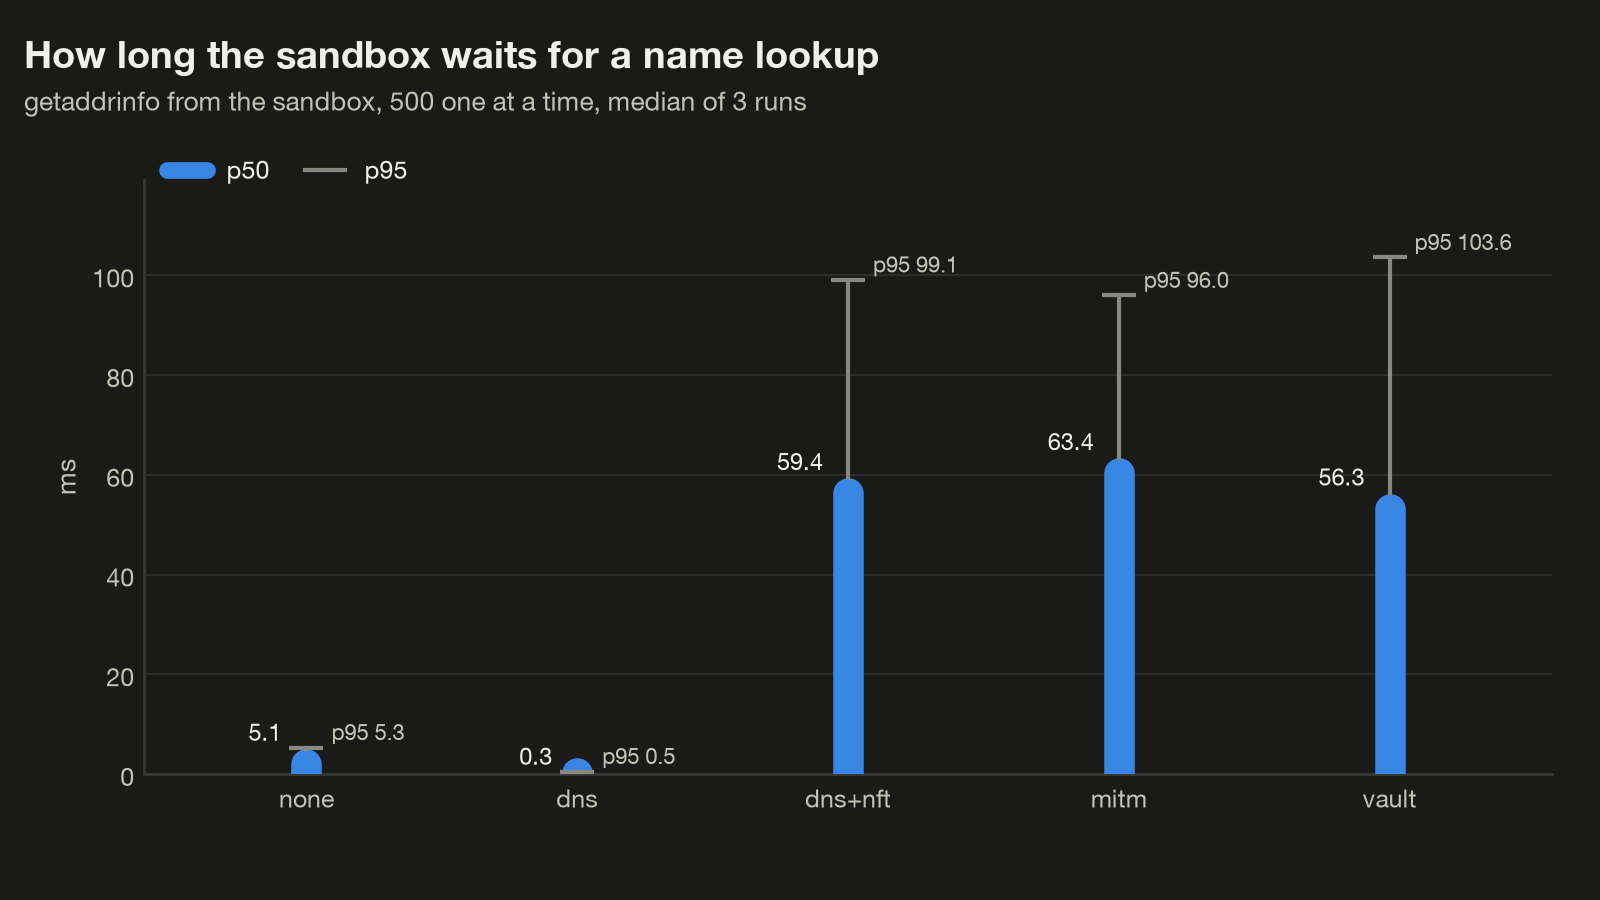
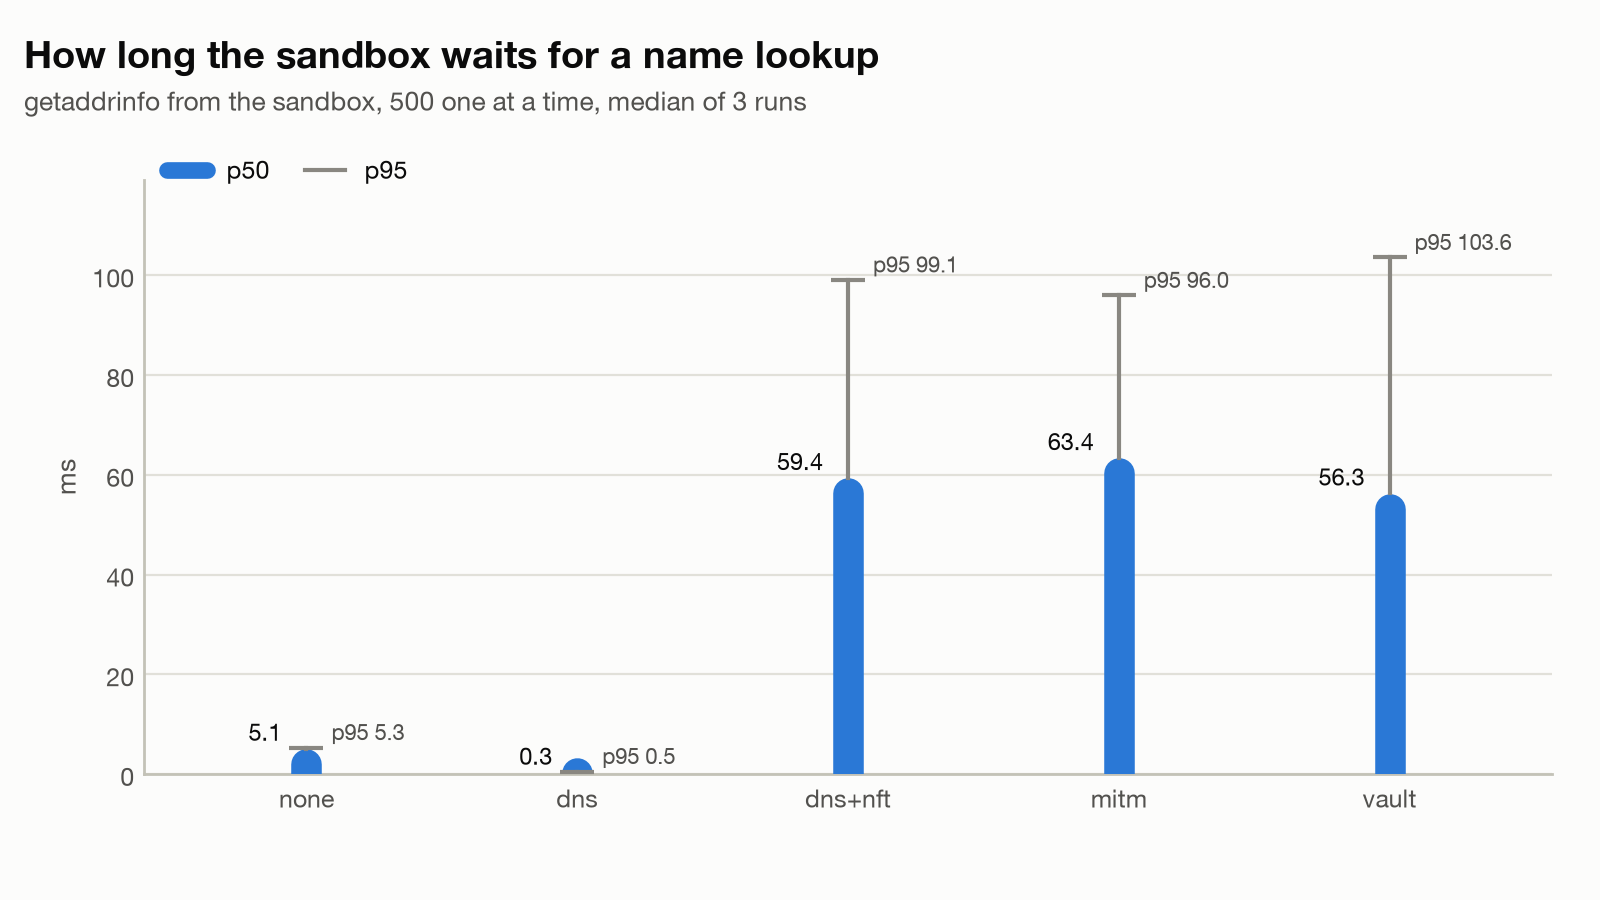
none | 5.1 ms | 5.6 / 7.9 ms | 2,591 | 5.6 / 7.9 ms | No sidecar | CPU unknown in 1 of 3 |
dns | 0.3 ms | 2.5 / 4.0 ms | 4,342 | 3.2 / 5.6 ms | 8.6 MiB | echo server the cap in 1 of 3; CPU unknown in 1 of 3 |
dns+nft | 59 ms | 62 / 148 ms | 14.3 | 1,038 / 2,272 ms | 10.3 MiB | CPU unknown in 1 of 3 |
mitm | 63 ms | 68 / 150 ms | 14.3 | 1,029 / 2,230 ms | 64.3 MiB | none |
vault | 56 ms | 62 / 151 ms | 14.2 | 1,039 / 2,180 ms | 64.5 MiB | CPU unknown in 1 of 3 |
The lookup is the median of the runs’ p50s; one at a time is pooled, 16 clients the median of the runs. No request failed.
In dns+nft mode a name lookup costs about 60 ms, and that’s the ladder’s biggest step. A lookup through the dns+nft sidecar took 59 ms at the median, against 0.3 ms through the same sidecar in dns mode and 5.1 ms with no sidecar. (The dns sidecar likely beats no sidecar by answering the resolver’s search-list attempts itself; inferred.)
The code explains where it comes from: in dns+nft mode the sidecar’s DNS proxy writes each allowed answer’s addresses into nftables before it replies, by starting a new nft -f - process and waiting for it to exit, under one mutex per sidecar, whether or not the address is already in the set. There’s no cache, and no setting short of the server-wide mode below.
So lookups queue, one nft run at a time. With 16 clients opening a new connection per request, all three dns+nft rungs, mitm and vault included, settled at 14.2 to 14.3 requests per second, against 2,591 with no sidecar. That’s a single queue: by Little’s law, 16 clients at 14.3 a second wait 1,119 ms each on average, and the measured mean was 1,102 ms (p50 1,038 ms). The sidecar’s CPU peaked at only 57m, against 2,102m in dns mode.
A probe in the sidecar, probes/nft_probe.py, and the kernel source put the time in one place. nft’s add, delete and re-add took 48.8 to 60.0 ms at the median, in steps of 10 ms, almost all of it in the close() of its netlink socket, which waits for one RCU grace period after a commit that changed something; a commit that changes nothing took 1.7 ms.
The code, the probe and the kernel source
The code path, at 1.2.0. In dns+nft mode the sidecar’s DNS proxy writes every allowed answer’s addresses into nftables before it replies: forwardAndReply calls the resolved-IP callback and only then writeReply (proxy.go). The callback starts a new nft -f - process and waits for it to exit (manager.go), with a script that adds, deletes and re-adds each address with its timeout (dynamic.go); the add, delete and add came in with #1786 so a renewed address gets a fresh expiry. All of it runs under one mutex per sidecar (dynamic.go), whether or not the address is already in the set: there’s no cache, no check first, and no setting for it. As of November 7, 2026, I found no upstream issue or pull request about this, and main hadn’t changed this code since 1.2.0.
probes/nft_probe.py, run in a sandbox’s egress sidecar, pinned down where the time goes. On a throwaway nft table, a read-only nft list took 2.9 ms at the median, an nft -f - with nothing to do 1.5 ms and a commit that changes nothing 1.7 ms, but the sidecar’s own add, delete and re-add of one element took 48.8 ms with runs 50 ms apart and 60.0 ms back to back, almost always in steps of 10 ms. Under strace almost all of each renew sat in one close() (60 to 100 ms), which by the kernel code below is nft’s netlink socket (strace kept syscall names only), and an allowed lookup from the same sandbox took 70.0 ms against 0.2 ms for a denied name.
The kernel source explains the close. A commit with real changes hands its cleanup to a worker that starts with synchronize_rcu(). When nft exits and closes its netlink socket, nf_tables waits for that worker before the close returns, so the close waits for one RCU grace period; an empty commit or a read leaves nothing to wait for. On the node’s kernel, with CONFIG_HZ=100, grace periods end on 10 ms ticks, which is where the steps come from; that last part is inferred. Three changes would take the wait out of the reply path: one netlink connection kept open across updates, so no socket release follows each commit; several answers batched into one nft run; or no write when the address is already in the set with lease to spare.
Kernel source, mainline v6.18 (the node runs Amazon’s 6.18 build, whose own source I didn’t read): the commit’s deferred cleanup in nf_tables_api.c and its synchronize_rcu(); the release notifier in af_netlink.c, which flushes that work unconditionally since 9f6958ba2e90 (2024), after 2c9f0293280e (2023) added it.
Who pays it, and who doesn’t. The cost is per lookup, not per request: every lookup of an allowed name whose answer carries an address waits for one nft run, queued behind any other in the same sandbox, while a denied name, answered by the DNS proxy itself, took 0.2 ms. Anything that resolves before each connection pays it each time: curl in a loop, a command that resolves on every start, requests.get() without a Session, a fan-out of new connections. A client that keeps or pools connections (boto3, requests.Session, HTTP/2, gRPC) pays it once per connection it opens, not per request; one with a resolver cache pays it when the cache misses; one that connects to an address an IP or CIDR rule allows never pays it. The SigV4 rung, boto3 keeping its connection under dns+nft, took 6.8, 8.1 and 8.8 ms per call at the median per run, with no 60 ms term.
The only setting is server-wide. Egress mode dns, the server’s built-in default (the Helm chart ships dns+nft), skips nftables: lookups took 0.3 ms and 16 clients reached 4,342 requests per second (echo server the cap in 1 of 3; CPU unknown in 1 of 3). The price is the packet-level check and the credential proxy, for every sandbox on the server. With no nftables at all, a connection straight to an IP address, or to one resolved around the sidecar’s DNS proxy (over DNS-over-HTTPS, say), isn’t dropped; IP, CIDR and port-scoped rules aren’t enforced (part 4); and DNS-over-TLS blocking goes (DoH blocking too, where it’s enabled; this series doesn’t enable it). The server rejects credentialProxy.enabled with a 400 in dns mode and the sidecar’s vault refuses writes, so no sandbox can use the vault. Verified (code): nft.go, validators.py, vault.go; the vault guide says the same.
The proxy’s own cost, with the lookup taken out. Under load, mitm against dns+nft compares two copies of the same queue, so the ladder’s 16-client numbers say nothing about the proxy. Two measurements get around it. One at a time, a run’s mean request time minus its mean lookup is the connect, the GET and the close; medians of the runs: 1.14 ms with no sidecar, 1.50 ms in dns+nft, 4.84 ms through the proxy and 5.06 ms with the vault. So the transparent proxy adds about 3.3 ms to each new connection, and the vault’s header about 0.2 ms more.
Under load, 05_egress_ladder.py --resolve-once looks the echo host up once per run and sends every request to that address. It ran none, dns+nft, mitm and vault three times each, labelled /cached, with a 4-second request timeout against the main ladder’s 10, which only decides how slow a connection may be before it counts as failed.
The resolve-once run's closing table
$ uv run python 05_egress_ladder.py --resolve-once
...
== the ladder (medians over the runs)
  rung                1-at-a-time p50      p99    req/s  load p99  sidecar RSS             vs dns+nft
  none/cached                     0.4      2.4   5675.5       3.1         None   1.9% req/s, 0.0% p99 *
  dns+nft/cached                  0.4      2.4   5567.8       3.1          4.0                      - *
  mitm/cached                     3.3      5.5    384.9      68.0         64.9 -93.1% req/s, 2093.5% p99 ?
  vault/cached                    3.5      5.8    359.1      71.0         64.8 -93.6% req/s, 2190.3% p99 ?
  none/cached@8                   0.4      2.4   5793.4       2.9         None   0.9% req/s, 0.0% p99 ?
  dns+nft/cached@8                0.4      2.4   5744.3       2.9          3.8                      - *
  mitm/cached@8                   3.3      5.6    340.2      33.0         64.9 -94.1% req/s, 1037.9% p99
  vault/cached@8                  3.6      6.1    313.9      47.6         64.4 -94.5% req/s, 1541.4% p99
  * an echo replica (one Python process, limit 1000m) reached 800m: that rung's req/s is the echo server's ceiling, not the path's (per-replica numbers in results/ladder.json)
  c the load generator's CPU reached 1600m: the client, not the path, was the cap
  ? in a run of that rung the CPU over the load phase is unknown (counter readings under 10 s apart): whether the echo server or the client was the cap is not known, not ruled out
  published (dns+nft + transparent MITM vs dns+nft, short HTTPS requests to public sites): -47.6% req/s, +91.9% mean, +595.2% p99, ~5x RSS
  --resolve-once: one lookup per run, then every request to the cached address (no lookup in the times); request timeout 4 s (the main ladder: 10 s)
  none/cached        lookup 14.2 ms; one at a time mean 1.0 ms (main ladder, connect+GET+close: 1.14 ms); first failure per run (s after the lookup) [None, None, None] [None, None, None]; kinds -
  dns+nft/cached     lookup 58.5 ms; one at a time mean 1.0 ms (main ladder, connect+GET+close: 1.5 ms); first failure per run (s after the lookup) [None, None, None] [None, None, None]; kinds -
  mitm/cached        lookup 52.8 ms; one at a time mean 3.9 ms (main ladder, connect+GET+close: 4.84 ms); first failure per run (s after the lookup) [None, None, None] [None, None, None]; kinds -
  vault/cached       lookup 60.9 ms; one at a time mean 4.1 ms (main ladder, connect+GET+close: 5.06 ms); first failure per run (s after the lookup) [None, None, None] [None, None, None]; kinds -
  none/cached@8      lookup 14.1 ms; one at a time mean 1.0 ms (main ladder, connect+GET+close: 1.14 ms); first failure per run (s after the lookup) [None] [None]; kinds -
  dns+nft/cached@8   lookup 42.8 ms; one at a time mean 1.0 ms (main ladder, connect+GET+close: 1.5 ms); first failure per run (s after the lookup) [None] [None]; kinds -
  mitm/cached@8      lookup 76.4 ms; one at a time mean 3.9 ms (main ladder, connect+GET+close: 4.84 ms); first failure per run (s after the lookup) [None] [None]; kinds -
  vault/cached@8     lookup 32.3 ms; one at a time mean 4.2 ms (main ladder, connect+GET+close: 5.06 ms); first failure per run (s after the lookup) [None] [None]; kinds -
  * at 16 clients a cached rung was target-bound: its ratio there is a bound; the @8 rows are the pair again with 8 clients (one run each)
An 8-client pass agreed (340 against 5,744 requests per second, one run each). One at a time the variant agreed with the split above (about 2.9 ms for the proxy on its means), and its single lookups took 46.3 to 71.5 ms under dns+nft against 14.0 to 14.5 ms with no sidecar.
| Resolve-once variant, 16 clients | Requests per second | p50 / p99 | Sidecar peak RSS | Flags |
|---|---|---|---|---|
none/cached | 5,676 | 1.2 / 3.1 ms | No sidecar | echo server the cap in 3 of 3 |
dns+nft/cached | 5,568 | 1.2 / 3.1 ms | 4.0 MiB | echo server the cap in 3 of 3 |
mitm/cached | 385 | 40 / 68 ms | 64.9 MiB | proxy the cap in 3 of 3 (the client’s or an echo replica’s CPU unknown in 2) |
vault/cached | 359 | 43 / 71 ms | 64.8 MiB | proxy the cap in 3 of 3 (the client’s CPU unknown in 1) |
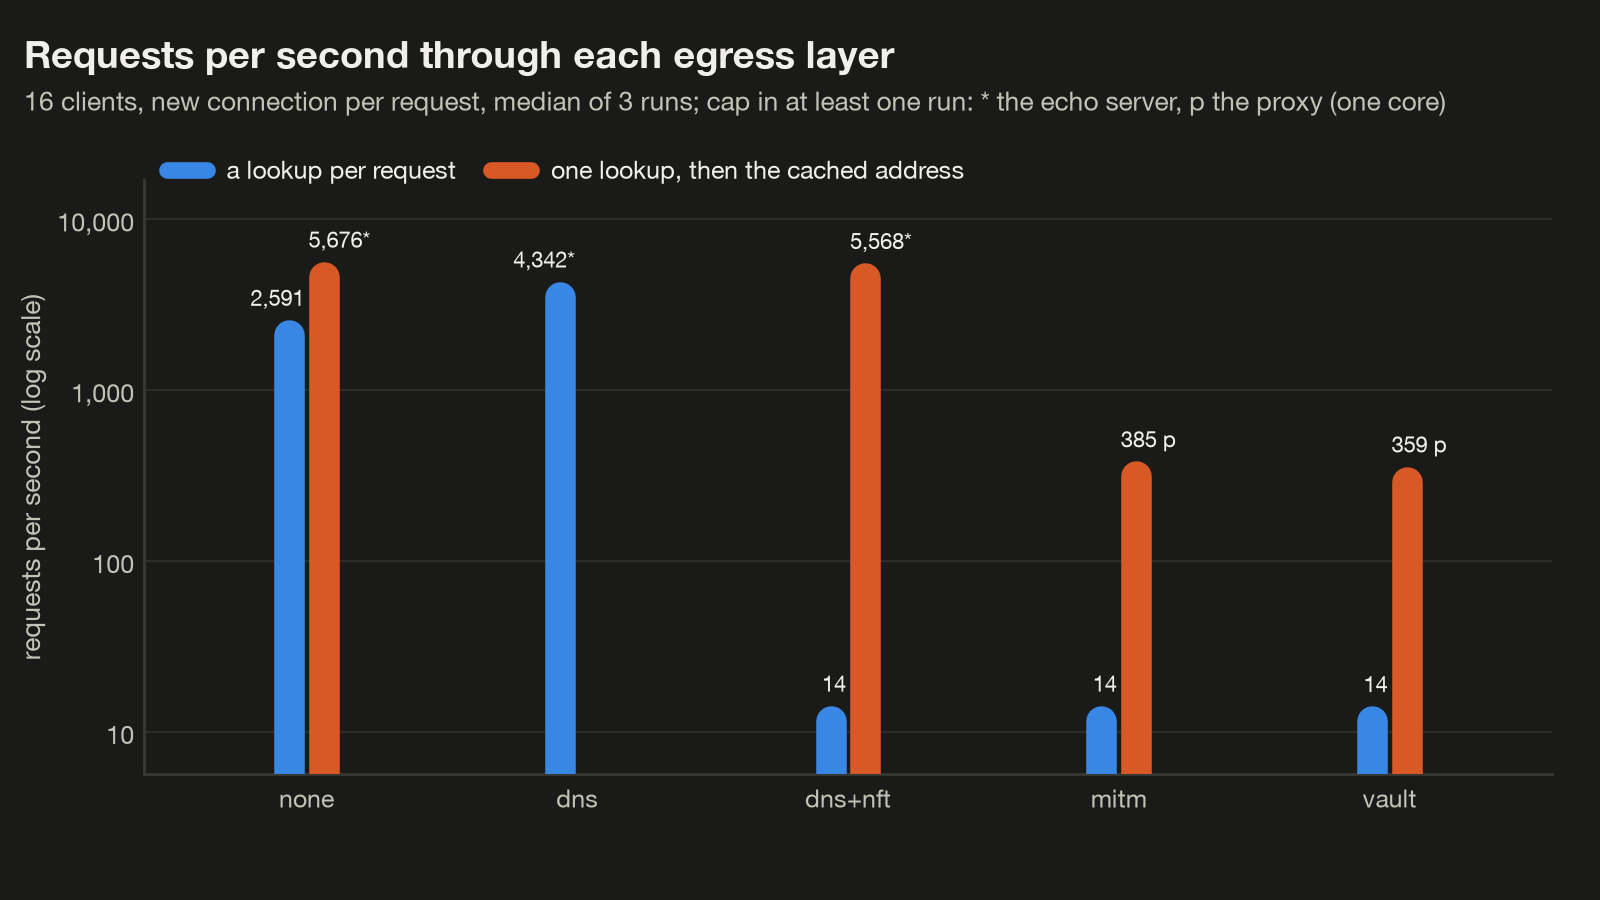
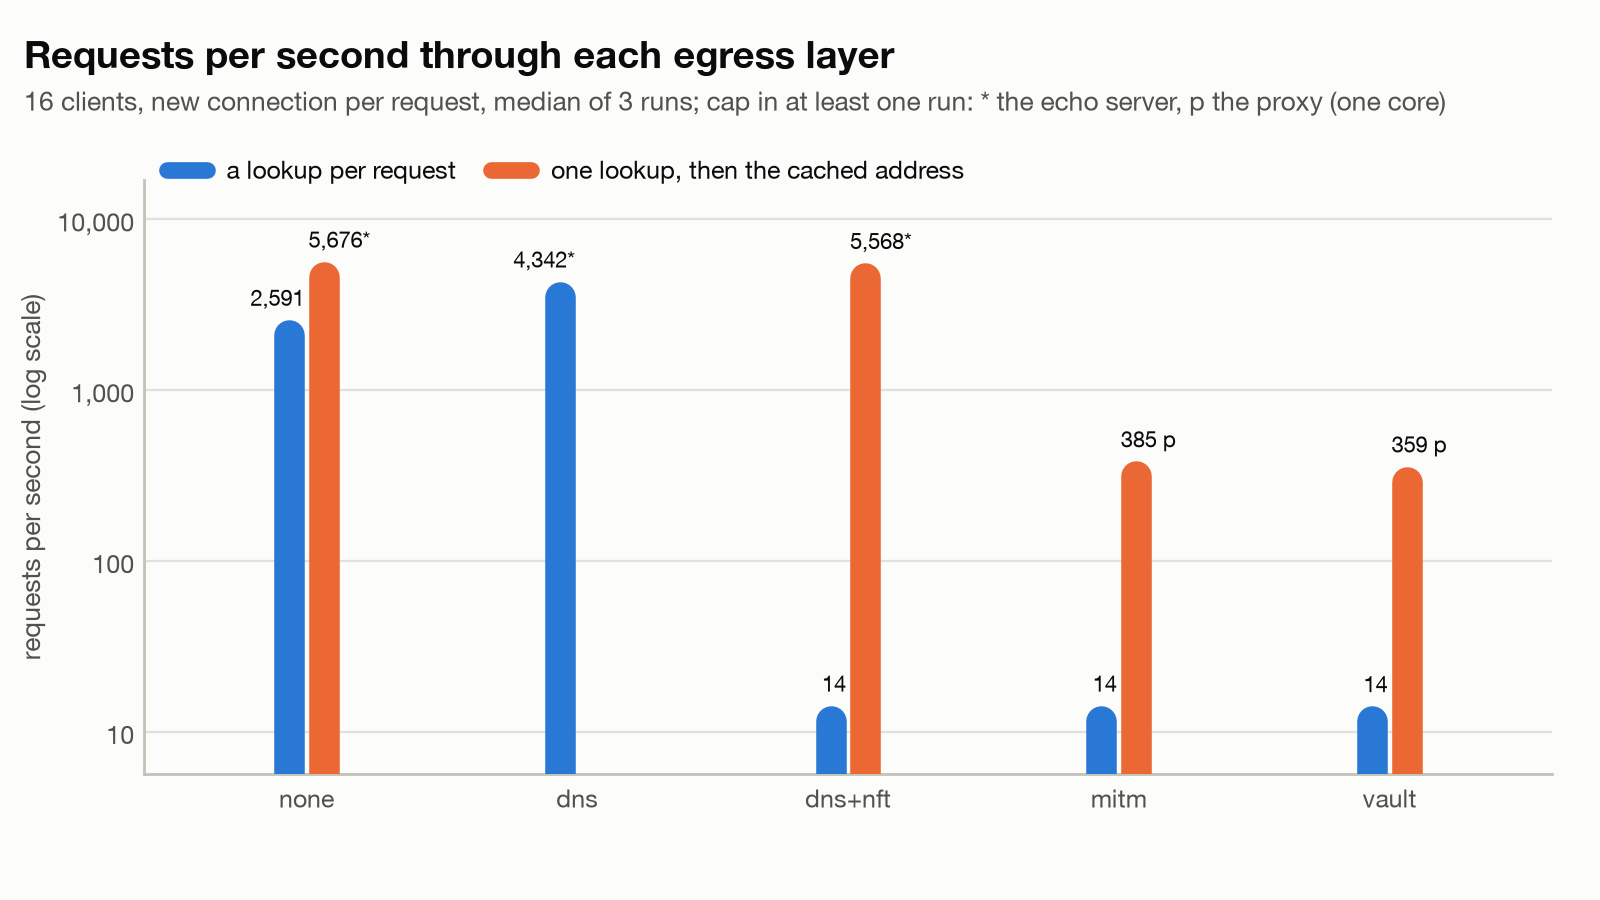
With the lookup gone, the transparent proxy is the cap. dns+nft/cached reached 5,568 requests per second, the echo server’s ceiling, not the path’s (target-bound in 3 of 3 runs), so nftables itself cost too little per connection to show. mitm/cached managed 385 (p99 68 ms) and vault/cached 359: -93% against dns+nft/cached, a lower bound on the drop, since the echo server capped that base. The proxy is one mitmdump process (launch.go) in a sidecar with no CPU limit, since the server leaves the resources out when they’re unset (egress_helper.py), and its Python runs on one core: under load the sidecar averaged 1,024 to 1,051m (one vault run: peak 1,031m), proxy-bound in every run, while the load generator used 57 to 64m and the echo replicas 51 to 59m. No request failed.
Against the published numbers. The benchmark notes compare dns+nft with and without the transparent proxy. Their short scenario sends HEAD requests over HTTPS to 40 public sites at once, 400 in all, and its authors call the tail timing-sensitive at that size; the memory figure is from a separate download scenario. Mine uses the variant under load and the lookup-free split one at a time:
mitm against dns+nft | Published: HTTPS, 40 public sites at once | Mine: HTTP in the cluster, resolve-once, 16 clients (each a lower bound: the echo server capped the base) | Mine: one at a time, lookup taken out |
|---|---|---|---|
| Requests per second | -47.6% | -93% or more | |
| Mean latency | +91.9% | +1,433% or more | +3.3 ms per connection (1.50 to 4.84 ms) |
| p50 | +5.2% | +3,267% or more | |
| p99 | +595.2% | +2,094% or more | |
| Sidecar memory, peak | About 5x, download scenario | +61 MiB (64.9 against 4.0 MiB) | +54 MiB in the main ladder under load (64.3 against 10.3 MiB) |
The main ladder’s 16-client comparison (0% requests per second) is lookup-bound on both sides, so it’s left out. Theirs is HTTPS to public sites, where the TLS handshake and the far end dominate each request; here the far end answers in 0.4 ms, so the proxy’s own work is most of every request and the drop is far larger; theirs also paid the nft run per lookup on both sides, which dilutes the difference (inferred).
The SigV4 rung, against the unsigned floor:
STS GetCallerIdentity, one at a time, boto3 keeping its connection | p50 | p95 |
|---|---|---|
aws-floor: unsigned, no sidecar, AWS answers 403 | 2.8 ms | 3.2 ms |
sigv4: placeholder keys, re-signed by the addon under dns+nft, AWS answers 200 | 8.1 ms | 9.4 ms |
The difference, 5.3 ms at the median, is the whole egress path (the proxy, the vault’s headers, the addon’s signature and AWS checking it), not the addon alone, with no lookup on a kept connection. No signed call failed.
Test 5: Control-plane load
The lifecycle server is one replica with part 2’s values: requests 250m CPU and 512Mi, limits 1 CPU and 2 GiB, SQLite on an EBS volume. The controller is one replica too. 06_control_plane.py measures them three ways, three times:
- Idle: 30 seconds with nothing happening, the floor.
- An API ramp: with 20 idle sandboxes in place, a Job next to the server runs 1, 4, 16 and 64 clients for 30 seconds each, every client on a keep-alive connection alternating a list (
GET /v1/sandboxes?pageSize=20) and a status poll of one sandbox. It calls the Service from inside the cluster, because from my Mac the port-forward would be what’s measured. - Create and delete waves: 10, 20 and 40 sandboxes created at once from my Mac, then deleted at once.
$ uv run python 06_control_plane.py
...
== control plane
  idle: server 5.0m / 107.5 MiB, controller 0.8m / 34.4 MiB
    1 API clients: 828.4 req/s (spread 221.5), p99 2.1 ms, server CPU 1017.4m on average over the level (peak 998.9m; limit 1000m)
    4 API clients: 821.3 req/s (spread 0.7), p99 8.9 ms, server CPU 1009.9m on average over the level (peak 999.6m; limit 1000m)
   16 API clients: 829.4 req/s (spread 3.6), p99 80.3 ms, server CPU 1011.1m on average over the level (peak 997.6m; limit 1000m)
   64 API clients: 775.5 req/s (spread 10.0), p99 166.6 ms, server CPU 1011.2m on average over the level (peak 996.7m; limit 1000m)
  wave of 10: create p50 3287.9 ms; controller CPU peak 14.5m; server CPU peak 35.4m
  wave of 20: create p50 5036.3 ms; controller CPU peak 5.0m; server CPU peak 27.4m
wave of 40: create p50 6960.1 ms; controller CPU peak 32.7m; server CPU peak 58.0m| API clients | Requests per second, median of 3 | p99 | Server CPU, average over the level | Failed calls |
|---|---|---|---|---|
| 1 | 828 | 2.1 ms | 1,017m | 0 |
| 4 | 821 | 8.9 ms | 1,010m | 0 |
| 16 | 829 | 80 ms | 1,011m | 0 |
| 64 | 776 | 167 ms | 1,011m | 0 |
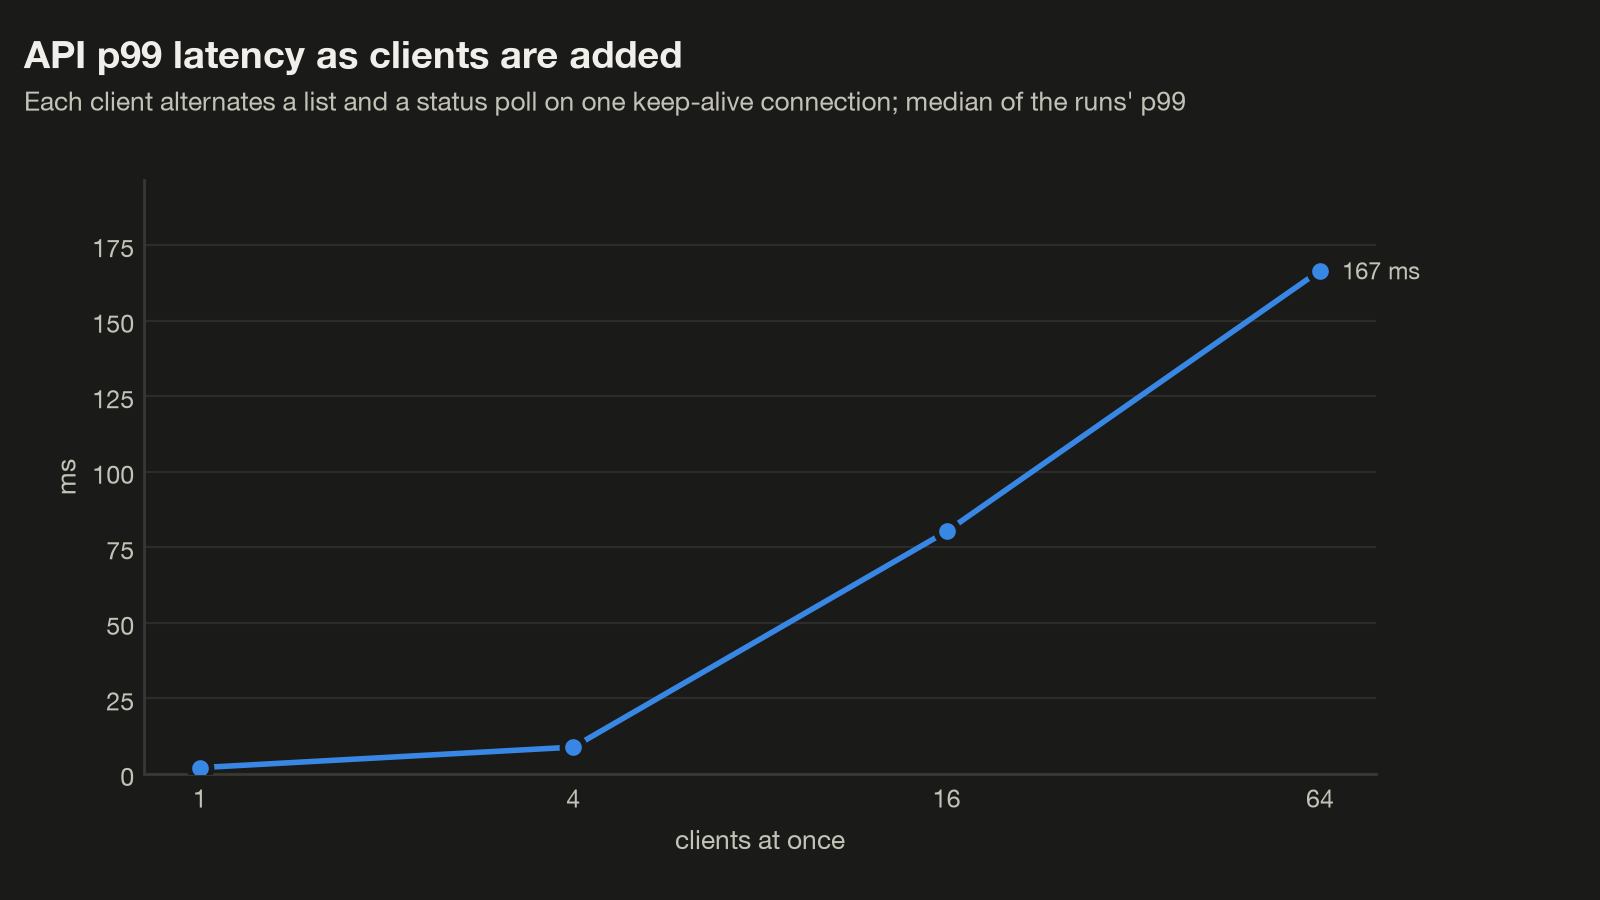
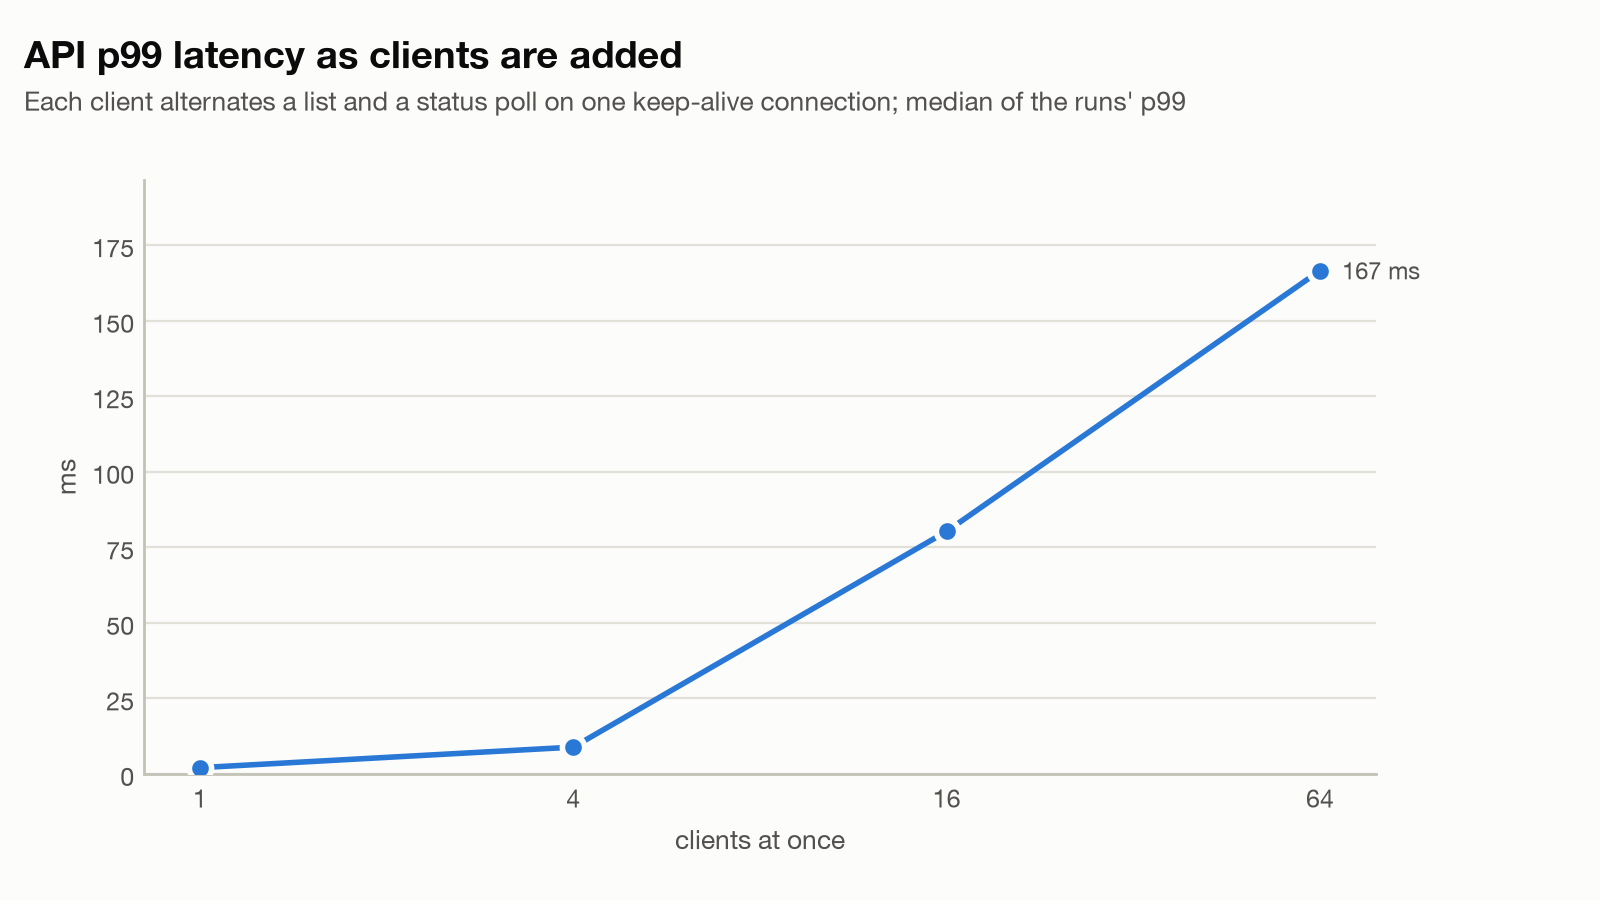
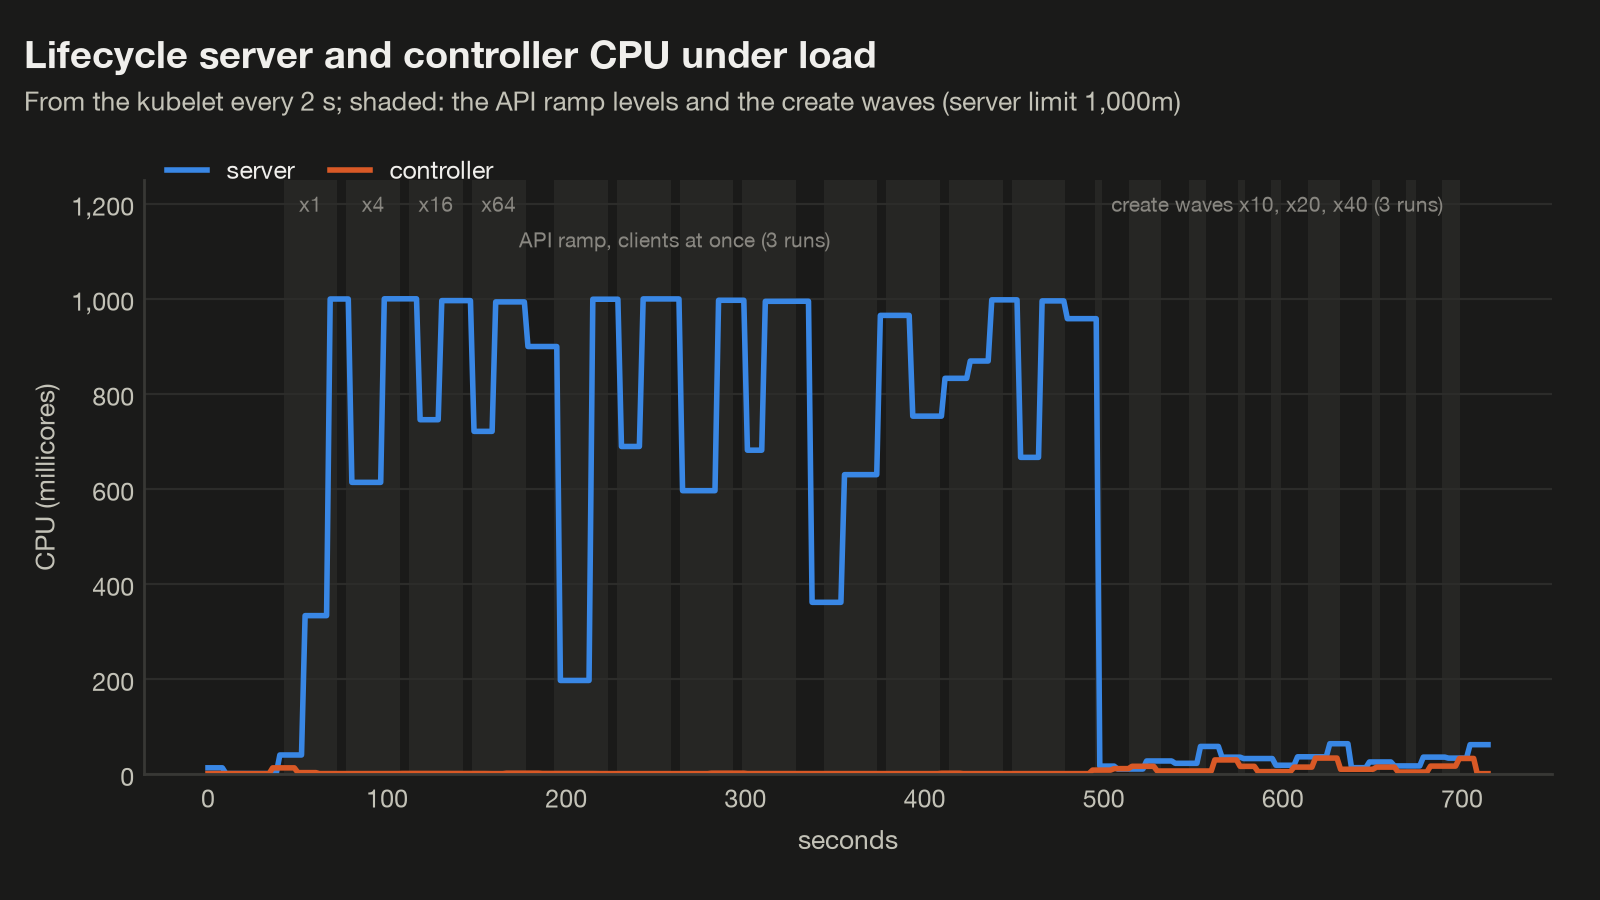
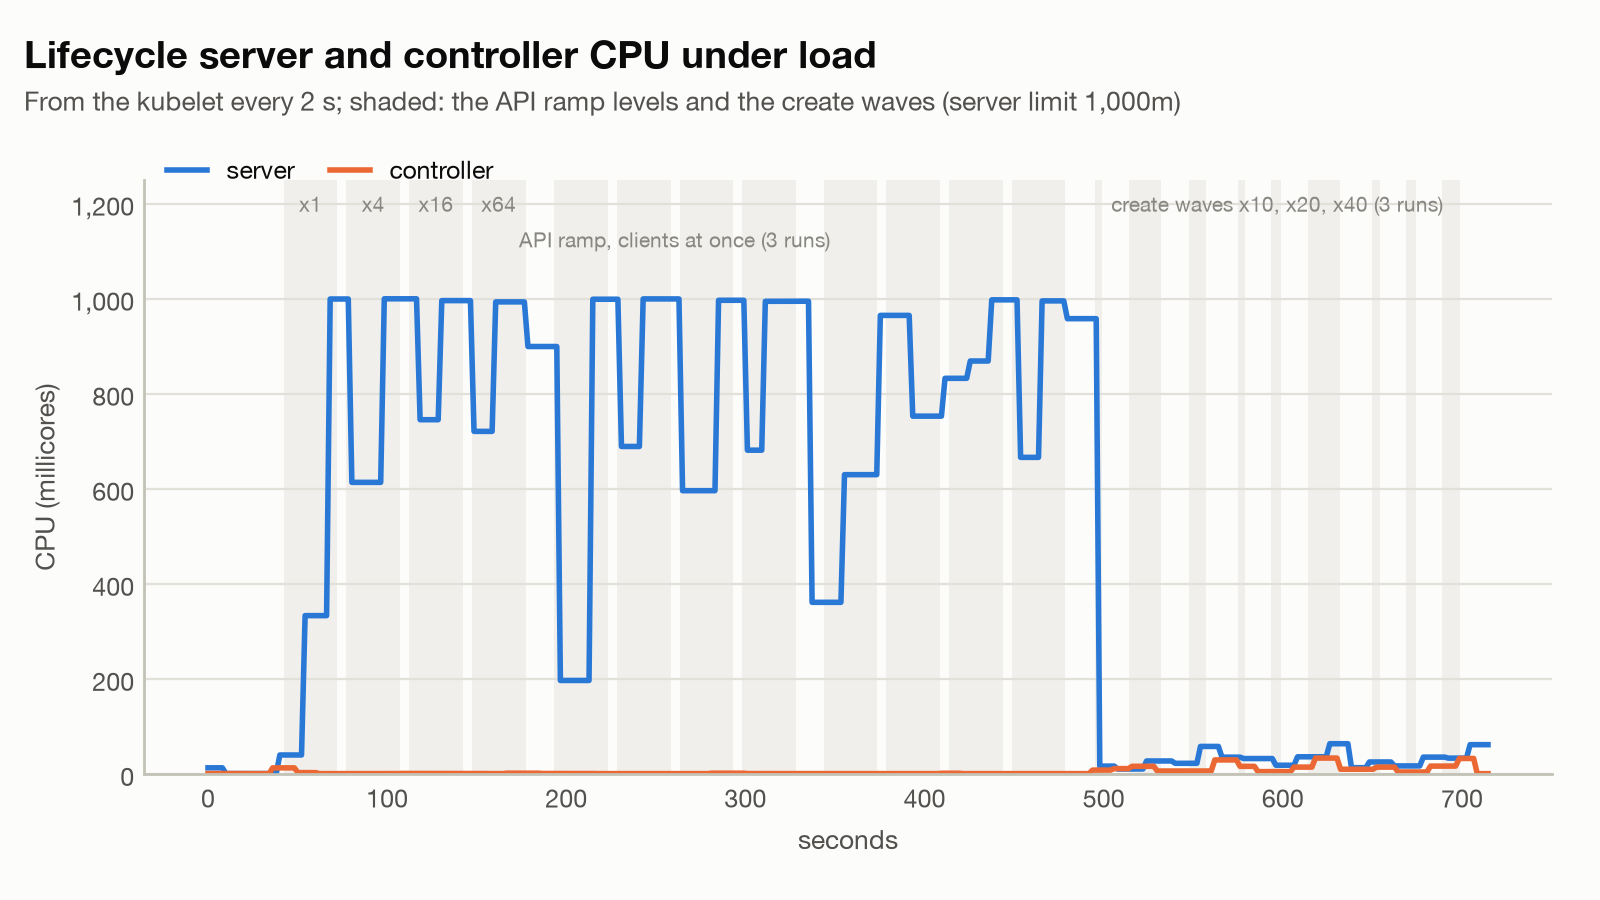
Idle, the server used 5m and 107.5 MiB, the controller 1m and 34.4 MiB. The server’s one CPU was full from the first client: it averaged 1,010 to 1,017m at every level, a full core (the 1 to 2% over the limit is the counter’s timing; inferred), and answered 821 to 829 requests per second whether 1, 4 or 16 clients asked, and 776 with 64; what grew was the wait, a p99 from 2.1 ms with one client to 167 ms with 64. That’s one replica with part 2’s 1 CPU limit, and a replica is also one process: 1.2.0 starts uvicorn with no workers (cli.py), so its Python runs on about one core whatever the limit. Both caps sit at one core here, so this run can’t say which bound it; a bigger limit alone likely wouldn’t help (inferred), and I didn’t test more replicas. No call failed.
| Wave, created at once from my Mac | Create p50 | Controller CPU, median of the runs’ peaks | Server CPU, median of the runs’ peaks |
|---|---|---|---|
| 10 | 3,288 ms | 14m | 35m |
| 20 | 5,036 ms | 5m | 27m |
| 40 | 6,960 ms | 33m | 58m |
The waves go through the port-forward and are there for the CPU; a peak of the kubelet’s rate is a sample, not an average. Neither was busy: in the waves of 40 the server’s CPU peaked at 36 to 64m and the controller’s at 6 to 34m over the three runs, as sampled.
Test 6: Noisy neighbors
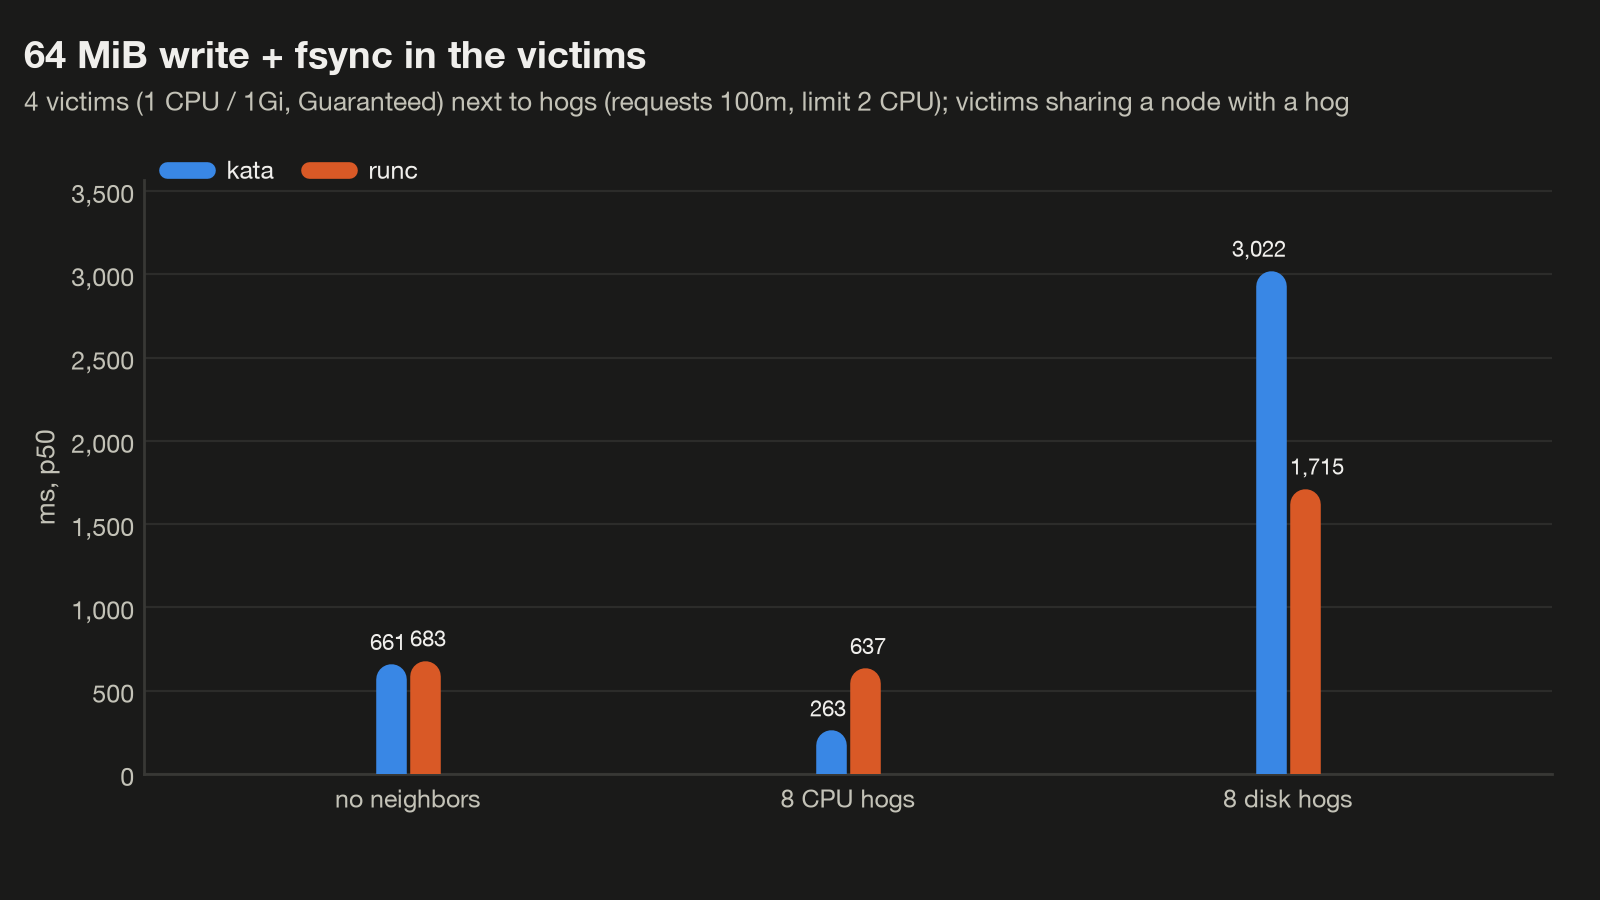
07_noisy.py puts four victims next to hogs, under runc and then Kata. A victim is 1 CPU and 1 GiB, Guaranteed QoS, and runs five iterations of a fixed CPU job (300 rounds of sha256 over a 1 MiB buffer), a 64 MiB write with fsync, and 100 small appends with an fsync each, in three scenarios:
- Baseline: nothing else running.
- CPU hogs: eight sandboxes each spinning two processes, with requests of 100m and a limit of 2 CPUs. The scheduler packs them, and together they want all 16 vCPUs.
- Disk hogs: eight sandboxes writing 64 MiB files with fsync, round and round, to the node’s root EBS volume, which holds every runc container’s writable layer and Kata’s shared root filesystem.
Each hog is checked before and after from /proc in its own sandbox; a scenario with a hog not running is invalid, and only victims sharing a node with a hog count.
The numbers are from a re-run after the main run, with 18 of 18 scenarios valid. In the first run my harness invalidated the Kata cases, and one runc case, itself: its hog check read the kubelet’s CPU number, which is 0 for a Kata pod and for a new runc pod before its first reading, and a default 120-second command timeout ended the Kata disk hogs early. Both are fixed in the companion.
$ uv run python 07_noisy.py
...
== victims, p50 (and slowdown against baseline)
  kata  baseline cpu 200.6 ms (-x)   64 MiB+fsync 661.3 ms (-x)   fsync p99 2.1 ms   [12 exposed victim(s)]
  kata  cpu      cpu 253.8 ms (1.27x)   64 MiB+fsync 262.9 ms (0.4x)   fsync p99 32.2 ms   [12 exposed victim(s)]
  kata  disk     cpu 200.9 ms (1.0x)   64 MiB+fsync 3022.3 ms (4.57x)   fsync p99 192.4 ms   [12 exposed victim(s)]
  runc  baseline cpu 198.5 ms (-x)   64 MiB+fsync 682.7 ms (-x)   fsync p99 2.3 ms   [12 exposed victim(s)]
  runc  cpu      cpu 203.0 ms (1.02x)   64 MiB+fsync 636.8 ms (0.93x)   fsync p99 10.0 ms   [12 exposed victim(s)]
runc disk cpu 198.5 ms (1.0x) 64 MiB+fsync 1714.7 ms (2.51x) fsync p99 186.3 ms [12 exposed victim(s)]| Runtime | Scenario | CPU job, p50 | 64 MiB write and fsync, p50 | Small fsync, p99 | Exposed victims |
|---|---|---|---|---|---|
| runc | Baseline | 198 ms | 683 ms | 2.3 ms | 12 |
| runc | 8 CPU hogs | 203 ms (1.02x) | 637 ms (0.93x) | 10 ms | 12 |
| runc | 8 disk hogs | 198 ms (1.00x) | 1,715 ms (2.51x) | 186 ms | 12 |
| Kata | Baseline | 201 ms | 661 ms | 2.1 ms | 12 |
| Kata | 8 CPU hogs | 254 ms (1.27x) | 263 ms (0.40x) | 32 ms | 12 |
| Kata | 8 disk hogs | 201 ms (1.00x) | 3,022 ms (4.57x) | 192 ms | 12 |
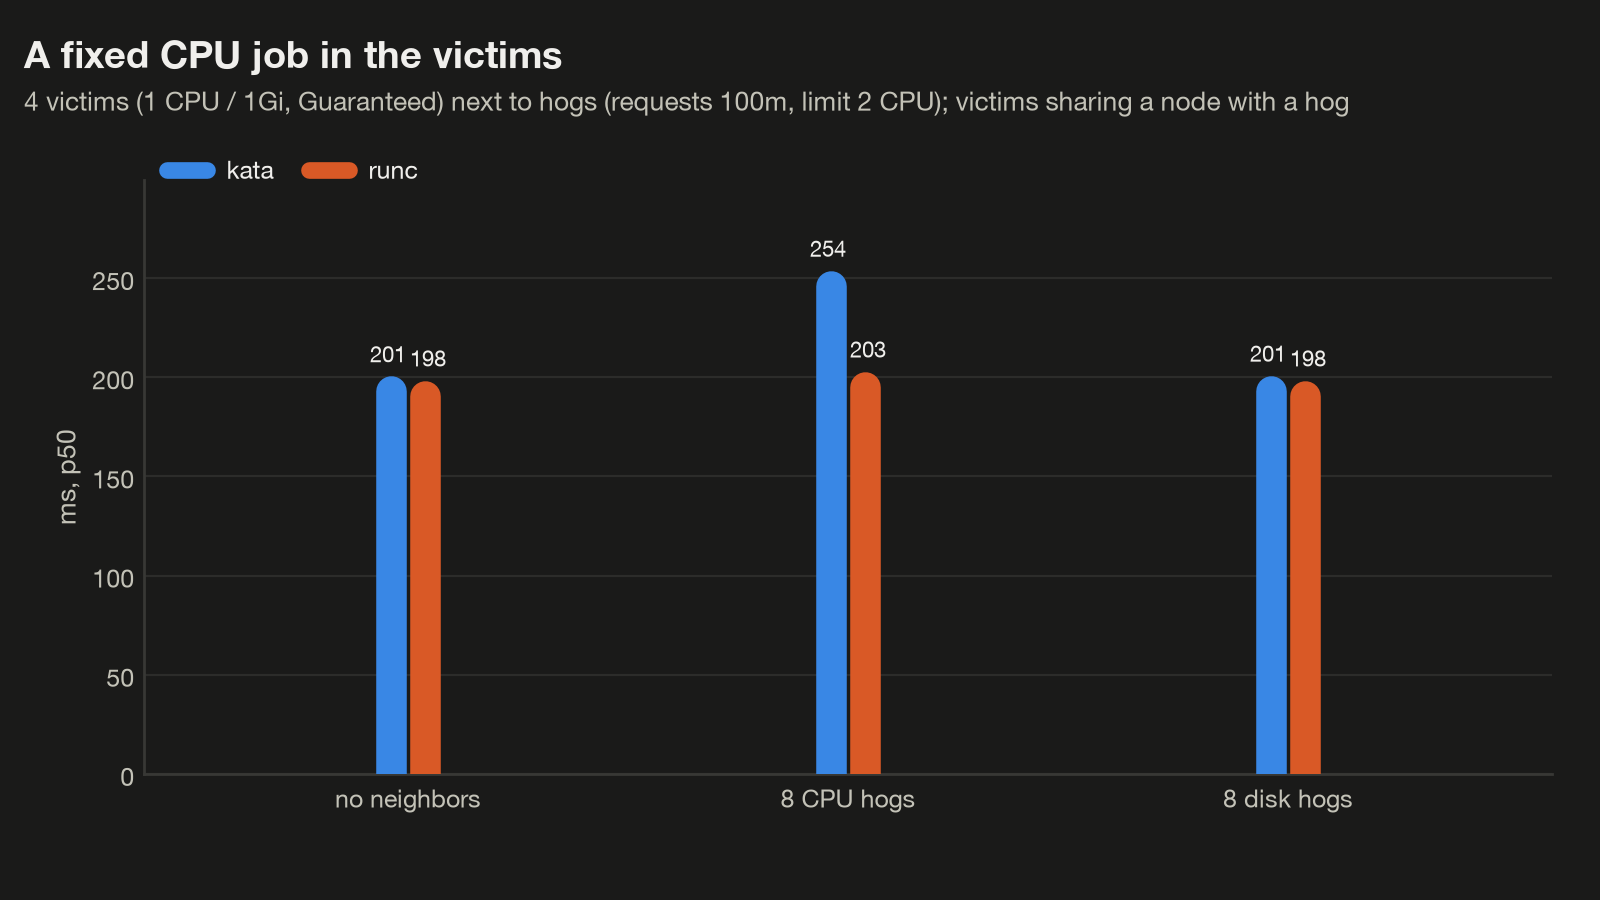
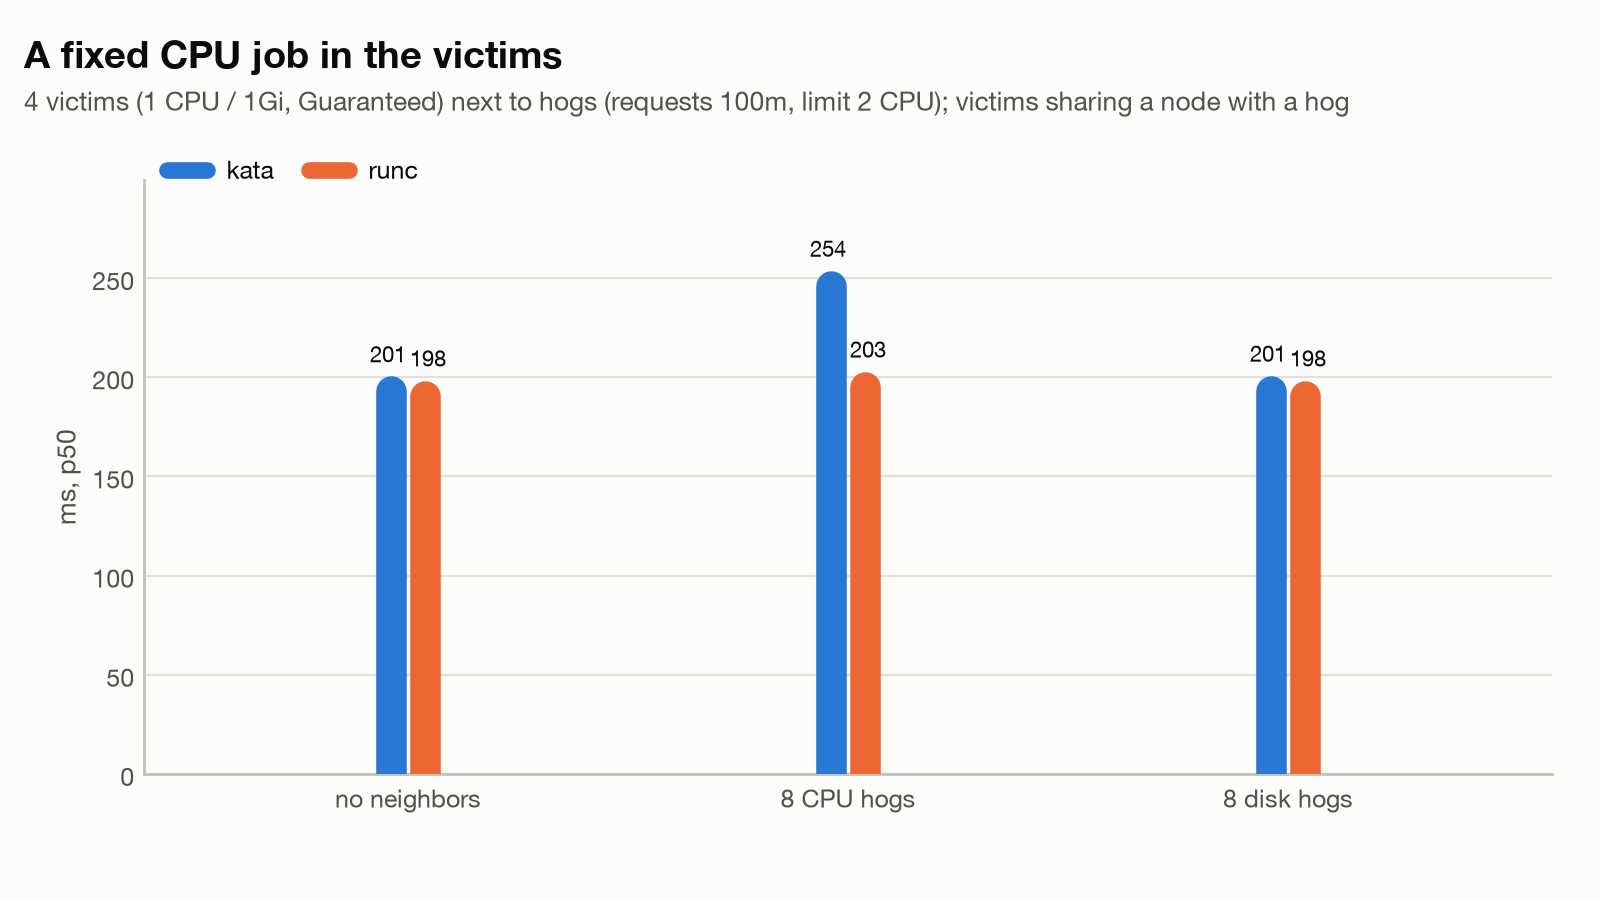
CPU requests protected the victims under runc, and less under Kata. Under runc the eight CPU hogs slowed the victims’ CPU job by 1.02x at the median: the kernel shares a contended CPU by the pods’ requests, and a victim’s full CPU outweighs a hog’s 100m. Under Kata it was 1.27x. Each Kata hog used about 1,960m inside its VM (a runc hog: about 1,122m) while the kubelet read 0m for its pod. Kata’s docs keep the vCPU threads in the pod’s cgroup with sandbox_cgroup_only = false (host-cgroups.md), so that 0 is likely how the kubelet reads a Kata pod, not where its CPU is charged (inferred). I didn’t trace why the hogs cost the victims more under Kata.
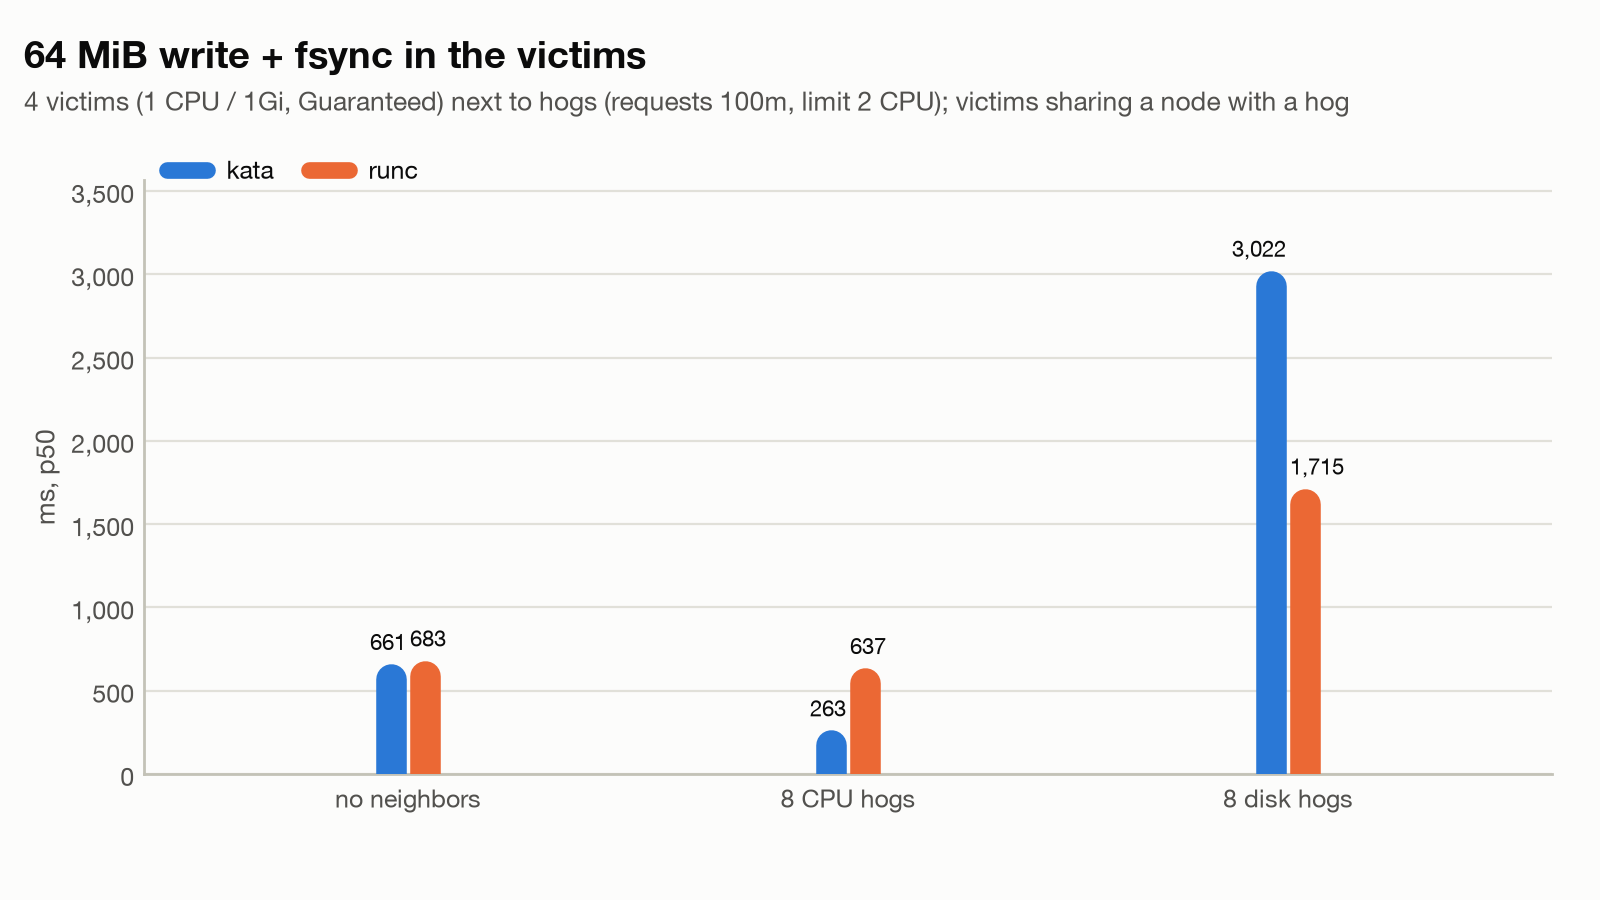
Disk isn’t isolated under either runtime. Eight disk hogs made the victims’ 64 MiB write and fsync 2.51x slower under runc and 4.57x under Kata, and a small fsync’s p99 went from 2.3 to 186 ms under runc and from 2.1 to 192 ms under Kata.
One result I can’t explain: under the CPU hogs, the Kata victims’ 64 MiB write was faster than with no neighbors, 0.40x the baseline time, in all three runs. Under runc the pooled median was 0.93x, within the runs’ spread. That’s what the runs recorded; I didn’t look further.
What CloudWatch saw
08_cloudwatch.py pulls the main run’s one-minute points, read-only, with nodes as node-a and node-b and no instance, gateway or account ID: node CPU, memory and network, the control-plane pods, the sandbox namespace’s running pods, and the NAT gateway’s bytes. The window ends before the Test 6 re-run.
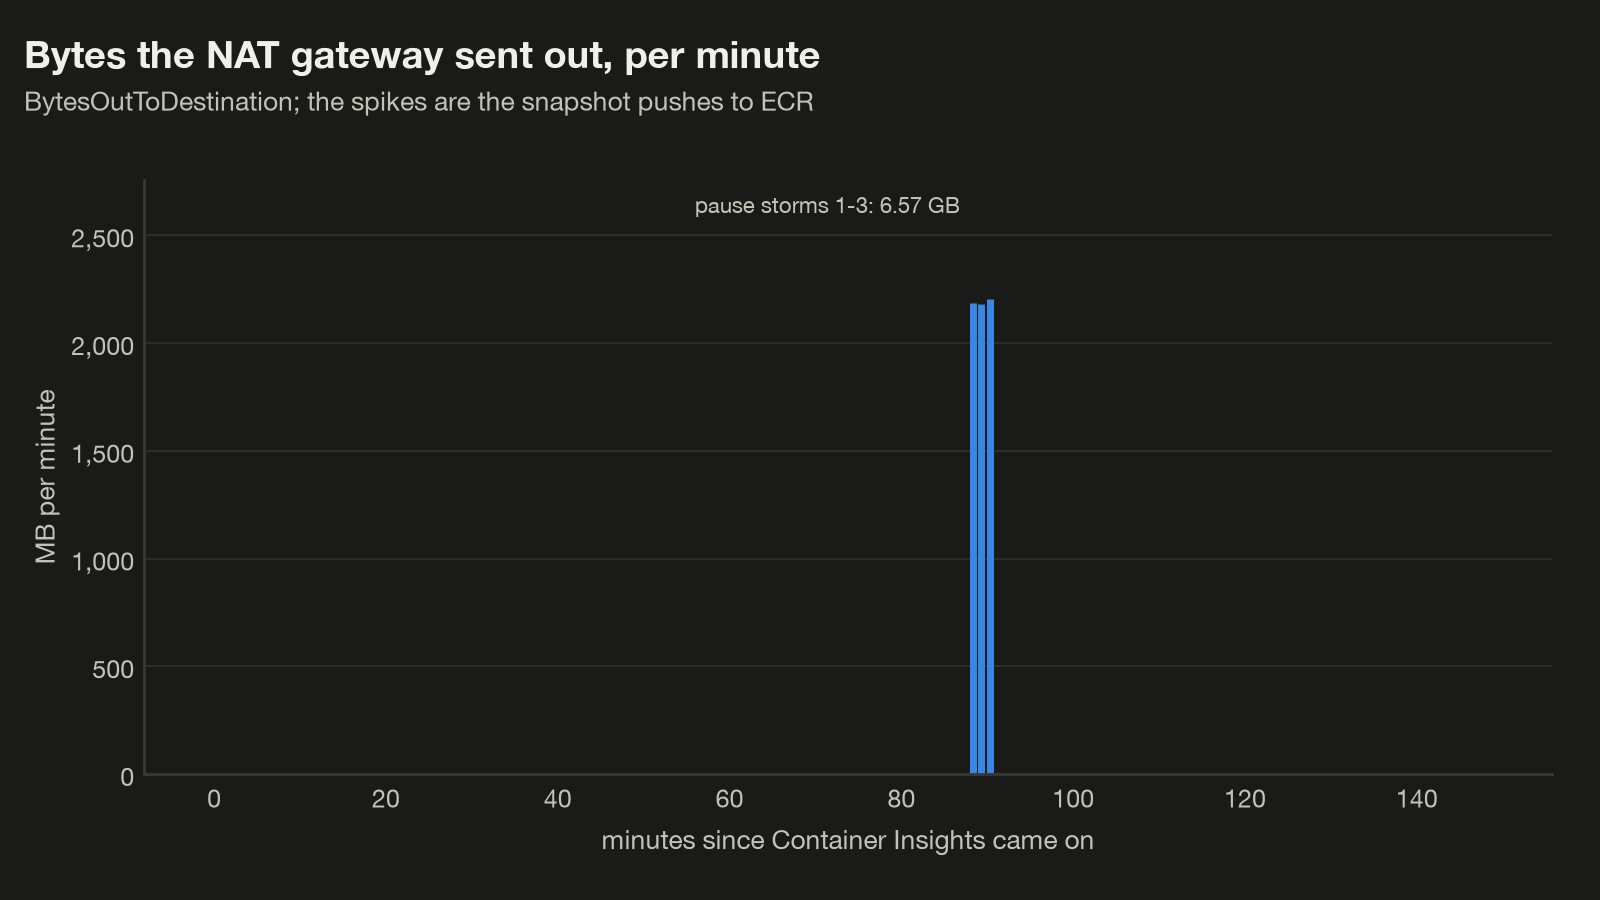
The NAT gateway sent 6.57 GB out during the three pause storms, about 2.19 GB each, in the minute after each pause window: 4.5% more than the 6.29 GB of random data written, and less than ECR’s 8.89 GB of image sizes, which count base layers the push skips. The resumes moved next to nothing through the NAT gateway (0.4 MB in the storms’ window outside those three points): either their pulls came through the S3 endpoint or the node still had the image, and this run doesn’t say which.
Node CPU through the run
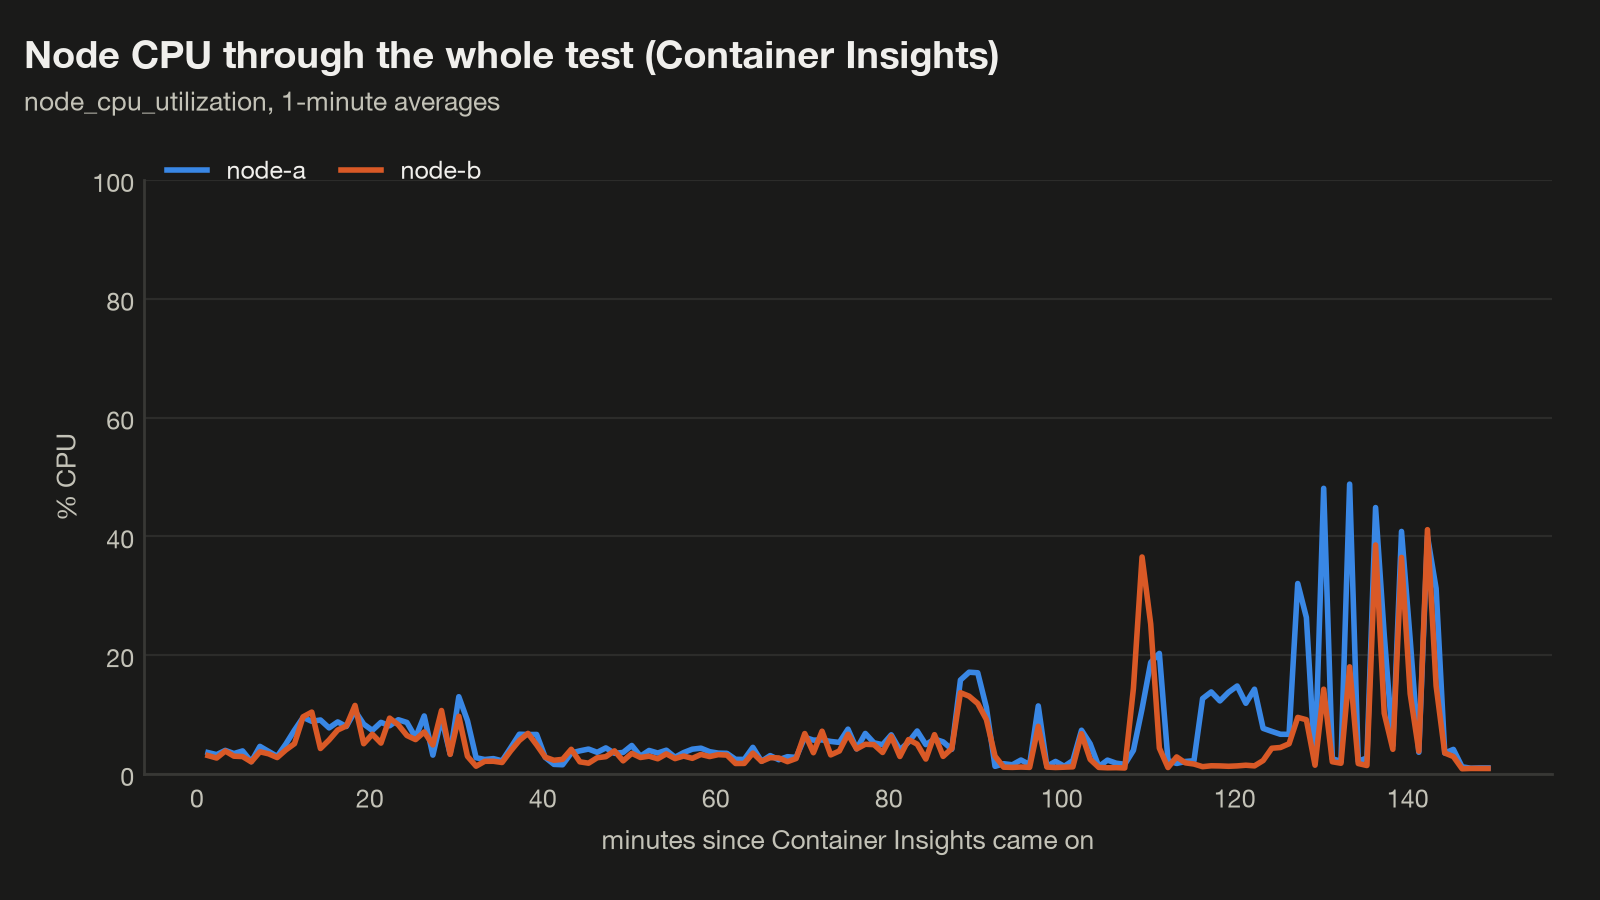
Over 151 minutes, node CPU averaged 7.6% on node-a and 5.4% on node-b, with one-minute peaks of 49% and 41%. Both peaks fall in the first Test 6 run, when the CPU hogs ran. The sandbox namespace peaked at 90 running pods.
CloudWatch adds the whole run on one axis, kept after the cluster is gone; each test’s own numbers come from the kubelet sampler.
Results summary
| Test | Script | Recorded run | Result |
|---|---|---|---|
| 1. Density | 02_density.py | 32m 09s | runc 89 and runc with egress 89 on pod slots, the sidecar about 60 MiB per sandbox and unreserved; Kata 24 on CPU (Kubernetes 1.37 counting the overhead twice), about 324 MiB per sandbox on the nodes against 288 reserved and 0 reported by the kubelet |
| 2. Create latency | 03_latency.py | 54m 53s | Cold p50 1,712 ms at 1 in flight, 5,297 ms at 40; warm 130 and 1,284 ms, in-cluster; delivery of 84 in 474 ms through the controller |
| 3. Pause storm | 04_pause_storm.py | 3m 20s | 20 snapshots of 100 MiB durable after 21.4 s; resume p50 7,301 ms to healthy; data intact in 60 of 60 |
| 4. Egress ladder | 05_egress_ladder.py, then --resolve-once | 24m 10s; 15m 39s | dns+nft lookup 59 ms p50, every dns+nft rung 14.2 to 14.3 requests per second at 16 clients; the proxy +3.3 ms per connection one at a time, at least 93% fewer requests per second resolve-once (the base was echo-bound); SigV4 5.3 ms over the unsigned floor |
| 5. Control plane | 06_control_plane.py | 12m 10s | One server replica, one process, CPU-bound from the first client: 821 to 829 requests per second up to 16 clients, p99 167 ms at 64; no call failed |
| 6. Noisy neighbors | 07_noisy.py, re-run | 20m 00s | CPU hogs 1.02x (runc) and 1.27x (Kata) on the victims’ CPU job; disk hogs 2.51x and 4.57x on their write and fsync |
| CloudWatch | 08_cloudwatch.py | 0m 02s | Node CPU one-minute peaks 49% and 41%; 6.57 GB out through the NAT gateway for the pause storms, 4.5% over the data written |
Every script exited 0 except the first Test 6 run, whose Kata cases and one runc case my harness invalidated (see Test 6); its re-run and the resolve-once variant, after the main run, exited 0. 02 to 07 took 2.4 hours of the main run.
Pricing
OpenSandbox is free; the cluster bills by the hour, about $1.011 idle (part 2’s Pricing). Part 6 adds Container Insights, the NAT gateway’s per-GB charge and ECR storage for the snapshots. I price the whole 2.5 hours Container Insights was on, from 01_metrics.sh to 99_cleanup.py; the Test 6 re-run and the resolve-once variant came later, with it off.
Container Insights with enhanced observability bills per observation, $0.21 per million for the first billion in a month (CloudWatch pricing). By AWS’s per-minute averages, this cluster at rest makes about 6,100 to 7,100 observations a minute, $0.08 to $0.09 an hour before log storage, and each sandbox pod adds 159 to 180 a minute; this run never had more than 89 at once, which for all 2.5 hours would have added $0.50. 99_cleanup.py deletes the performance log group, billed separately.
The observation arithmetic
AWS’s per-minute averages are 1,720 per cluster, 68 per node, 2 per namespace or service, 7 per workload, 138 per pod and 21 per container; they put AWS’s own 10-node example at $51.75 a month. The 2 nodes and the 27 pods Test 1 recorded outside the sandboxes, at one container each, come to at least 6,149 a minute, $0.08 an hour. Namespaces, services, workloads, second containers and the three more pods my count has add about 900 more; with my count of them, which no log records, it’s about 7,050 a minute, $0.09 an hour or $64 a month before log storage, and the table uses that upper figure. A sandbox pod is 138 plus 21 per container, 159 without the egress sidecar and 180 with it, so 200 two-container sandboxes for 2 hours would add about 4.32 million observations, $0.91.
The NAT gateway charges $0.045 per GB it processes, whatever the direction (VPC pricing), on top of its hourly rate. It carried 6.64 GB over the window 08_cloudwatch.py read, about $0.30, 6.57 GB of it for the pause storms’ pushes.
| Item | Rate | This run, 2.5 hours |
|---|---|---|
| The cluster, idle (part 2) | $1.011/h | $2.53 |
| Container Insights, the cluster at rest | $0.08 to $0.09/h at $0.21 per million observations | Up to $0.22 |
| Container Insights, the sandboxes | 159 to 180 observations a minute per sandbox pod | Under $0.50 |
| NAT gateway data processing | $0.045/GB | $0.30 |
| ECR storage for the snapshots | $0.10/GB-month | Under a cent, until 99_cleanup.py deletes them |
| STS calls (Test 4), CloudTrail event history | No charge | $0 |
| Total | About $3.55 |
The instances are most of the bill. Left on, Container Insights costs about $1.86 to $2.13 a day on this cluster before a sandbox runs, by the arithmetic above; 99_cleanup.py turns it off.
Cleanup
Every script deletes what it made, also on failure. After an interrupted run, or when you’re done:
uv run python 99_cleanup.py                  # also turns Container Insights off
uv run python 99_cleanup.py --keep-metrics   # leaves it on
It runs every step whatever the others did and exits 1 if any failed. It deletes only this directory’s objects, the sandboxes labelled example=opensandbox-stress and their snapshot images among them, restores the server if a killed script left it changed, turns Container Insights off and deletes its log group /aws/containerinsights/osb-eks/performance, and scans results/ and charts/ before they’re published. It keeps what parts 3 to 5 set up.
This is the last part of the series, so this is where the cluster goes. Scale the nodes to zero between sessions from part 2’s directory, and when you’re done with all six parts, its teardown removes everything, in the order part 2’s Cleanup explains:
../opensandbox-eks/08_scale.sh down
../opensandbox-eks/99_teardown.sh
Verdict
On two ordinary m7i.2xlarge nodes, OpenSandbox 1.2.0’s Kubernetes path ran every test to the cluster’s limits without losing data or failing a request below them (at the limits, creates timed out instead of being refused; Test 1), and the first limits weren’t OpenSandbox’s: pod slots for runc, and for Kata a Kubernetes 1.37 scheduler bug that counts a RuntimeClass overhead twice. Plan around the memory nothing accounts for: the egress sidecar’s, unreserved, and a Kata VM’s, invisible to the kubelet. Neither bit here only because something else ran out first.
The egress surprise is the lookup: under dns+nft, a sandbox that opens connections by name waits on one nft run per lookup, and the proxy behind it is a single core nothing reserves; the only switch, server-wide dns mode, also turns off the credential proxy and the vault. Where the client runs matters most for creates: a warm one from inside the cluster took about a tenth of the time through a port-forward. The lifecycle server, one replica and one process, was CPU-bound from its first client. CPU requests kept neighbors apart under runc and less under Kata, and disk wasn’t isolated under either.
Firecracker was not tested: neither the Fast Sandbox profile, which this series never installed, nor Kata with Firecracker, which part 2 didn’t install.
What you sign up for
| Concern | OpenSandbox 1.2.0 on two m7i.2xlarge nodes, as tested; what comes from code or docs is marked |
|---|---|
| Density, runc | 89 idle sandboxes, on the VPC CNI’s 58 pods per node; memory far from full |
| The egress sidecar | About 60 MiB per idle sandbox on the nodes, 58.9 MiB of it the sidecar’s resident memory; no requests unless you set [egress] requests (code) |
| Density, Kata | 24 idle sandboxes, refused on CPU: Kubernetes 1.37 counts a running pod’s RuntimeClass overhead twice, about 600m against 350m declared (#143257; its fix unmerged as of November 7, 2026; Kubernetes source); about 324 MiB per sandbox on the nodes, 288 reserved, 0 reported by the kubelet for the pod |
| A full cluster | Creates time out with SandboxTimeoutException; the reason is only in the scheduler’s events, and the server removes the sandbox (code) |
| Create latency, in-cluster client | Cold 1,712 ms p50 one at a time, 5,297 ms at 40; from a Pool 130 and 1,284 ms |
| Create latency, through a port-forward | Cold 2,277 ms, warm 1,245 ms, one at a time |
| Pool delivery | 84 sandboxes allocated in 474 ms through the controller, my Mac’s API round trip included; through the server, my in-cluster client was the limit; the published 0.92 s for 100 states no setup (docs) |
| Pause storm | 20 snapshots of 100 MiB durable in ECR after 21.4 s; about 2.19 GB per storm through the NAT gateway |
Egress, dns+nft (the Helm chart’s default and the series’ setting) | Every lookup of an allowed name waits about 59 ms for an nft process, serialized per sandbox (code and run); a pooled client pays it once per connection; new connections by name top out near 14.3 a second; no setting but the server-wide dns mode, which drops the packet checks and the credential proxy (code) |
| Egress, the proxy | +3.3 ms per new connection one at a time; about 385 new connections a second per sandbox with the lookup taken out, one mitmdump with no CPU limit at about one core; the proxy adds about 54 MiB to the sidecar’s peak (64.3 against 10.3 MiB); a SigV4-signed call 5.3 ms over an unsigned one |
| Control plane | One server replica, one process (code), CPU-bound from the first client: 821 to 829 requests per second up to 16 clients, p99 from 2.1 to 167 ms at 64 |
| Noisy neighbors | CPU hogs 1.02x under runc, 1.27x under Kata; disk hogs 2.51x and 4.57x, a small fsync’s p99 186 and 192 ms; disk isn’t isolated by either |
| Observability | Container Insights’ one-minute points for the run; the fine-grained numbers need your own kubelet sampler; Kata VMs’ memory needs a node-side one |
| Cost of this run | About $3.55, most of it the instances; Container Insights $0.08 to $0.09/h for the cluster at rest |
Who should use it
It fits a team running agent sandboxes on its own EKS nodes and sizing from its own measurements. Count pod slots first; set [egress] requests so the scheduler sees the sidecar, whose proxy can take a core nobody reserved; keep connections open or cache resolution in sandboxes that call out often under dns+nft; watch Kata memory from the node and, until Kubernetes fixes #143257, budget about 600m of scheduler CPU per Kata sandbox; and create sandboxes from next to the server, with a Pool when create time matters.
It doesn’t fit, yet, a sandbox that opens many new connections by name under dns+nft, write-heavy tenants sharing a node, or a plan sized from the published numbers: 0.92 seconds with no setup, AWS China figures from a controller-only install, and Firecracker numbers from a profile this path doesn’t run. That’s the end of the series: part 1 starts again from what OpenSandbox is and how the pieces fit.