Cloud Run Sandboxes: Hands-On with the Boundary, Secrets, 1,000 Sandboxes and Noisy Neighbors
By Fabio Douek
Human-led, AI-assisted. Research and implementation done with AI tools, led, tested and edited by me. How posts are labeled
Jump to section
- Overview
- Setup
- Step 1: The host image
- Step 2: Deploy a private service
- Step 3: Get a shell on the instance
- Testing
- Test 1: Turning it on
- Test 2: What is the boundary?
- Test 3: What can a sandbox see?
- Test 4: Network
- Test 5: Filesystem and state
- Test 6: What reaches Cloud Logging
- Test 7: Startup latency
- Test 8: Shared resources
- Test 9: ADK’s CloudRunSandboxCodeExecutor
- Results summary
- Monitoring
- Pricing
- Verdict
- What works
- What doesn’t, yet
- Who should use it
Explain (TLDR) like I am...
Imagine your toy room has a big box, and inside it you can set up lots of tiny play corners for visitors you don't know. Each corner has its own walls and no window to the outside, so nobody can wander off or peek at your things.
The corners are good walls, but they all sit on the same floor. If a visitor makes a terrible racket, the whole room gets slow. And a note pinned to the floor, like a secret you stuck there, can still be read.
Sandboxes run inside a service you already operate, so there is no new vendor and no new bill: they use the service's CPU and memory. The sandbox runtime is not named in the documentation, and the feature is a Preview under pre-GA terms.
The material points: a sandbox can read every file the host container can see, including a mounted secret, and the command lines you pass, such as environment values, are written to your logs. Treat the host image as part of the trust boundary and do not pass confidential values on the command line.
The presenting need is running code you do not trust without giving it the service's own credentials. The treatment here is a gVisor sandbox with the network off, no environment and no metadata server, and in my tests that held.
Side effects to watch: the sandbox reads host files, including a mounted secret, and shares the host's CPU, so busy sandboxes slowed a CPU job on the host by four to eight times. A timeout in the ADK executor also left the sandbox process running. Size the host and keep secrets off its disk.
There is real relief in letting untrusted code run somewhere that cannot phone home or see your environment variables, and most of that relief is earned: the walls were where the documentation said they would be.
The unease comes from the edges you only find by looking: a secret that was one file read away, a command line that quietly lands in the logs, and a neighbor that can slow everyone else down. Naming those early makes the team's trust in the feature steadier.
Think of the host as the stage and each sandbox as a player in a booth with no cable out. Starting a new booth took about a fifth of a second in my runs, and a thousand of them one after another played in tune.
The catch is the shared mix: every booth draws on the same amplifier. Put a few players on a hard loop and the stage's own band slows to a crawl. Keep the sound check honest: leave real secrets off the stage floor.
The pitch is that sandboxes come with the service you already run: one flag, no extra price, and a start-up time of about a fifth of a second in my test, under Google's own figure of 500 milliseconds.
The honest positioning is for teams that size their own host. The walls are real gVisor, but sandboxes share the host's CPU and file system, so plan capacity and keep secrets out of the container. That is a story about control, not a free lunch.
 See the source code here: gcp-sandboxes/cloud-run-sandboxes
Overview
Cloud Run sandboxes, in Preview since July 8, 2026, let a Cloud Run container start child sandboxes for code it doesn’t trust. You switch them on with one container setting, --sandbox-launcher, and Cloud Run mounts a sandbox binary into your container at /usr/local/gcp/bin/sandbox. Your code calls it: sandbox do -- <command> runs one command in a fresh sandbox and deletes the sandbox afterwards. There’s no separate service and no separate price, because the sandboxes use the CPU and memory of the instance they run in. The docs say sandboxes have no access to “the parent workload, environment variables, secrets, or the Google Cloud metadata server”, and Google’s launch post says a service “starts, executes, and stops 1,000 sandboxes with an average of 500ms latency”. The docs don’t name the isolation technology.
This post, part 4 of 6 in the Google Cloud Sandboxes series, tests those claims. Part 2 covered the sandbox behind Managed Agents in the Gemini API and part 3 the Agent Platform sandboxes, both Google-operated services. Cloud Run sandboxes are different in one way that shapes every result below: the sandbox lives inside your own instance, so you operate the host. Part 1 maps all of Google Cloud’s options, and parts 5 and 6 cover GKE Agent Sandbox and Agent Substrate on GKE.
I tested it on November 14, 2026 in us-central1, on one service with 2 vCPU and 4 GiB, and recorded a clean run of every test for the video. Seven results stood out:
- The boundary is gVisor, inside a second-generation microVM. The host reports Linux 6.9.12 (and 6.18.60 on later instances); a sandbox reports
4.19.0-gvisorand admesgthat starts with “Starting gVisor…”. The mounted directory holdssandbox,runscandgvisor-bin. - Environment variables stay out, but files don’t. The service’s environment variable and its Secret Manager secret exposed as an environment variable were invisible. The same secret mounted as a file was readable, and so was a root-only
0600file, because the sandbox sees the host’s root file system. The sandbox ran as root, andsudofailed. - The network is closed and the metadata server stays closed. With
--allow-egressthe internet opened up, the metadata server still timed out, and the sandbox followed the service’s Direct VPC egress setting. --envvalues are logged. Everysandboxcommand line, including--env TOKEN=..., appears in Cloud Logging, in a stream calledrun.googleapis.com//var/log/sandbox.log.- A sandbox starts in about 0.15 to 0.19 seconds, but the host starts only 4 to 6 per second. One thousand sequential sandboxes averaged 153 ms (186 ms in an earlier run). Concurrency didn’t raise throughput, and 100 at a time produced start failures.
- Busy sandboxes slow the host a lot. A CPU job that took 0.38 s on the idle host took 1.4 s with 4 busy sandboxes and 2.8 s with 8. Memory exhaustion killed only the sandbox.
- The ADK executor shipped, and its timeout leaves the sandbox running.
CloudRunSandboxCodeExecutoris in google-adk 2.14.1. After its 300 second timeout, the sandbox process kept using a full CPU.
Setup
New to Cloud Run? A service runs your container image and scales instances up and down; an instance is one running copy. Sandboxes are launched by code running inside an instance, so they live and die with it. That is why I pinned the service to exactly one instance.
I used gcloud 593.0.0 (core 2026.11.06; the beta commands are needed), Python 3.13.12 on my laptop, and google-adk 2.14.1 for the last test. The service is us-central1, second generation, 2 vCPU and 4 GiB, minimum and maximum one instance, CPU always allocated (so detached sandboxes keep running between requests), concurrency 10, and no public access.
Step 1: The host image
Sandboxes see the host’s root file system, so every tool a sandbox uses has to be in the host image. Mine is a Python image with curl, procps, iproute2, openssl, util-linux and sudo, a root-only 0600 file with dummy content, and a small command endpoint (Step 3):
FROM python:3.12-slim
RUN apt-get update \
 && apt-get install -y --no-install-recommends curl procps iproute2 openssl util-linux sudo \
 && rm -rf /var/lib/apt/lists/*
RUN echo "m2c-root-only-canary" > /etc/m2c-0600 && chmod 600 /etc/m2c-0600
COPY server.py /app/server.py
CMD ["python3", "/app/server.py"]
Step 2: Deploy a private service
deploy.sh builds the image with Cloud Build and deploys the service with a plain environment variable (PLAIN=visible) and a dummy Secret Manager secret, exposed twice: as the environment variable DUMMY_SECRET and as a file at /secrets/dummy.
gcloud run deploy sbx-host --image "$IMAGE" --no-allow-unauthenticated \
  --cpu 2 --memory 4Gi --execution-environment gen2 \
  --min-instances 1 --max-instances 1 --concurrency 10 --no-cpu-throttling --timeout 1800 \
  --set-env-vars PLAIN=visible \
  --set-secrets DUMMY_SECRET=m2c-dummy:latest,/secrets/dummy=m2c-dummy:latest
A new project needed one extra step: Cloud Build runs as the default compute service account, which had no rights to read the uploaded source until I gave it roles/cloudbuild.builds.builder. The image build took 42 seconds.
Step 3: Get a shell on the instance
Everything in the tests runs on the instance, so I needed a shell there. I used both ways.
Cloud Run SSH (Preview since October 7, 2026) needs --ssh on the deployment, and gcloud beta run services ssh sbx-host then opens a root shell. The first call created an OS Login profile and an SSH key on my laptop. The command has no --command flag and needs a terminal, so for the scripted runs I wrapped it in a pseudo-terminal (ssh_run.py in the companion repo).
A private command endpoint. About 50 lines of Python in the image run a shell script posted to it and stream the output back. It is a remote-code-execution endpoint by design, so the service is IAM-only, and I call it with gcloud auth print-identity-token:
curl -sSN -X POST -H "Authorization: Bearer $(gcloud auth print-identity-token)" \
--data-binary @t2_boundary.sh "$SERVICE_URL/run"--no-allow-unauthenticated and delete it afterwards. Test 3 shows why: a sandbox cannot call it, because without the metadata server it cannot get a token.
Testing
Test 1: Turning it on
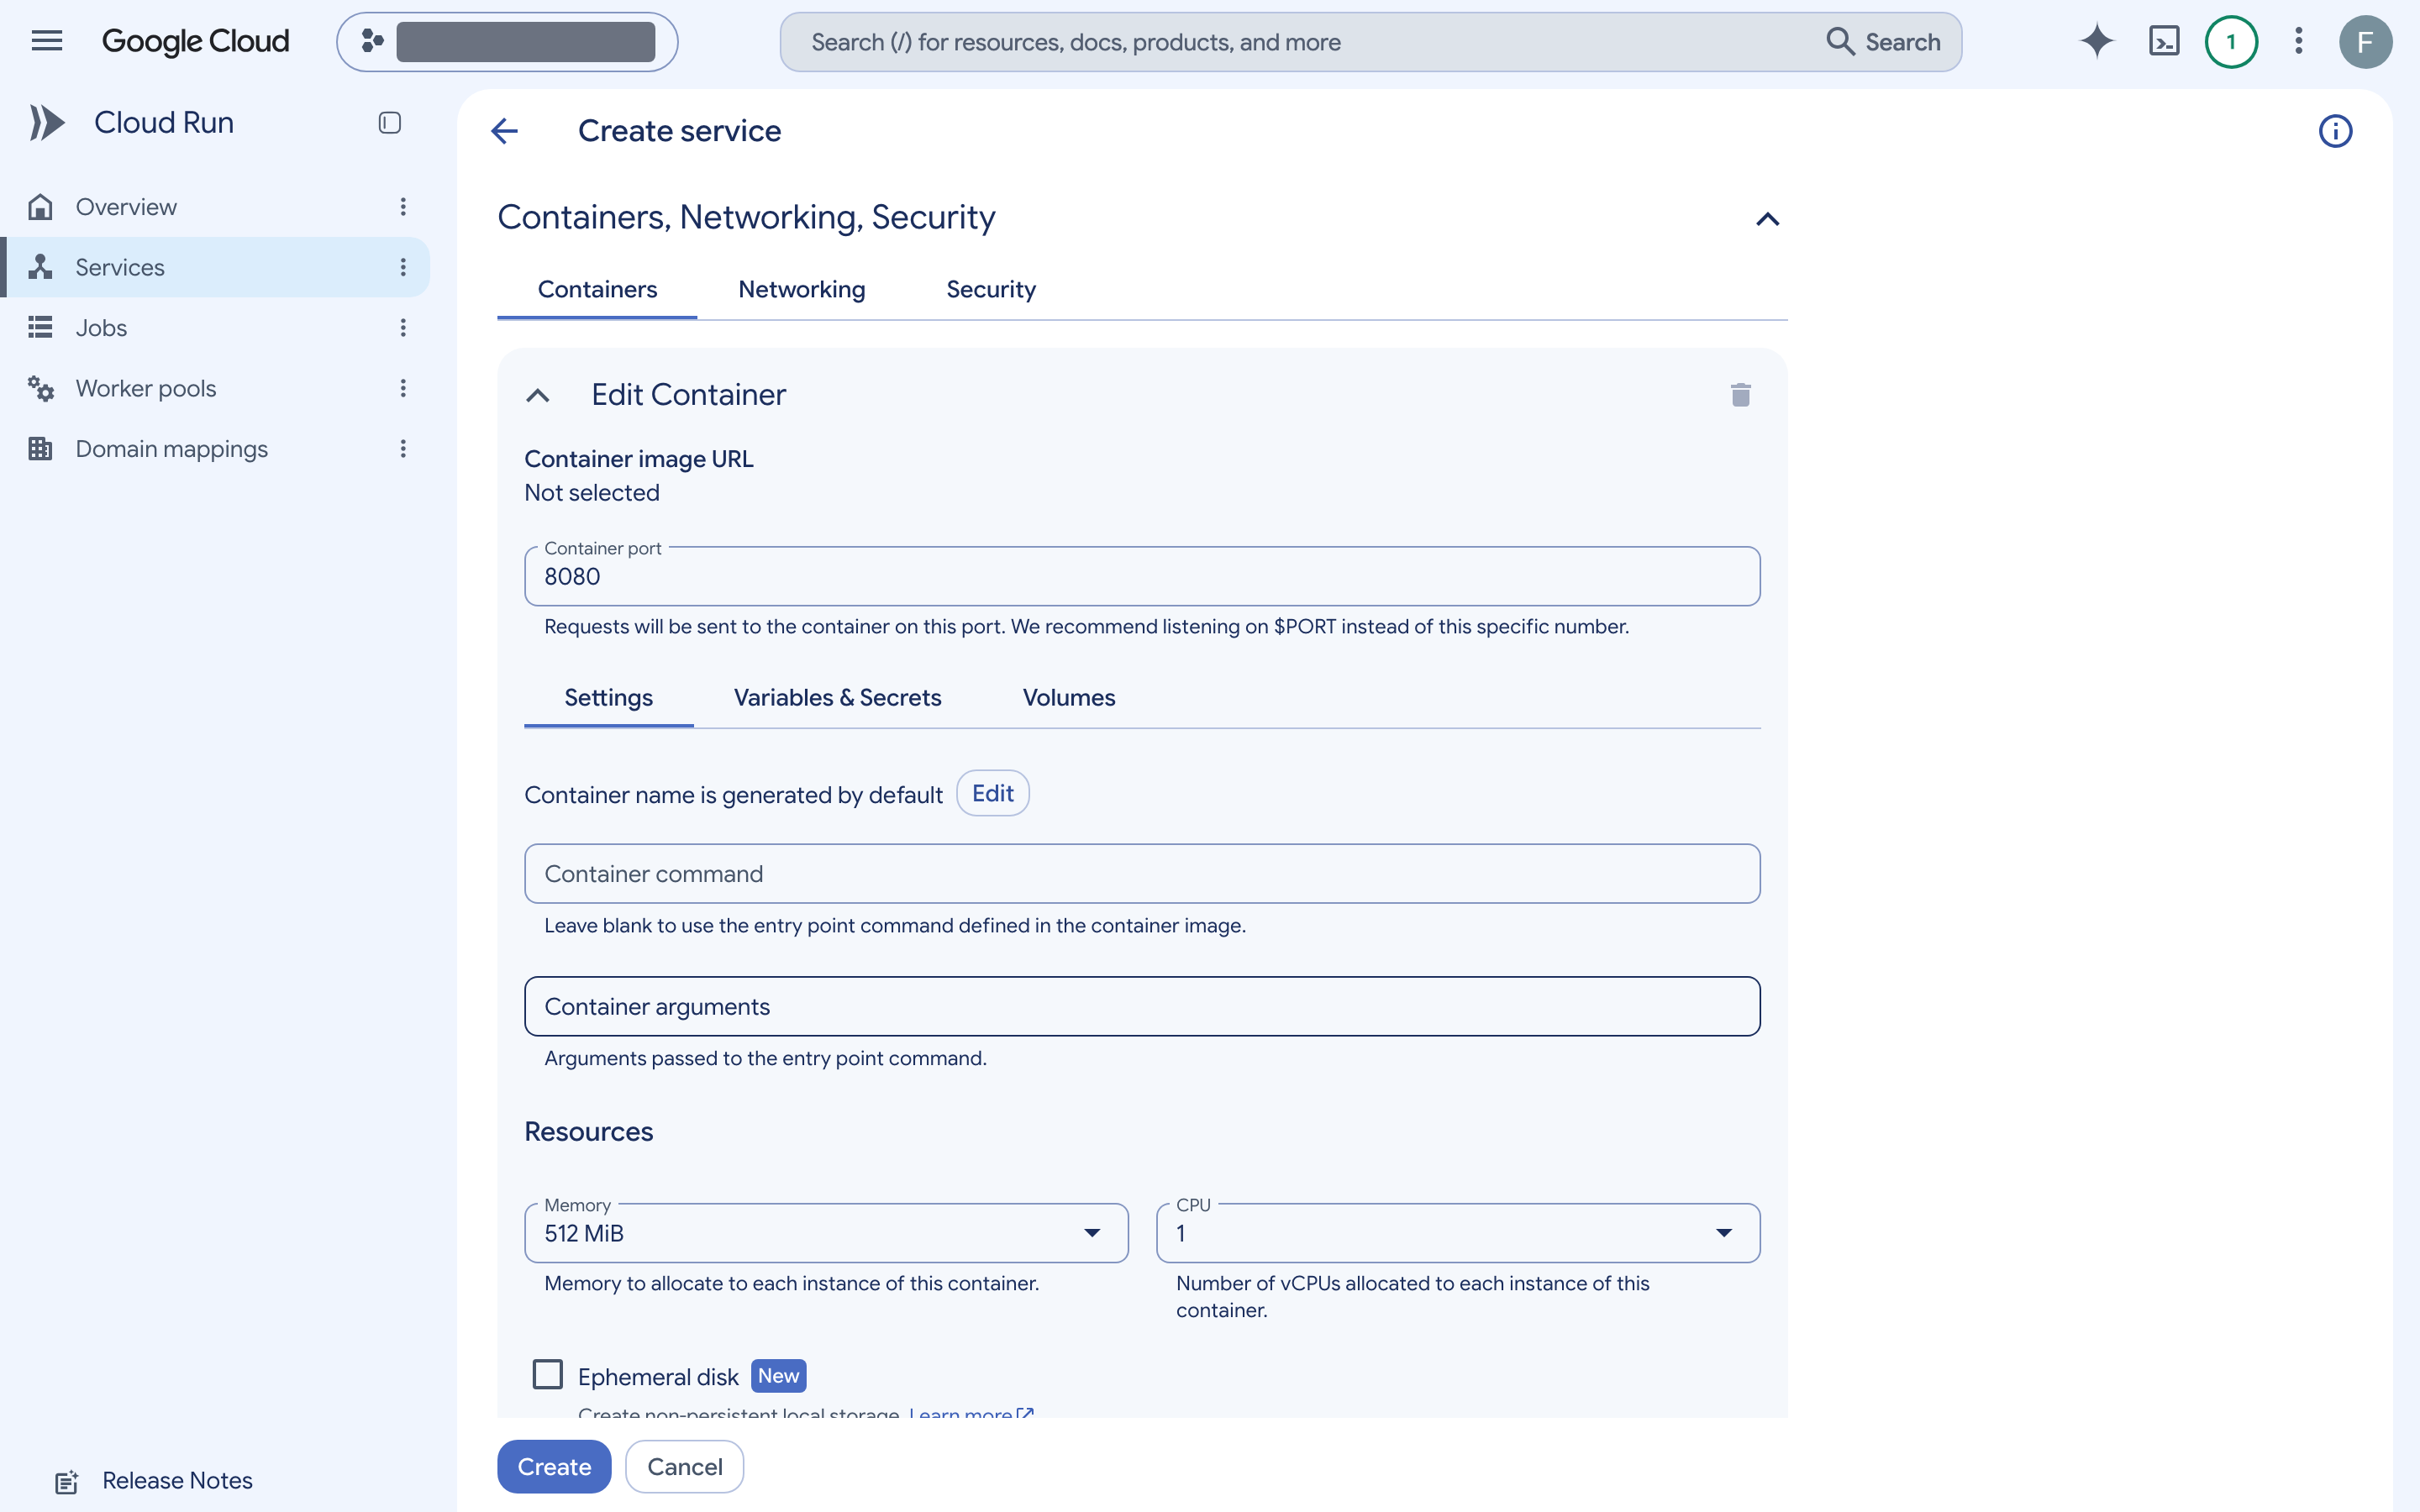
I started in the console, where I looked for the setting. In Create service, I opened Containers, Networking, Security and went through the container’s Settings, Variables & Secrets and Volumes tabs, plus Networking and Security. There is no sandbox setting anywhere.
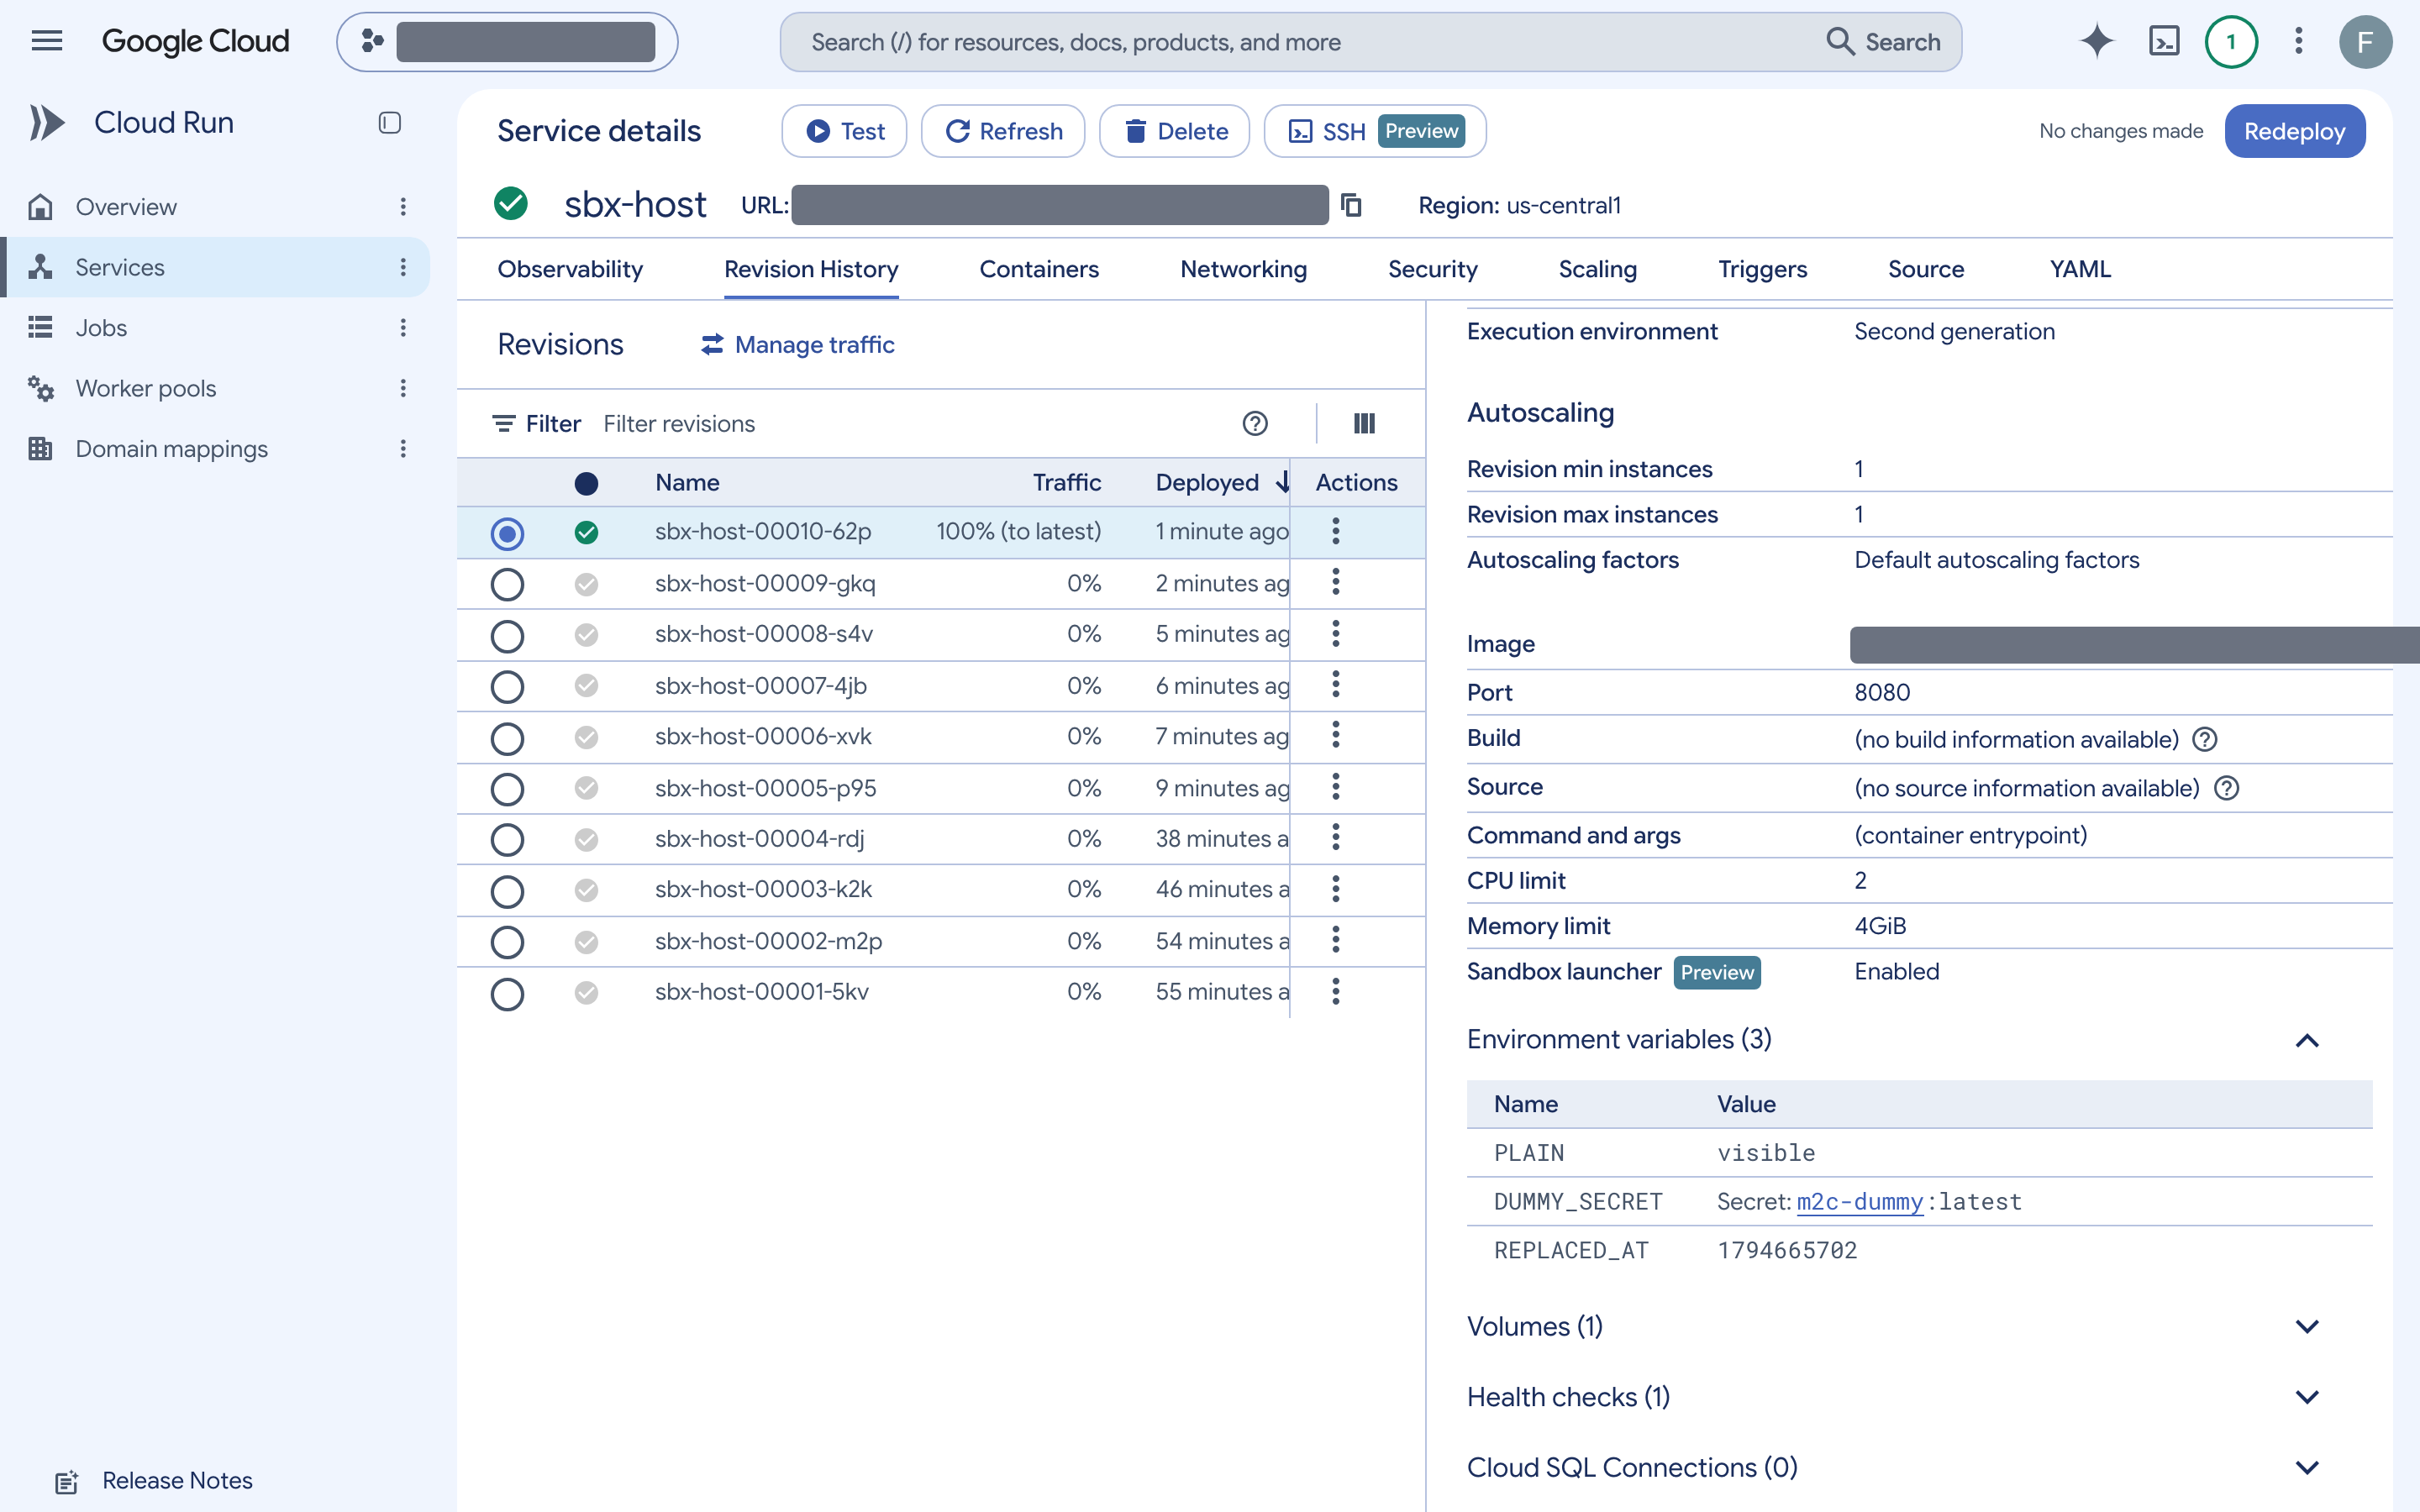
The console shows the setting only for an existing revision (Revision History, then the Containers pane): “Sandbox launcher”, with a Preview badge, reading Disabled or Enabled.
To turn it on you need the CLI, and only the beta track:
gcloud run services update sbx-host --sandbox-launcherERROR: (gcloud.run.services.update) unrecognized arguments:
--sandbox-launcher flag is available in one or more alternate release tracks. Try:
gcloud beta run services update --sandbox-launchergcloud beta run services update sbx-host --sandbox-launcher took about 20 seconds and created a new revision. The YAML (gcloud run services describe --format export) gains an annotation and a container field:
metadata:
  annotations:
    run.googleapis.com/launch-stage: BETA
...
        sandboxLauncher: true
A template-level sandboxes: {} is in the YAML both before and after, so it isn’t the switch. I set the second-generation execution environment myself, so I can’t confirm that enabling sandboxes forces it, as the docs say.
Test 2: What is the boundary?
The docs never name the isolation. The execution-environments page says second generation “is a microVM”, so I asked the same questions on the host and inside a sandbox (t2_boundary.sh):
| Host (the instance) | Sandbox | |
|---|---|---|
uname -r | 6.9.12 on my first instances, 6.18.60 on later ones | 4.19.0-gvisor |
dmesg | ”Operation not permitted" | "Starting gVisor…” |
hypervisor flag in /proc/cpuinfo | 5 of 5 CPUs | 5 of 5 CPUs |
| Seccomp | filter mode, NoNewPrivs: 1 | Seccomp: 0 |
| PID 1 | my Python server | /usr/local/gcp/bin/sandbox default-entrypoint |
| Root file system | overlay, read-write | 9p, read-only, plus a tmpfs /tmp |
The host kernel version changed between my first instances and the ones I recorded, hours apart, so Google moves it under you. The host is a real guest kernel with a hypervisor underneath; the sandbox is gVisor. The mounted directory settles the rest: /usr/local/gcp/bin holds sandbox, runsc (gVisor’s runtime) and gvisor-bin, and while a sandbox runs, ps shows runsc-sandbox --network=none --overlay2=root:memory --platform=xemu. The xemu platform is not one gVisor’s public docs list among its platforms, and I don’t know what it does. The hypervisor flag is set inside the sandbox too, because gVisor passes /proc/cpuinfo through, so the flag alone doesn’t tell you which layer you’re in. The host also reports 5 CPUs, though I configured 2 vCPU.
Test 3: What can a sandbox see?
The service has PLAIN=visible, the secret as an environment variable, the same secret as a file, and the root-only file. From a sandbox (t3_visibility.sh):
| Probe | In the sandbox |
|---|---|
| Environment | Only HOME, PATH (which I set) and PWD. PLAIN and DUMMY_SECRET are absent |
id | uid=0(root) |
sudo -n true | Fails: “unable to open /etc/sudoers: Operation not permitted” |
cat /etc/m2c-0600 (root, mode 0600) | Readable: m2c-root-only-canary |
cat /secrets/dummy (the mounted secret) | Readable: m2c-secret-canary-4417 |
| Processes | Only the sandbox’s own (sandbox, sh, ps) |
| Metadata server, from the host | HTTP 200 |
| Metadata server, sandbox without egress | ”Failed to connect … after 0 ms: Could not connect to server” |
Metadata server, sandbox with --allow-egress | curl gives up with “Connection timed out” after 3 seconds, also by name (metadata.google.internal) |
So “no access to secrets” holds for environment variables and not for files. The docs only warn about this under the --mount flag (“never mount paths that contain secrets or credentials”); the same applies to the whole host file system, so anything in the host image or mounted into it is exposed. Expose secrets to the host as environment variables, or keep the sandbox host’s container free of them. The docs also say processes “run with sudo privileges as a non-root user”. I saw the opposite, root without a working sudo, which matches what other people reported. Root inside gVisor is not root on the host, but it is why a 0600 root-only file isn’t protected.
Test 4: Network
The sandbox is closed by default and --allow-egress opens it, with nothing in between (t4_network.sh):
| Probe | Default | --allow-egress |
|---|---|---|
curl https://www.google.com | Could not resolve host (curl exit 6) | HTTP 200 |
getent hosts www.google.com | fails with exit status 2 | resolves |
curl https://storage.googleapis.com | not tried | HTTP 400 (reachable) |
curl http://127.0.0.1:8080/ (the host’s own server) | refused | refused |
| The service’s own public URL, no token | not tried | HTTP 403, the same as from the host |
Without egress the failure is DNS, not a refused connection, so there’s no DNS at all. The host’s loopback stays unreachable in both modes, so a sandbox can’t talk to the app that launched it. The last row is the useful one: a sandbox with egress can reach the service’s public URL, and my private endpoint stayed protected only because the sandbox has no way to get an identity token.
The optional test: does --allow-egress follow the service’s network settings? I deployed a second service (sbx-internal) with ingress set to internal, and sent it requests with no token. A 403 means the request came in through the VPC and was refused for lack of a token; a 404 means it came from outside:
| No VPC settings | Direct VPC egress, all traffic | |
|---|---|---|
| Host | 404 | 403 |
Sandbox with --allow-egress | 404 | 403 |
The sandbox’s egress takes the same path as the host’s, so --allow-egress isn’t “the public internet”: it is whatever the service can reach. With Direct VPC egress it can reach private services.
Test 5: Filesystem and state
I followed the docs’ description (writes go to a memory overlay, --write is needed outside /tmp, tars skip /tmp) and looked at fork, which only the CLI reference mentions (t5_state.sh):
| Step | Result |
|---|---|
touch /etc/x | Read-only file system |
touch /tmp/x | works |
--write, then look on the host | the sandbox wrote /etc/x; the host has no such file |
--write --export-tar: write /root/f and /tmp/g | the tar has ./root/f and nothing from /tmp |
--write --import-tar into a new sandbox | /root/f is back; /tmp/g is gone |
fork w1 w2 of a sandbox counting once a second | w1 was at 6; w2 started again at 1; both keep counting. A file w1 wrote before the fork is in w2 |
--rootfs /tmp | FetchSpec failed: loading container: file does not exist, exit 128 |
So fork copies the writable files and restarts the command line; it isn’t a snapshot of a running process. fork --help also lists a --publish flag for ports that none of the docs mention. A few CLI details cost me time: a detached sandbox (run --detach) keeps your stdout pipe open until you redirect it, fork needs --detach to return, and exec needs -- before commands that start with a flag (exec w1 -- sh -c ...).
Test 6: What reaches Cloud Logging
A practitioner reported that every sandbox command line, --env values included, lands in Cloud Logging, so I passed a canary:
sandbox do --env TOKEN=m2c-canary-7731 -- /bin/echo helloSearching for the canary with gcloud logging read '"m2c-canary-7731"' found two entries in the log run.googleapis.com//var/log/sandbox.log, a start and an end:
[start] cwd=/ "/usr/local/gcp/bin/sandbox do --env TOKEN=m2c-canary-7731 -- /bin/echo hello"
[end] exit_code=0 elapsed=119ms "/usr/local/gcp/bin/sandbox do --env TOKEN=m2c-canary-7731 -- /bin/echo hello"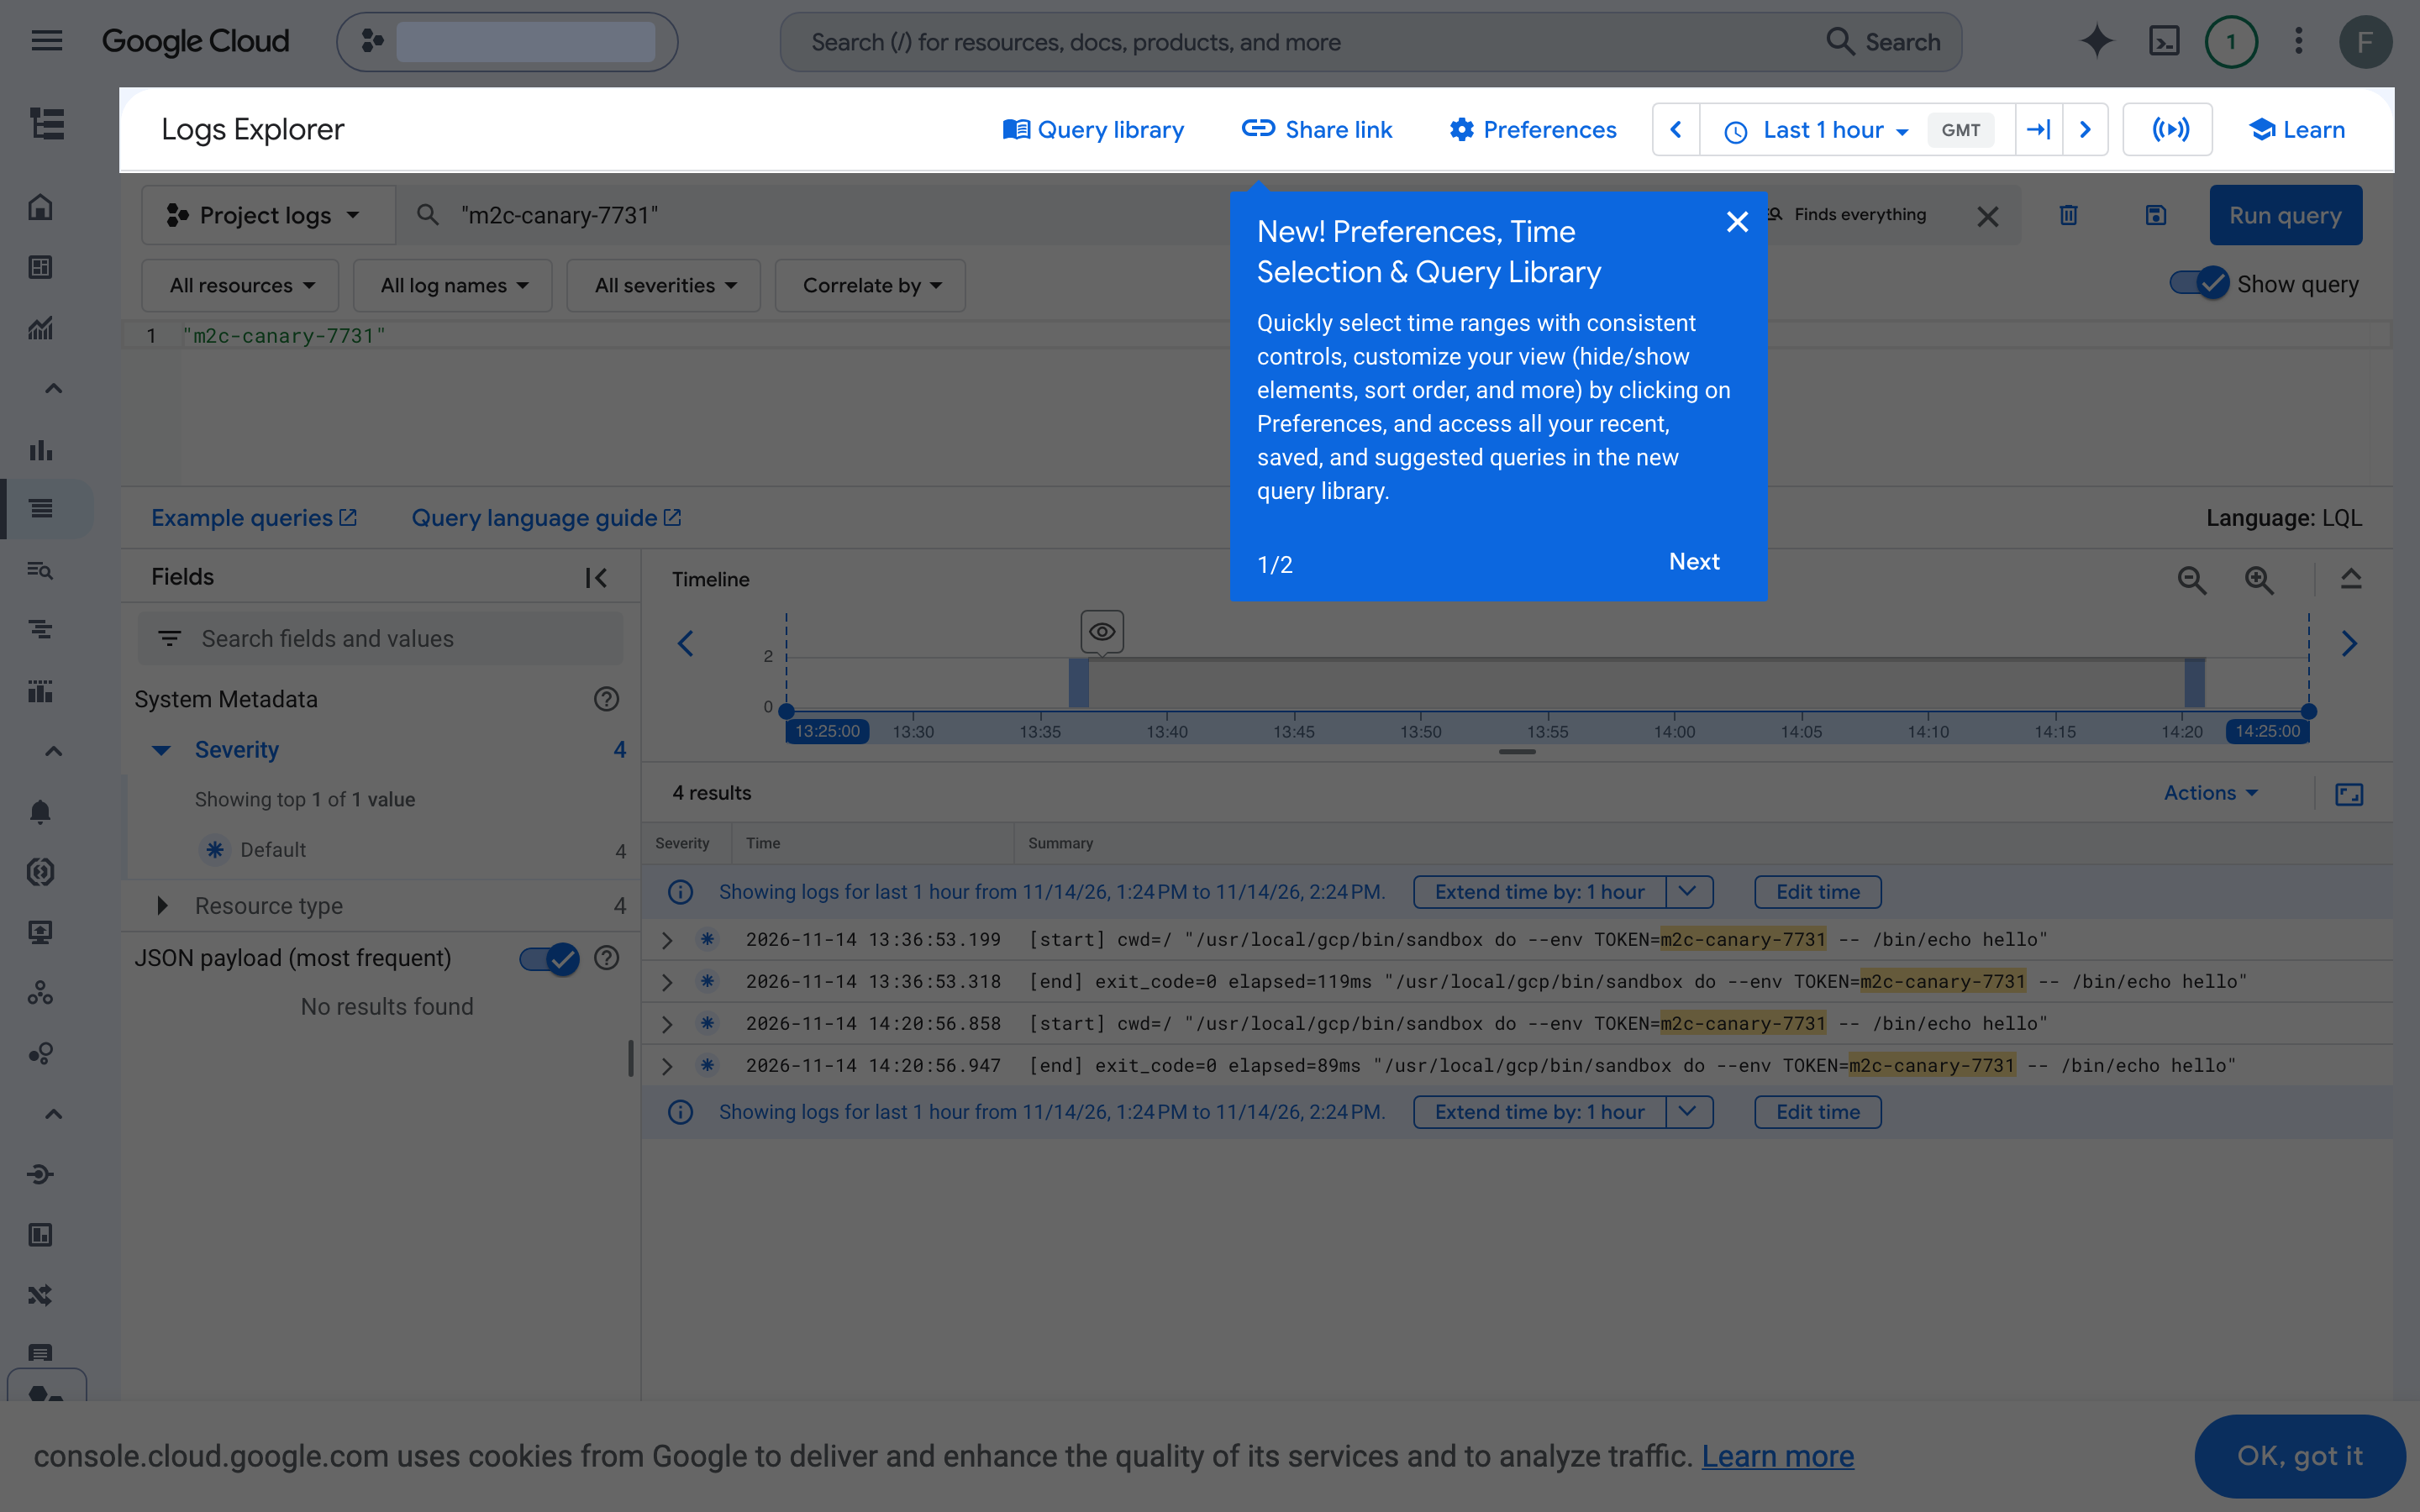
The sandbox’s output (hello) isn’t logged. Every sandbox call is logged this way (run, exec, delete too), so a busy host writes two entries per call. The docs tell you not to pass secrets with --env because “they might be visible to the sandbox processes”, and they leave out that the command line is logged and stays in your project’s logs.
Test 7: Startup latency
Google’s post says a service “starts, executes, and stops 1,000 sandboxes with an average of 500ms latency”, without machine, concurrency or method. I measured on the instance with date +%s%N around sandbox do -- /bin/true (t7_latency.sh), which includes starting the sandbox, running the command and deleting it:
| Run | Sandboxes | Mean per sandbox | p50 | p95 | Rate | Failures |
|---|---|---|---|---|---|---|
| Sequential | 1,000 | 153 ms | 154 ms | 177 ms | 6.4 per second | 0 |
| 10 at a time | 300 | 1,684 ms | 1,696 ms | 2,005 ms | 5.7 per second | 0 |
| 50 at a time | 300 | 8,848 ms | 8,806 ms | 11,077 ms | 5.3 per second | 0 |
| 100 at a time | 300 | 20,787 ms | 21,383 ms | 29,696 ms | 4.3 per second | 1 |
100 exec calls into one warm sandbox | 100 | 85 ms | 82 ms | 104 ms | 0 |
An earlier exploration run on a previous instance gave 186 ms for the sequential thousand (p95 247 ms), so I’d call it 150 to 190 ms. The same exploration with 1,000 sandboxes at each concurrency level gave 5.5, 4.9 and 4.2 per second, and 23 failures out of 1,000 at 100 at a time. The failure text was failed to start container: Timeout exceeded waiting for container to start execution.
Two things follow. A fresh sandbox is faster than Google’s figure, on a stated machine: 2 vCPU and 4 GiB, us-central1, one /bin/true. And the host starts about five sandboxes a second whatever the concurrency, so the per-sandbox time you see is mostly queueing: roughly 170 ms times the number in flight. Google doesn’t give the concurrency behind its 500 ms. If your agent bursts to dozens of sandboxes at once, each one waits for the others, and a hundred at once hit start timeouts.
Warm reuse is the docs’ own tip: start one sandbox with an idle command and run each command with exec. 100 exec calls averaged 117 ms in my exploration run, about 70 ms under a fresh do. For context, a Japanese hands-on from G-gen logged elapsed=541ms for one do call on a service in asia-northeast1; I’m quoting their number, not reproducing it.
Test 8: Shared resources
The docs say only that “Sandboxes share the CPU and memory allocated to the host container”. Three tests show what that means.
8a: a busy neighbor. I started detached busy-loop sandboxes (while :; do :; done) and measured two things on the same 2 vCPU instance: 100 trivial requests from my laptop (a handler that returns “ok”), and a fixed CPU job that the host itself runs (a Python loop of 3 million iterations, which takes a bit over a third of a second alone). The table is the recorded run; the earlier exploration run is in brackets.
| Request p50 / p95 from the laptop | Host CPU job, mean of 5 | |
|---|---|---|
| Idle | 160 / 170 ms | 383 ms (358) |
| 4 busy sandboxes | 177 / 189 ms | 1,361 ms, 3.6 times slower (1,876, 5.2 times) |
| 8 busy sandboxes | 177 / 192 ms | 2,755 ms, 7.2 times slower (2,834, 7.9 times) |
The trivial request barely moved, about 17 ms, because it needs almost no CPU. The job that needs CPU did: five and nine runnable processes (four or eight busy sandboxes plus the job) on two vCPUs would give 2.5 and 4.5 times with an even split, and I saw more. Sandboxes have no CPU limit of their own, so a busy sandbox slows the app that launched it.
8b: memory. One sandbox allocated 64 MiB at a time and touched every page, until it died.
host before: server PID 1, MemAvailable: 3593132 kB
allocated 3072 MiB
waiting on pid 7: ... urpc method "containerManager.WaitPID" failed: EOF
sandbox exit status: 1
host after:  server PID 1, uptime 4493.38 s, MemAvailable: 3621840 kB
It died at about 3 GiB of the 4 GiB instance, within five seconds. The host server kept its PID and its uptime, memory came back, and the system log has no restart or out-of-memory entry for the instance. So memory exhaustion in one sandbox killed only that sandbox, which matches what another tester reported. The sandbox shares the 4 GiB, so the app’s own memory and every other sandbox are squeezed first.
8c: the instance goes away. I started a detached sleep 3600 sandbox, then deployed a new revision, which replaces the instance. Cloud Run started the new instance about six seconds after my last call. The old revision’s log has the launch ([end] exit_code=0 elapsed=115ms is run --detach returning, not the sandbox ending), and then nothing: no sandbox exit, no shutdown line. Sandboxes die with their instance without a trace in Cloud Logging, so don’t keep state in one.
Test 9: ADK’s CloudRunSandboxCodeExecutor
The research I started from disagreed on whether the ADK executor shipped. It did: pip install google-adk gave 2.14.1, and from google.adk.integrations.cloud_run import CloudRunSandboxCodeExecutor imports. It runs sandbox do <python> and passes the code on stdin, defaults to no egress and a 300 second timeout, and can’t be stateful.
adk deploy cloud_run --with_cloud_run_sandbox deployed the agent with sandboxLauncher: true in the YAML, as documented. The model route took work. The deploy defaults to Vertex AI, and gemini-3.8-flash in us-central1 returned a 403 even after I gave the service account roles/aiplatform.user; I switched the service to a Gemini API key, and there gemini-2.5-flash returned a 404, “no longer available to new users”. With the prompt “compute 17 * 23 with Python” the agent first ended with MALFORMED_FUNCTION_CALL, because the model tried a function call. Telling it to answer with a fenced Python block fixed that, and the executor returned 391.
Then I asked the agent to run while True: pass:
codeExecutionResult -> {'outcome': 'OUTCOME_FAILED', 'output': 'Code execution timed out after 300 seconds.'}It took 316 to 320 seconds. My first attempt got a 504 instead, because Cloud Run’s own request timeout is also 300 seconds by default and fired first. The timeout works, but I wanted to know what it kills. The executor kills the sandbox do client process with subprocess.run(timeout=...). The executor’s own code comment says subprocess.run “kills the sandbox” before re-raising, but what it kills is the sandbox do client process. Over SSH, shortly after the timeout, the runsc processes of the looping sandbox were still there and used 102 ticks a second, one full CPU. In my first attempt they were still there a minute later. Request-based billing throttles CPU between requests, so a leftover sandbox costs most while requests are active, but nothing cleans it up.
Results summary
| Claim or question | Result |
|---|---|
| Console enablement | View only; enable with gcloud beta ... --sandbox-launcher; the GA track rejects it |
| Isolation | gVisor (4.19.0-gvisor, runsc, xemu platform) inside a second-generation microVM |
| No env vars, secrets, metadata | Environment variables and the metadata server: yes. A mounted secret and a root-only file: readable |
| User | root (uid=0), sudo fails; the docs say non-root with sudo |
| Network | Closed (no DNS); --allow-egress follows the service’s VPC egress; the host’s loopback is unreachable |
| Writes | Read-only outside /tmp; --write is an overlay; tars skip /tmp; fork restarts the command, copies files |
| Logging | Command lines, --env values included, in sandbox.log; output isn’t logged |
| ”1,000 sandboxes at about 500 ms” | 153 ms mean sequential (186 ms in an earlier run), about 5 per second at any concurrency; 500 ms matches about 3 in flight |
| Shared resources | No per-sandbox limits: 4 busy sandboxes slowed a host CPU job 3.6 to 5.2 times, 8 slowed it 7.2 to 7.9 times; memory exhaustion killed only the sandbox |
| ADK executor | Shipped; 300 s timeout works; the timed-out sandbox kept running |
Monitoring
There’s no sandbox view in the Google Cloud console. The service’s Observability > Metrics page shows the usual Cloud Run charts (request count and latencies, container instance count, billable instance time, startup latency, health checks), and a sandbox’s CPU and memory count as the container’s. I didn’t find a per-sandbox chart or a list of running sandboxes. What the console does show:
- Revision History > Containers: the Sandbox launcher setting, read only (Test 1).
- Logs Explorer: the
run.googleapis.com//var/log/sandbox.logstream, with a[start]and an[end]entry persandboxcommand, including its exit code andelapsedtime (Test 6). That’s the only trace of what ran. Output isn’t there, and nothing is logged when a sandbox is lost with its instance (Test 8). - SSH (Preview): a button on the service page that opens a shell on a running instance, if the service was deployed with
--ssh.
Pricing
Cloud Run sandboxes add no charge: the blog post says there is “no additional cost or premium”, and the pricing page doesn’t mention them. What you pay for is the instance, and an instance-based service bills for its whole life, idle or not. At the us-central1 list rates ($0.000018 per vCPU-second and $0.000002 per GiB-second for instance-based billing), my 2 vCPU, 4 GiB service costs about $0.158 an hour, or about $3.80 a day. The monthly free tier (240,000 vCPU-seconds and 450,000 GiB-seconds) covers roughly 31 hours of it, because the memory allowance runs out first.
My service ran for 1 hour 15 minutes: about 9,000 vCPU-seconds and 18,000 GiB-seconds, or about $0.20 at list price before the free tier. The ADK service (request-based, billed for its few busy minutes), a second small service for the VPC test, five Cloud Build runs and the Gemini tokens for the ADK agent add cents. I estimated all of this from the rates and run times; I didn’t wait for the billing report.
Two costs aren’t obvious. A sandbox that nobody deletes keeps using the instance’s CPU, as the ADK test showed. And with request-based billing, Cloud Run throttles CPU outside requests, which I’d expect to starve detached sandboxes too, so I used instance-based billing for every test.
To clean up everything the tests created (services, images, secrets, the temporary API key and the role grants):
./teardown.shVerdict
What works
The boundary is real and well chosen: gVisor with no network, no environment and no metadata server, started in about 0.15 to 0.19 seconds, and it reports the same 4.19.0-gvisor kernel as the Code Execution and Shell sandboxes in part 3. Memory exhaustion killed only the sandbox. The network behaves as a single switch that follows the service’s own VPC setting, and the sandbox can’t get a token to call anything private. For a service that already runs your own agent code, it’s one flag and no extra service.
What doesn’t, yet
The sandbox shares the instance, and the trouble comes from the sharing. It reads every file the host container can see, including a mounted secret and root-only files. It has no CPU limit of its own, so a few busy sandboxes slowed a CPU job on the host four to eight times. The command line, --env values included, goes to your logs. The ADK executor’s timeout leaves the sandbox running. The console shows the setting but can’t change it, the flag exists only under gcloud beta, and the docs are silent on the isolation technology and on what happens to a sandbox when its instance is replaced, and they describe a sudo setup I didn’t see. Compared with the Google-operated sandboxes in parts 2 and 3, you get speed and zero extra cost and you take on the host: its sizing, its files and its logs.
Who should use it
Cloud Run sandboxes fit when you already run a Cloud Run service and want to run a model’s code next to it. Size the instance for the app plus every concurrent sandbox, keep the host image free of secrets (mount none, and pass nothing sensitive with --env), use instance-based billing, and put a timeout and a cleanup around every sandbox you start. If you need per-sandbox limits, a separate failure domain or a managed lifecycle, the managed options in parts 2 and 3 are a better fit.