Agent Substrate on GKE: Hands-On with Suspend and Resume, Density and Snapshots in Cloud Storage
By Fabio Douek
Human-led, AI-assisted. Research and implementation done with AI tools, led, tested and edited by me. How posts are labeled
Jump to section
- Overview
- Setup
- Step 1: Project, tools and versions
- Step 2: The cluster
- Step 3: What the installer does, run by hand
- Step 4: Readiness and the smoke test
- Testing
- Test 1: Install and the native Counter demo
- Test 2: What a suspend keeps, AX against native
- Test 3: Lifecycle timings
- Test 4: Wake on request through the router
- Test 5: Snapshots in Cloud Storage
- Test 6: Density
- Test 7: Latency under concurrency and control-plane load
- Test 8: Wake time by CPU limit, and bursts
- Test 9: Noisy neighbors
- Test 10: Snapshot storm, the network path and failure modes
- Results summary
- Monitoring
- Pricing
- Verdict
- What works
- What doesn’t, yet
- Who should use it
Explain (TLDR) like I am...
Imagine a toy box with a lot of tiny rooms, and each room has a sleeping robot. When a child knocks on a door, the robot wakes up in a blink and carries on, and when nobody is knocking it goes back to sleep and takes up almost no space.
I tried it on a real box. Waking took about a tenth of a second when the robot was allowed to use a lot of the box, and much longer when it was allowed almost none. And one kind of robot remembers what it was doing while asleep, and the other only remembers its homework.
Agent Substrate is open-source infrastructure that suspends an agent's sandbox to storage and resumes it on demand. On Google Kubernetes Engine it has been generally available since November 9, 2026, and I tested v1.0.0 on a small cluster, repeating measurements I had taken on Amazon EKS.
The material points: what is kept on suspend depends on a setting, not on the platform; snapshots are written to your own Cloud Storage bucket under a dedicated service account; and the snapshot upload did not cross the NAT gateway. Several defaults, such as who may call the router, need a conscious decision.
The presenting problem is idle agents that cost a full machine each. The treatment is to suspend them to disk and wake them on a request. In my tests it worked: a wake took about 120 ms with enough CPU, and 156 idle sandboxes fit on two 4 vCPU nodes.
Side effects: a wake under a tiny CPU limit took over a second, a burst of 30 wakes took 1.2 seconds at the median, and a connection that was open at suspend time did not survive. Memory survives only if the snapshot is asked to keep it.
There is real relief in being allowed to put an agent to sleep without losing its place. Most of the dread in running many agents comes from paying for each of them to sit awake, and here the sleeping ones cost almost nothing.
The friction shows up in the details you only learn by trying: the sleeper that forgot its work because nobody asked it to remember, the open connection that did not come back, and the wake that took a second because its limit was set too low. None of it is hard once you know.
Think of a session band where each player can step off stage mid-song and return exactly on the beat. When the room is quiet the stage is almost empty, and a request walks the right player back in.
The tempo depends on the player's amp: with plenty of power the entrance takes about a tenth of a second, and with almost none it drags for over a second. One more catch: only the players who were asked to remember the song come back in the middle of it; the others restart from the top.
The pitch is idle agents that cost close to nothing and answer in about a tenth of a second when called. On a two-node GKE cluster I measured that wake, 156 idle sandboxes on 8 vCPUs, and snapshots saved to Cloud Storage without crossing the NAT gateway.
The honest footnote: the speed depends on the CPU limit you give each sandbox, and what survives a suspend depends on the snapshot setting. Both are defaults worth setting on purpose, and both are in the numbers.
 See the source code here: gcp-sandboxes/agent-substrate-gke
Overview
Agent Substrate is an open-source layer that runs agents as actors: a sandbox (gVisor by default, a Cloud Hypervisor microVM as an option) that can be suspended to a snapshot and resumed on a worker pod later, or woken by a request through a router. Google describes a zero-idle model and cites “sub-500ms resume operations at over 500 suspend/resume activations per second” and “over 1,000 dormant agents per host” (launch post). The GKE release notes of November 9, 2026 declare it generally available on GKE Standard 1.37 or later, and Google’s GKE installer is the documented way to install it.
This post, part 6 of 6 in the Google Cloud Sandboxes series, tests those claims. Part 1 maps Google Cloud’s options for running code you don’t trust. Part 2 covered Managed Agents, part 3 the Agent Platform sandboxes, part 4 Cloud Run sandboxes and part 5 GKE Agent Sandbox. This part is a repeat on purpose. Two weeks earlier I ran Google AX, an agent runtime built on Substrate, on Amazon EKS (install, lifecycle, stress). Here I ran the same harness, ported, on two c3-standard-4 nodes (4 vCPU, 16 GiB, Sapphire Rapids, the same shape as the two m7i.xlarge on EKS), and I show the EKS and GKE numbers side by side.
I ran it on November 14, 2026 from a laptop, on a GKE Standard zonal cluster in us-central1-a (Rapid channel, 1.37.1-gke.2097000), with Substrate v1.0.0 (installer substrate-gke v1.0.0-gke.0) and AX at commit eac8313, which pins Substrate v1.0.0. The EKS runs used Substrate v0.6.0, so a difference can come from the platform or from the version, and I flag where it matters. Seven results stood out:
- The install is one cluster step plus two commands, and nothing asked for an allowlist. The timed steps add up to about 20 minutes from an empty project to a working task (7 for the cluster, 10 for the installer’s control-plane update, about 3 for everything else); my first pass, with mistakes, took about 36. Two defaults needed a conscious choice: who may call the router, and the project’s disk quota.
- What a suspend keeps is a setting, and I could see both settings. AX asks for a volumes-only snapshot: only
/workspacecame back, as on EKS. A native Substrate actor with memory fidelity kept its process, its/tmpand its uptime. An open connection did not survive in either. - A wake through the router took about 120 ms with a CPU to spare. 119 and 120 ms for an AX task, and 107 to 119 ms for a native actor after a first wake of 314 ms, against Google’s “sub-500ms”. With a 50m CPU limit it took 1.1 seconds, and a burst of 30 at once took 1.2 seconds at the median.
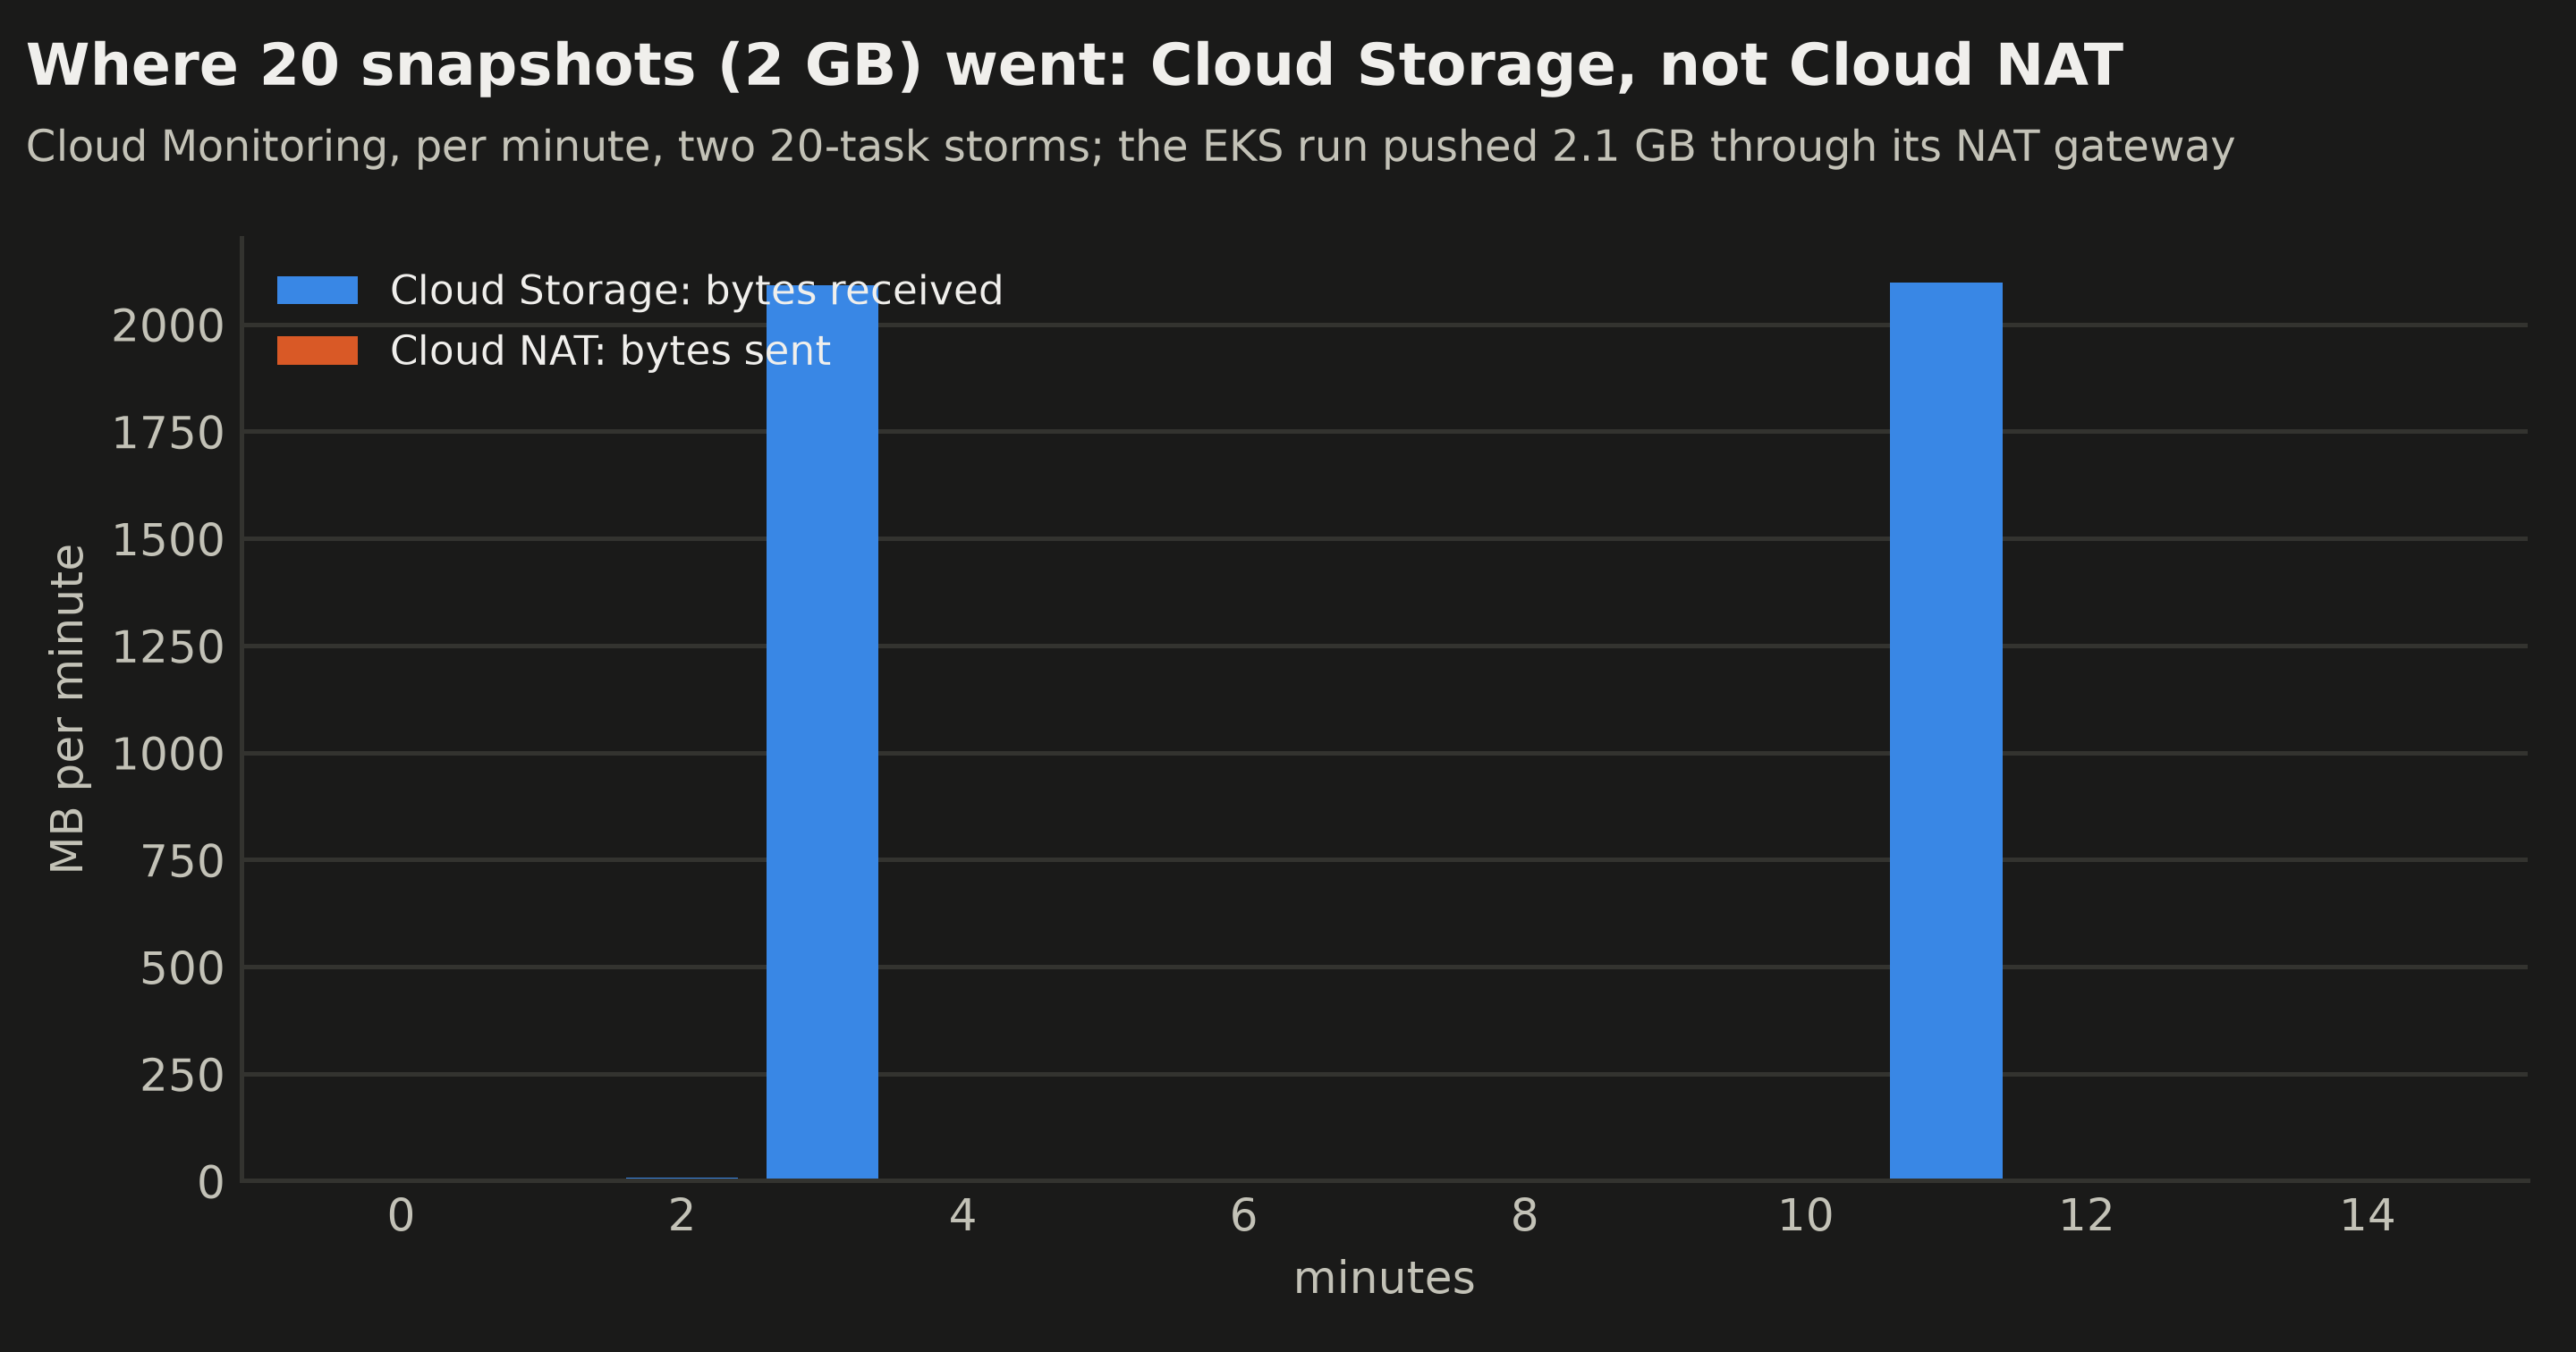
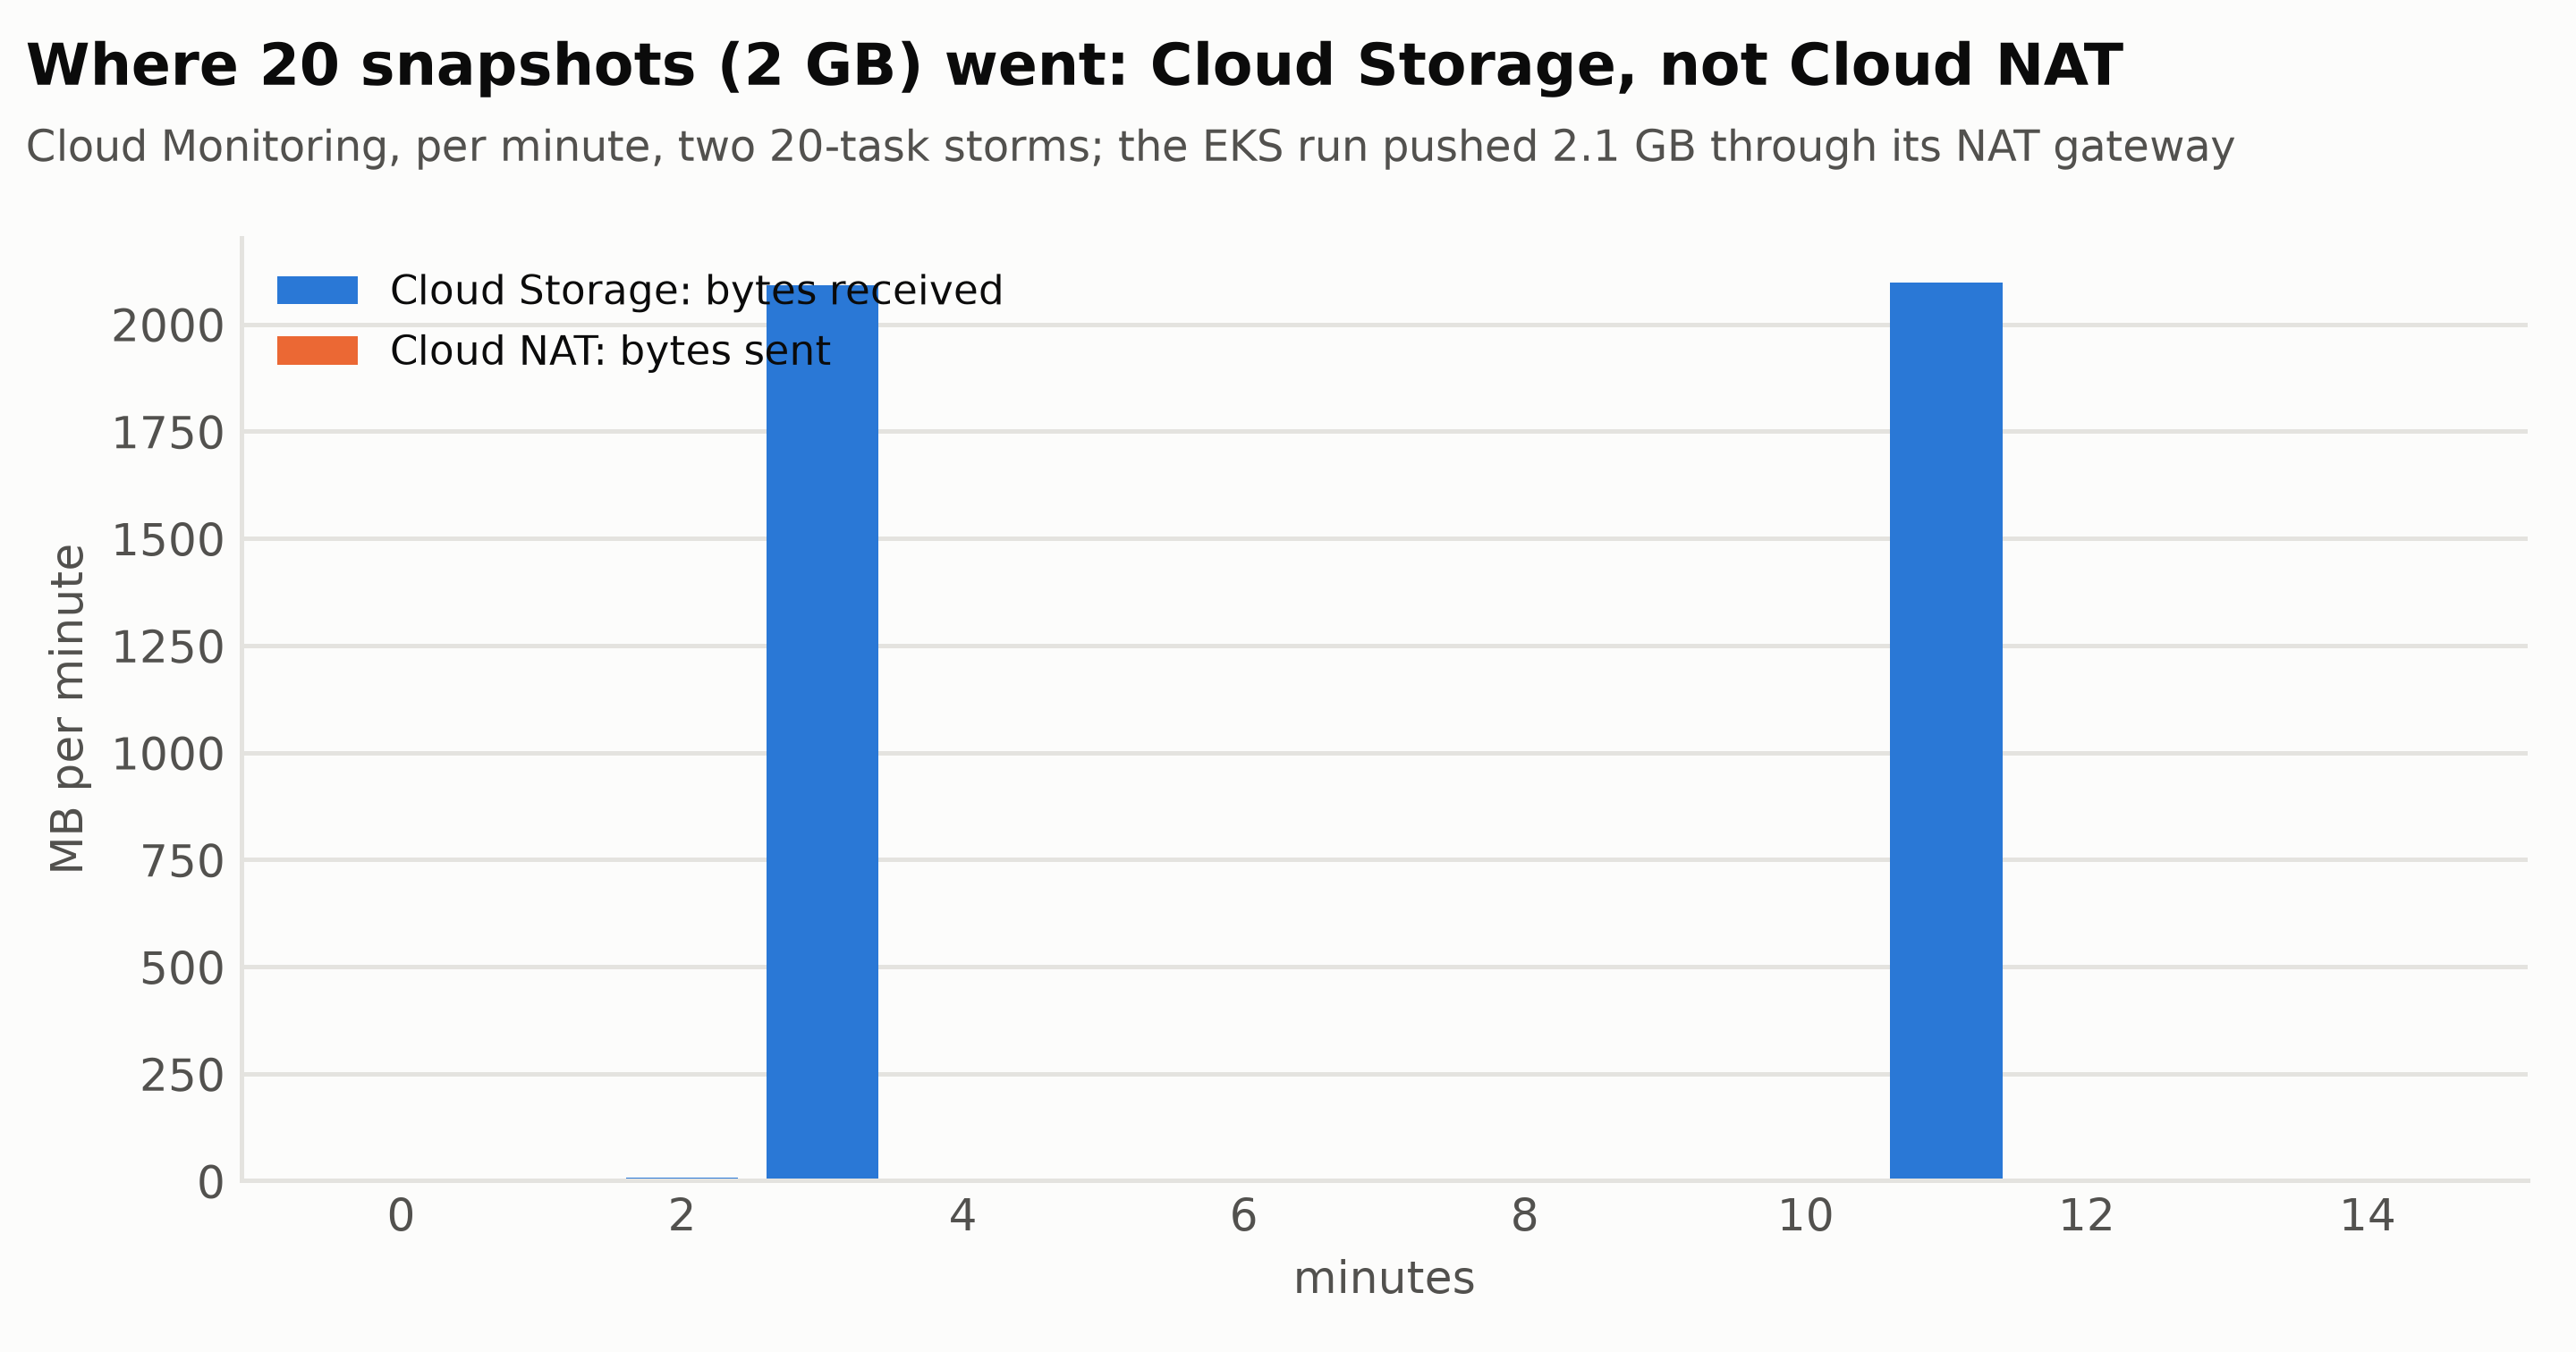
- Snapshots reached Cloud Storage 324 seconds after a suspend, and never touched Cloud NAT. Twenty 100 MB snapshots put about 2.1 GB into the bucket and 0 bytes through the NAT gateway. The EKS run pushed the same 2.1 GB through its NAT gateway.
- 156 idle sandboxes fit on two 4 vCPU nodes, then Substrate refused the next one. EKS stopped at 151. CPU bookings set the ceiling, not memory, which is why neither run came near Google’s 800 or 1,000 per host.
- Most numbers matched EKS, a few did not. Create, suspend and resume were 20 to 30% faster than on EKS and the first resume within 6%, creates and deletes ran faster, resumes under concurrency ran slower at 40 in flight, and a WorkerPool change took 14 seconds to roll out against 3 on EKS.
- The client path decides what you measure. From my laptop, a no-op
ax get taskstook 0.5 seconds. Through the CLI’s own tunnel, calls had 1 to 3 second spikes, and the suspend and resume numbers were off by that much until I used a steady port-forward.
Setup
Step 1: Project, tools and versions
I used a fresh Google Cloud project with billing and a budget alert, and a local machine: the installer fails in Cloud Shell because of its 5 GB disk. The tools I recorded:
Google Cloud SDK 593.0.0 (beta 2026.11.06)   kubectl v1.37.2   go1.26.1 (GOTOOLCHAIN=auto fetches Substrate's newer one)
Docker 29.2.1 with Buildx                     GKE 1.37.1-gke.2097000, Container-Optimized OS, kernel 6.18.53+, containerd 2.4.1
substrate-gke v1.0.0-gke.0                    Substrate v1.0.0 (b34fbee)       AX main eac8313 (2026-11-13), go.ate.dev/substrate v1.0.0
AX’s own installation guide still lists Substrate v0.6.0 as its development baseline, although its go.mod has moved to v1.0.0, so this combination is one the guide doesn’t certify. It worked.
Step 2: The cluster
The console can express this cluster: a Standard zonal cluster in us-central1-a, Rapid channel, 1.37, with Dataplane V2, Workload Identity and private nodes, and one node pool of two c3-standard-4 with 100 GB boot disks and no GKE Sandbox on the pool (its taint keeps Substrate’s worker pods off). I created it with the CLI so that it can be repeated, and used the console to look at it afterwards. Private nodes need Cloud NAT for anything that isn’t Google, and Private Google Access on the subnet so that Google APIs don’t use it. The script in the repo does all of that:
gcloud compute networks subnets update default --region us-central1 --enable-private-ip-google-access
gcloud compute routers create ate-router --network default --region us-central1
gcloud compute routers nats create ate-nat --router ate-router --region us-central1 \
  --auto-allocate-nat-external-ips --nat-all-subnet-ip-ranges --no-enable-logging
gcloud beta container clusters create ate-sbx --zone us-central1-a --release-channel rapid --cluster-version 1.37.1-gke.2097000 \
  --num-nodes 2 --machine-type c3-standard-4 --disk-type hyperdisk-balanced --disk-size 100 \
  --enable-dataplane-v2 --workload-pool=<project>.svc.id.goog --enable-private-nodes --enable-ip-alias \
  --no-enable-autoupgrade --no-enable-autorepair \
  --enable-kubernetes-unstable-apis=certificates.k8s.io/v1beta1/podcertificaterequests,certificates.k8s.io/v1beta1/clustertrustbundles
The cluster took 6 minutes 54 seconds, against 14 minutes 9 seconds for the EKS control plane. Two things I had to change from my first attempt, and the console form doesn’t warn about either:
- Disk quota. My project allowed 500 GB of
pd-balancedper region (it counts against the SSD quota; Google says quotas differ by project), and Substrate’s PostgreSQL asks for a 500 GiB volume of exactly that type. With twopd-balancedboot disks the volume would not fit, so I made the boot diskshyperdisk-balanced, and put AX’s 10 GiB PostgreSQL on ahyperdisk-balancedStorageClass too. A quota request needs a contact email, so I worked around it. - The control plane address. My first cluster had authorized networks on and the DNS endpoint off for outside traffic, so
kubectltimed out. The installer’s own clusters are DNS-endpoint only; I ended with the public endpoint limited to my laptop’s address, which also gave the most stable client path (Test 3).
Step 3: What the installer does, run by hand
The installer is an interactive terminal program, and it needs a terminal. I ran what it runs, step by step, from the same repo at the same tag. bootstrap took 10 minutes 10 seconds, mostly a control-plane update that turns the beta certificate APIs on, and it creates the snapshot bucket and a second -assets bucket, the ate-snapshot-transfer service account, an Artifact Registry repository, the IAM bindings and three Monitoring dashboards:
go -C tools/setup-gcp run . bootstrap                                  # 610 s
go run ./cmd/ate-setup deploy ate-system --image-repo ghcr.io/agent-substrate/substrate --image-tag v1.0.0   # 84 s, 63 s on the rerun
ate-setup printed no allowlist or eligibility message at any point. All of ate-system was ready, including the two ate-api-server replicas, the router, the egress gateway and the atelet on each node. Two details the install pages don’t make obvious:
- The router allowlist decides who can call an actor. The wizard asks for the SPIFFE IDs of your clients and the installer’s README says
kubectl ate“needs no entry”, butkubectl ate proxy actor, which goes through the router, presented the identityns/ate-system/sa/atenet-clientand gotremote error: tls: unknown certificateuntil I added it. AX’s server needsns/ax-system/sa/ax-serverthere, andATE_API_AUTHZ_BOOTSTRAP_OWNERSfor the API itself. - AX sets no
workerSelector. Any WorkerPool in the cluster hosts AX tasks. When I left Substrate’s Counter demo pool (three workers) installed, AX tasks landed on it, and the density numbers below jumped from 6 to 9 tasks at the default size. I deleted the demo pool for every measured run.
Then the WorkerPool (two gVisor workers, one per node, the same manifest as on EKS but ate.dev/v1, since v1alpha1 is no longer served), and AX’s server and PostgreSQL:
./03_workerpool.sh     # 7 s to 2 of 2 ready (13 s on the rerun)
./04_ax.sh             # make images 42 s (13 s warm), ax-server about 30 s
Step 4: Readiness and the smoke test
The EKS install post checked three things before installing, and all three pass on GKE: certificates.k8s.io serves v1 (and v1beta1) with ClusterTrustBundle and PodCertificateRequest; a server-side dry run of a pod with a projected podCertificate volume is accepted; and the nodes’ kernel, 6.18.53+, is above 6.8. They take 3 seconds. A first task from an empty cluster, through the AX CLI’s own tunnel, took 3.9 s to create, 5.6 s to resume, 12.2 s for the first ssh and 1.2 s to delete, and reported 4.19.0-gvisor on a 6.18 node, the same as on EKS. Those timings include a cold image pull and tunnel setup; Test 3 has the steady ones.
Testing
The harness is the one from the EKS posts, ported: ax and kubectl ate calls timed with time.perf_counter(), nearest-rank percentiles, a kubelet sampler, each test on an otherwise empty cluster. EKS numbers below are from my earlier runs, once each, like these. A single run each means small differences are noise.
Test 1: Install and the native Counter demo
The timings are above; the new thing on GKE is the demo the EKS series never ran. ate-setup deploy demo counter builds the demo image with ko, pushes it to Artifact Registry and creates a WorkerPool and an actor template whose snapshot fidelity is SNAPSHOT_FIDELITY_MEMORY. It took about 70 seconds. An actor from that template counts three things on each request: in process memory, in a file on a durable volume, and in the root filesystem. Through kubectl ate proxy actor, after one suspend, the next request returned preserved memory count: 3 | preserved file counter: 3 | preserved rootfs counter: 3: the in-memory counter continued. Five suspend and resume cycles through kubectl ate took 1.41 s and 1.34 s at the median from my laptop (Test 2), but a no-op kubectl ate get atespace takes 1.24 s, so those are almost all round trip. Test 4 has the in-cluster number.
Test 2: What a suspend keeps, AX against native
The EKS post said AX asks Substrate for a volumes-only snapshot and that “Substrate can snapshot memory; AX doesn’t ask it to”. I tested that on GKE. The same probes ran in an AX task and in a native actor made from an AX task-runner image with memory fidelity. Each writes /tmp/marker, a 50 MB file in /workspace, starts a background sleep 3000, and holds a plain HTTP keep-alive connection to www.google.com open through the egress gateway, then goes through five suspend and resume cycles.
| After a suspend and resume | AX task (volumes) | Native actor (memory) |
|---|---|---|
/workspace file | kept, checksum intact | kept |
/tmp/marker | gone, every cycle | kept |
Background sleep 3000 | gone | still running |
| Process and uptime | restarted: up 8 s, one boot line per resume (6 for 1 create and 5 resumes) | continued: uptime kept counting, one start line in total |
Open connection to www.google.com | gone (its process is gone, the log stops growing) | broken: the next write failed |
| Suspend and resume from the laptop | 583 / 631 ms median (n=5) | 1.41 / 1.34 s (n=5, a 1.24 s no-op floor) |
So memory fidelity is the difference, and it is a template setting, not a platform property. Neither path preserves an open connection: the native actor’s process is the same one, but the next write on its socket failed, which fits Google’s docs, that open connections “aren’t preserved when an agent suspends”. An agent that holds a connection (a database session, a streaming call) has to reconnect after a resume.
Test 3: Lifecycle timings
The EKS numbers in brackets. Five tasks each, through a steady port-forward (see the next paragraph).
| Operation | GKE median (min to max) | EKS |
|---|---|---|
| Create | 526 ms (503 to 569) | 684 ms |
| First resume | 2,617 ms (2,614 to 2,624) | 2,780 ms |
| Suspend | 595 ms (583 to 604) | 820 ms |
| Resume | 634 ms (622 to 674) | 817 ms |
A default task is 2 CPUs and 524,288 kB of memory as seen from inside (nproc 2, MemTotal), and with limits of 2 CPU and 2Gi it is 2,097,152 kB, both identical to EKS. The kernel is 4.19.0-gvisor.
The first version of this table was wrong. Through the AX CLI’s own tunnel (a kubectl port-forward it starts and reuses), about one call in ten took 3 seconds longer than the rest, and an occasional call failed with error reading server preface. A suspend of 3.9 s next to a resume of 1.0 s in the same cycle was the tunnel, not Substrate. It was worse through the DNS endpoint. I ended with a supervised port-forward and AX_SERVER=localhost:18080, after which a no-op ax get tasks took about 0.5 s with no spikes (median 490 ms over 10 calls). Everything from here on uses it; that round trip, from my laptop to us-central1, is in every client-side number.
Test 4: Wake on request through the router
The AX networking docs say the router “resumes it first if it was suspended”. A pod running as the ax-server service account, with a pod certificate, sent curl -H 'ate-target-actor: <atespace>/<name>' https://atenet-router.ate-system.svc/readyz to a suspended task, timed by curl from inside the cluster:
- AX task: HTTP 200 in 119.2 ms and 119.9 ms (EKS 100.9 and 103.5 ms; an earlier run of mine measured about 140 ms), and the task is
Runningafterwards. - Native memory-fidelity actor: HTTP 200 in 314.1 ms for the first wake and 119.4 and 107.2 ms for the next two. That is the “sub-500ms” resume Google describes, for the path it describes, at 1 CPU.
- Negatives: no
ate-target-actorheader gives 404 in 7.8 ms, and no client certificate makes curl exit 55. - The router Service exposes 443 and 8444 only. AX’s networking page shows a port 80 path; GKE, like EKS, has none.
Test 5: Snapshots in Cloud Storage
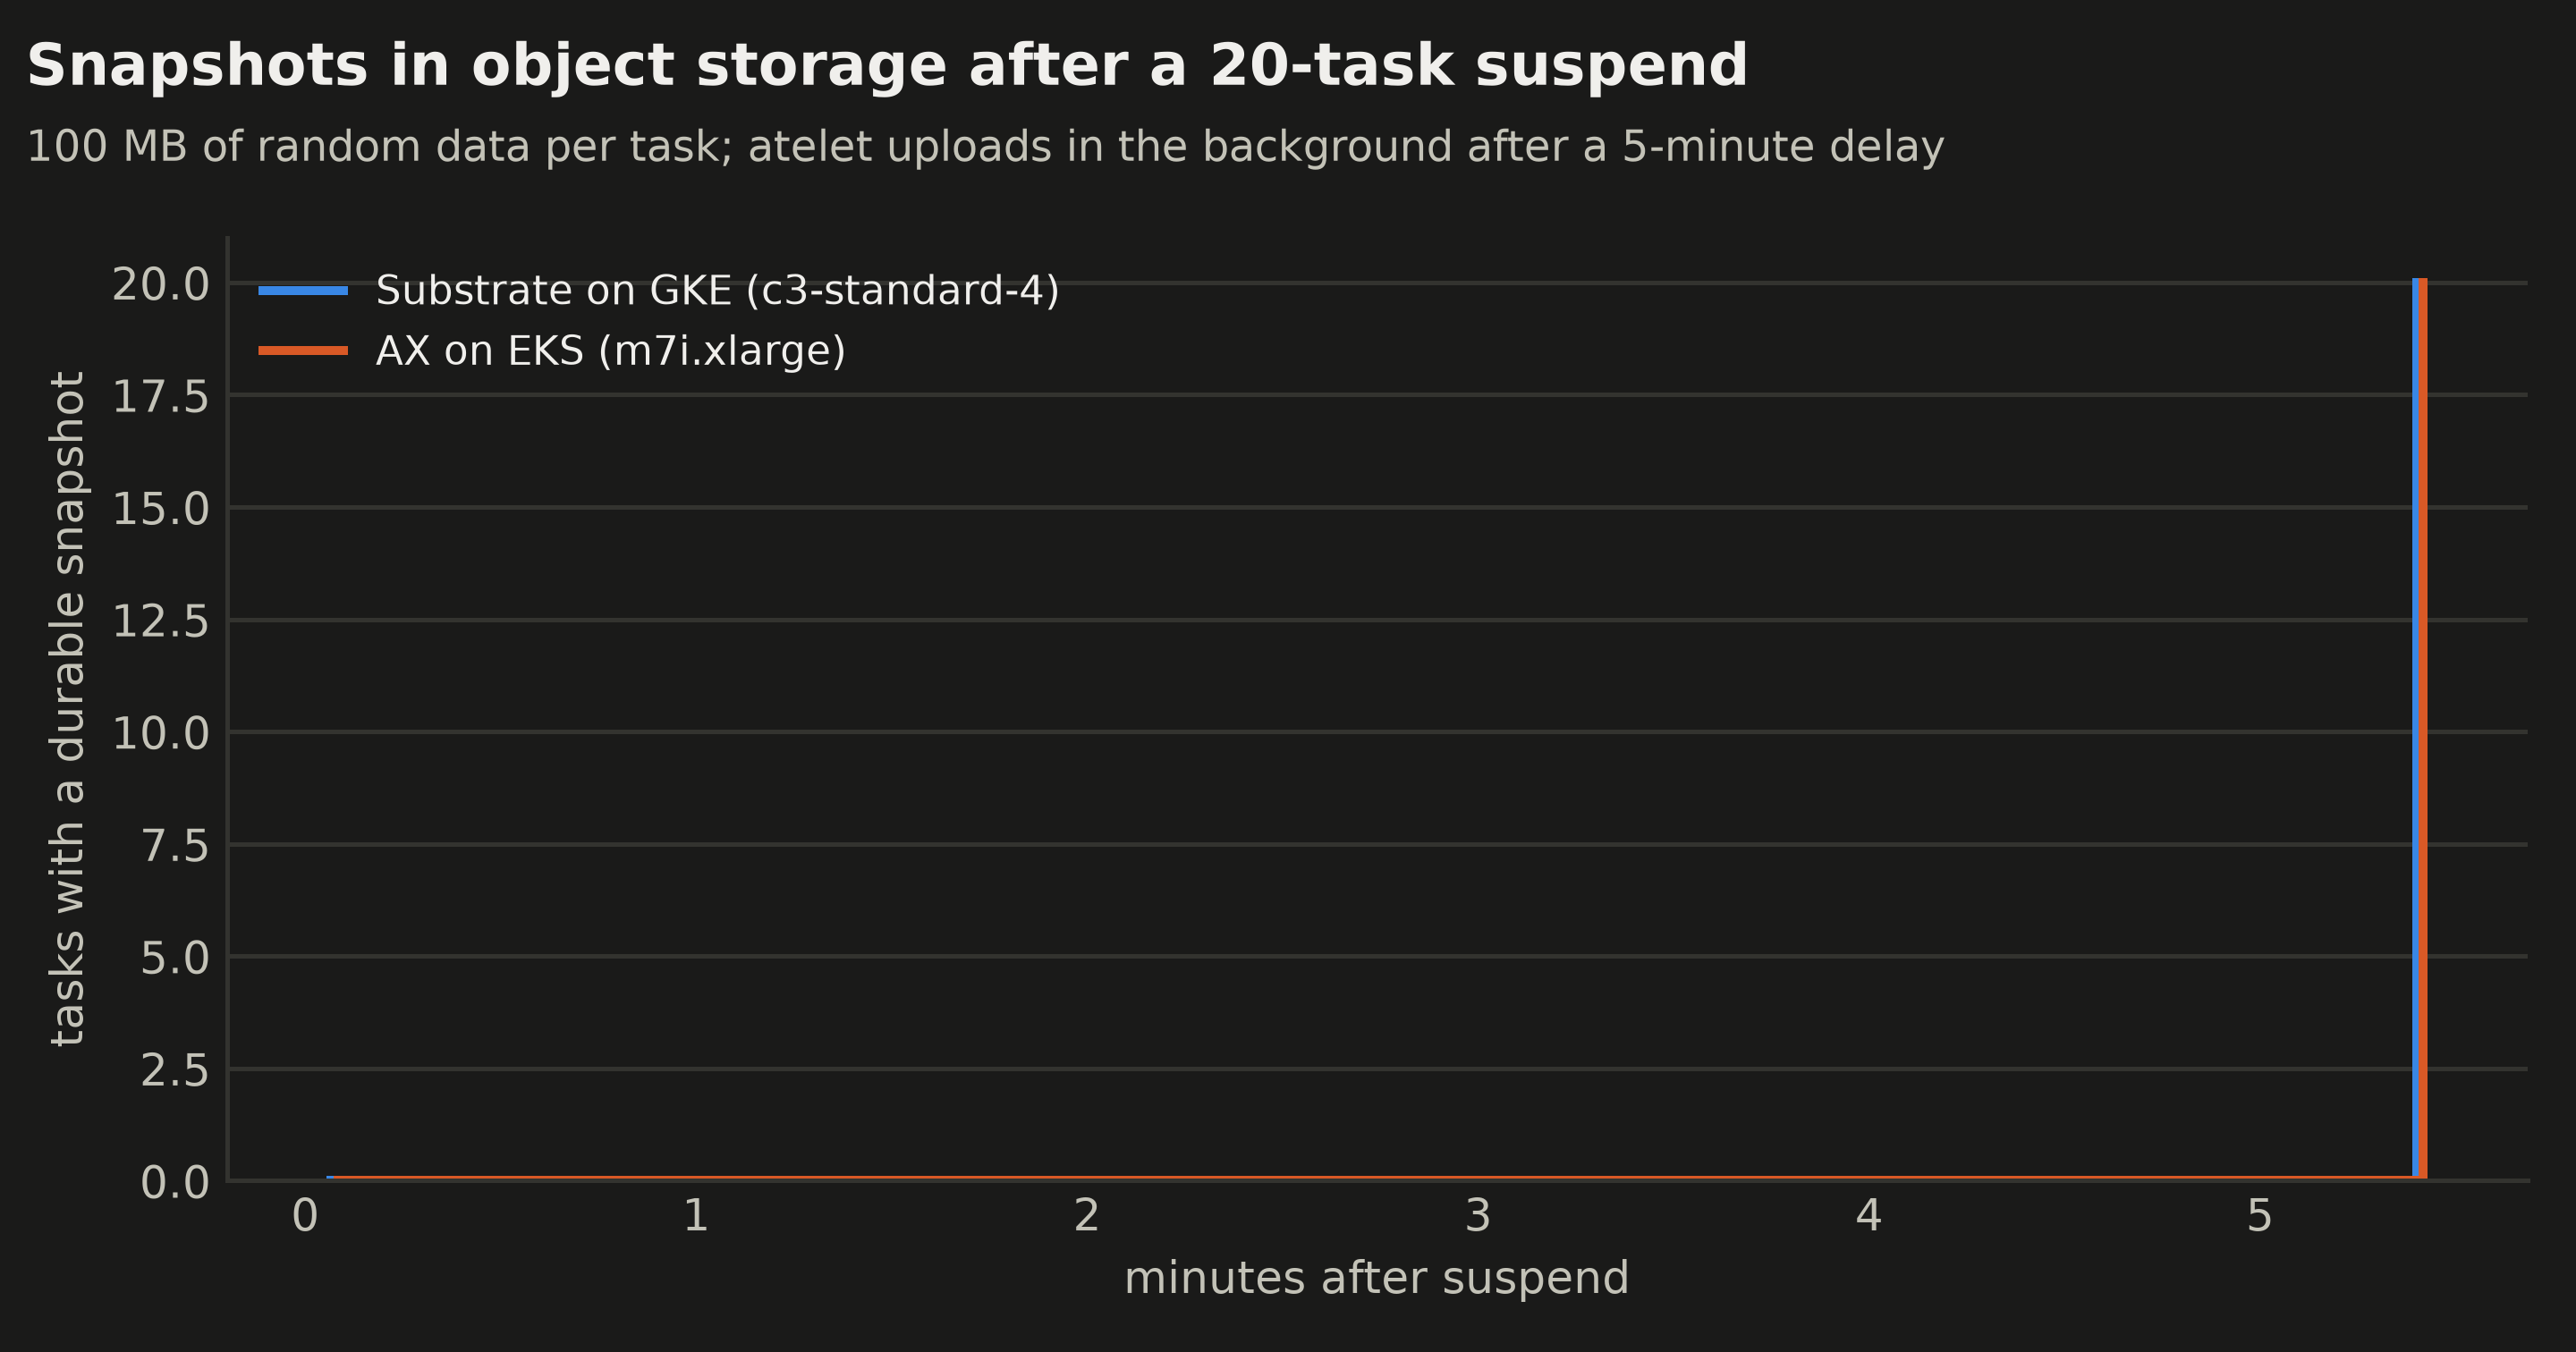
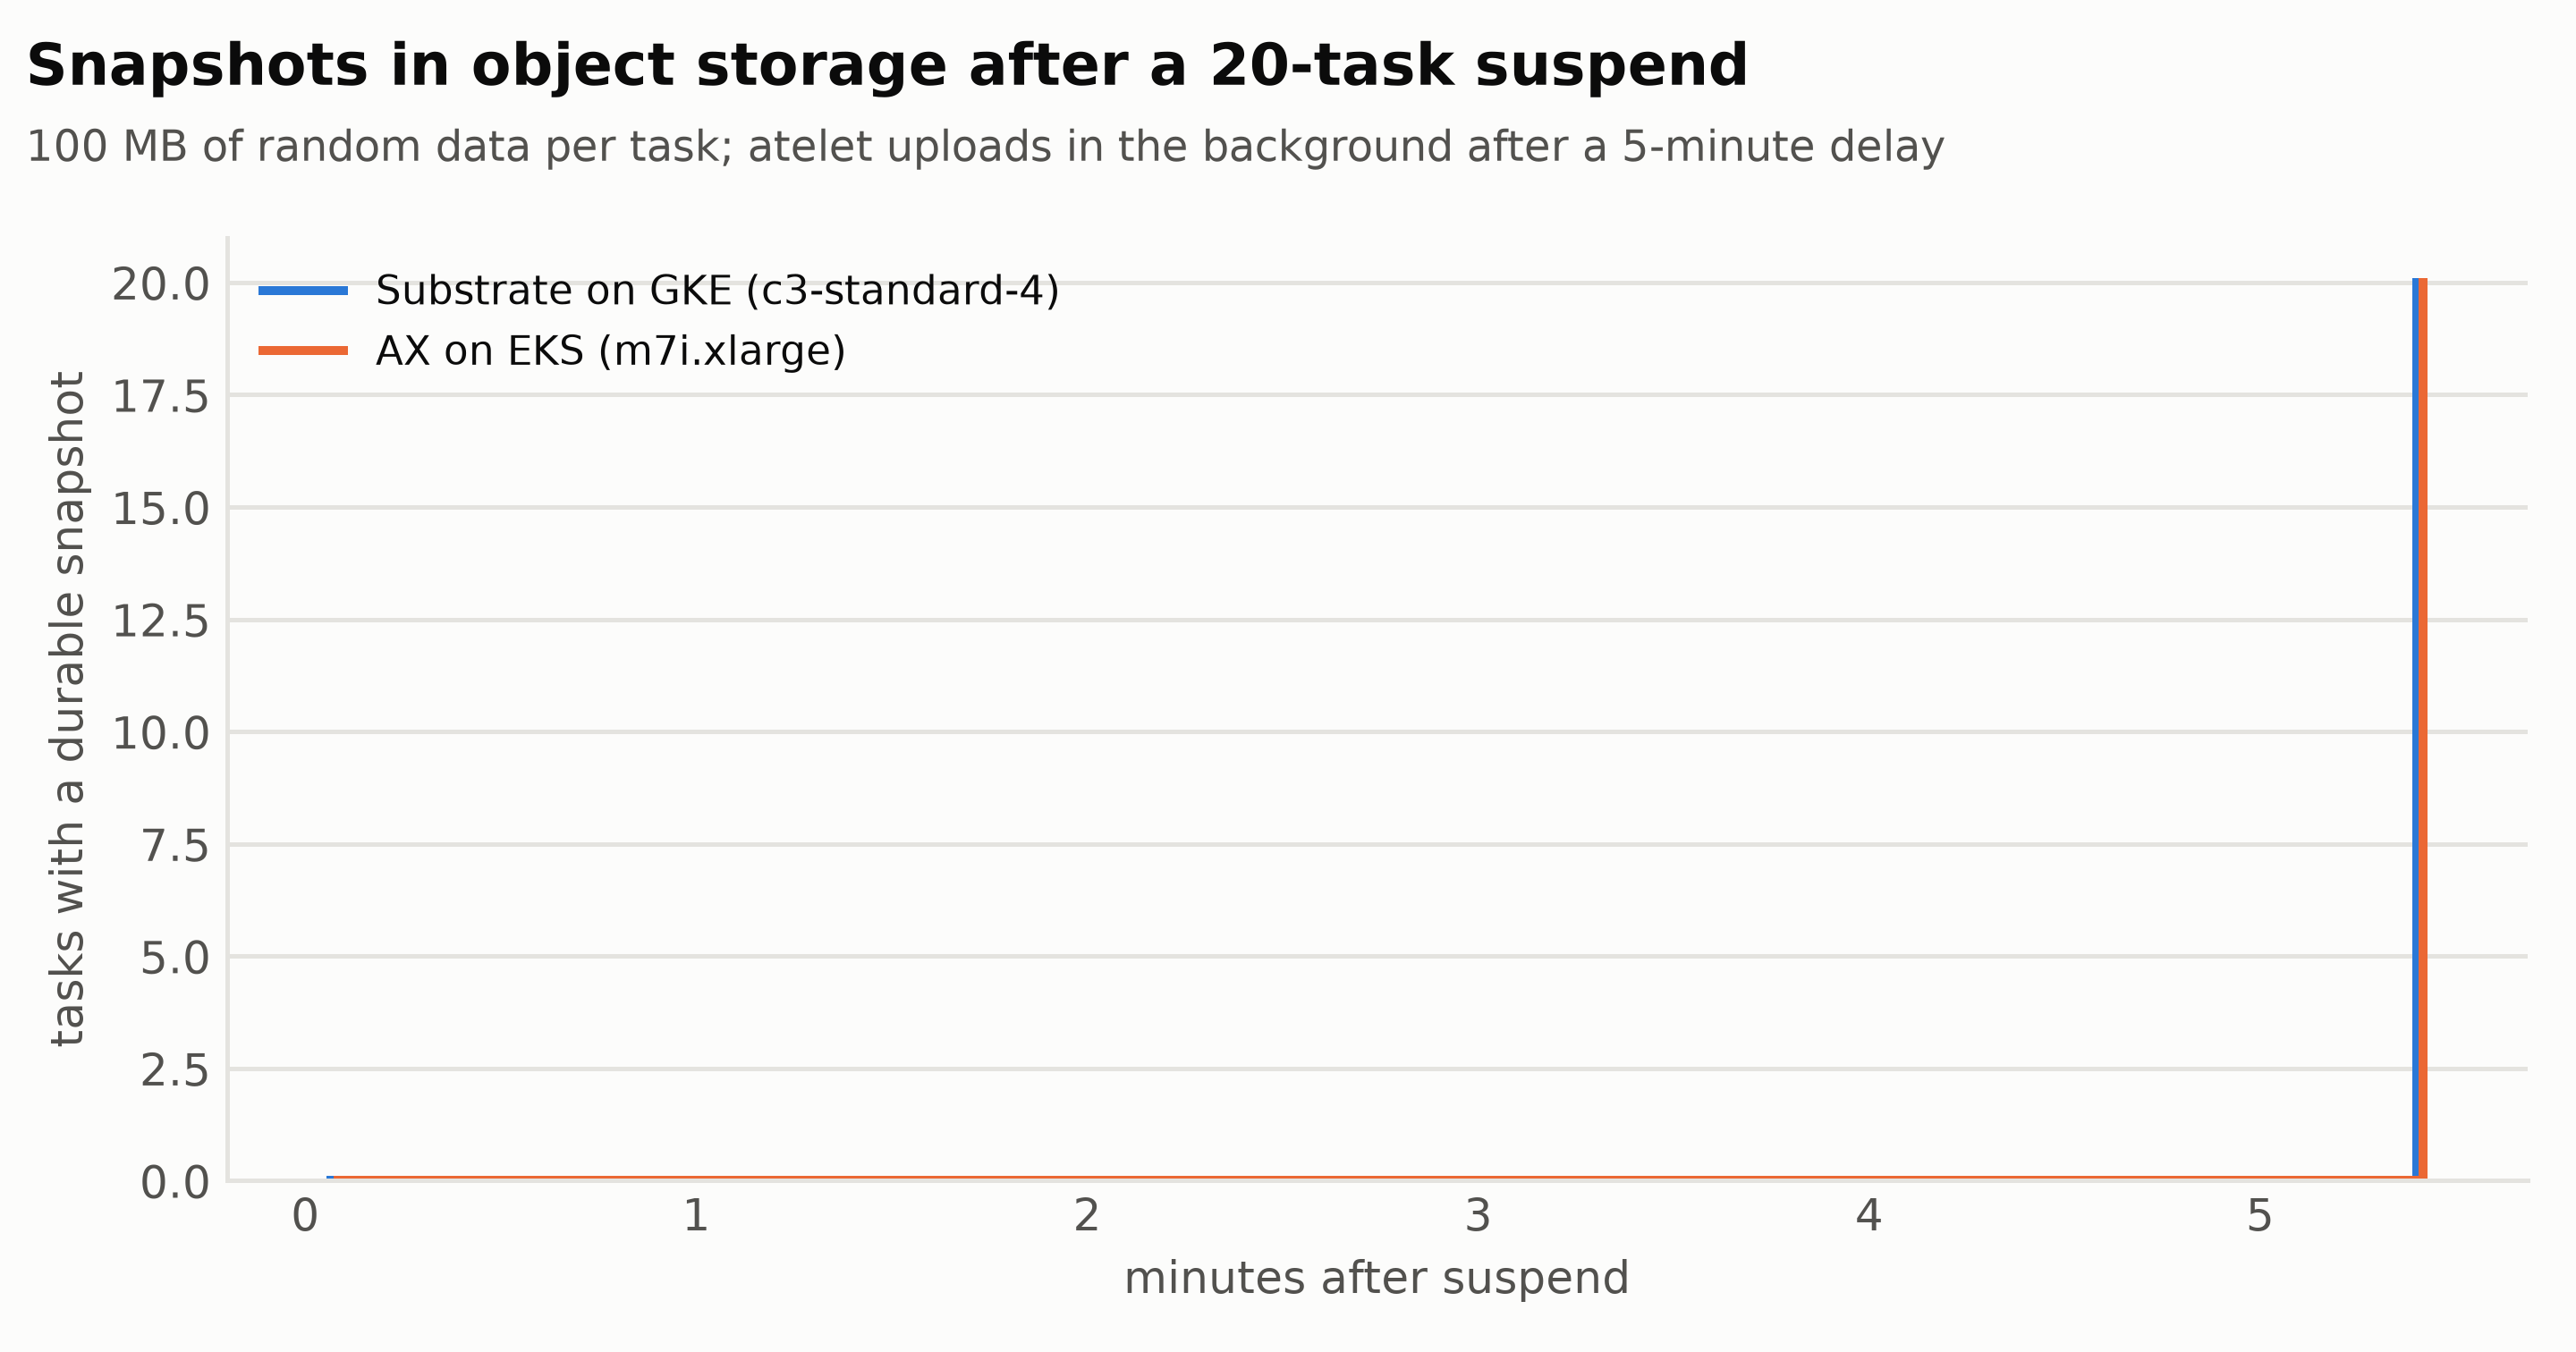
Substrate’s suspend returns quickly and uploads in the background after a delay, 5 minutes by default. I wrote 100 MB of random data and 100 MB of zeros, suspended, and polled the actor’s record:
+    2s  durable copy: PENDING    local copy on: <node>
+  324s  durable copy: COMPLETED  local copy on: <node>
+ 1807s  durable copy: COMPLETED  local copy on: none (detached)
The upload completed 324 seconds after the suspend and the node’s local copy was detached at 1,807 seconds, against 324 and 1,801 on EKS: Substrate’s defaults, a 5-minute upload delay and a 30-minute detach delay, are unchanged on GKE. The object is 104.9 MB in five files (pages.img.zstd carries nearly all of it; the zeros compress away), the same size as on EKS. Resuming with the local copy detached took 1,724 ms in this run (2,305 ms in an earlier one, EKS 1,623 ms) and both files verified. In that earlier run my poll read the actor’s record through a flaky client call and printed “detached” at 356 seconds; the harness now skips a read that returns nothing, and I repeated the test.
A 2 GB workspace (four 512 MB random files) suspended in 14.3 s at the median (10.4 to 17.8 s, EKS 15.5 s) and resumed in 1,004 ms (EKS 875 ms), all bytes intact in three cycles. The docs say every snapshot transfer runs on a token scoped to its actor, issued by ate-api-server and impersonating the ate-snapshot-transfer service account that bootstrap creates, so the audit logs name that account. I verified that the account and the grants exist, not the exchange itself: at the default log level I found no line for it.
Test 6: Density
Substrate books each sandbox’s CPU and memory limits against its worker’s capacity, which for a pool with no declared capacity is the node’s allocatable: 3,920m CPU on both clouds, and 14,073,824 Ki of memory here against about 15 million on EKS.
| Wave | Running | Refused | Resume median |
|---|---|---|---|
| 12 tasks, default (1 CPU, 512 MiB) | 6 (3 per worker) | 6 | 4,561 ms, 2,783 ms in the recorded run (EKS 2,862) |
| 40 tasks, 250m / 256Mi | 30 (15 per worker) | 10 | 3,197 ms, 2,890 ms in the recorded run (EKS 2,951) |
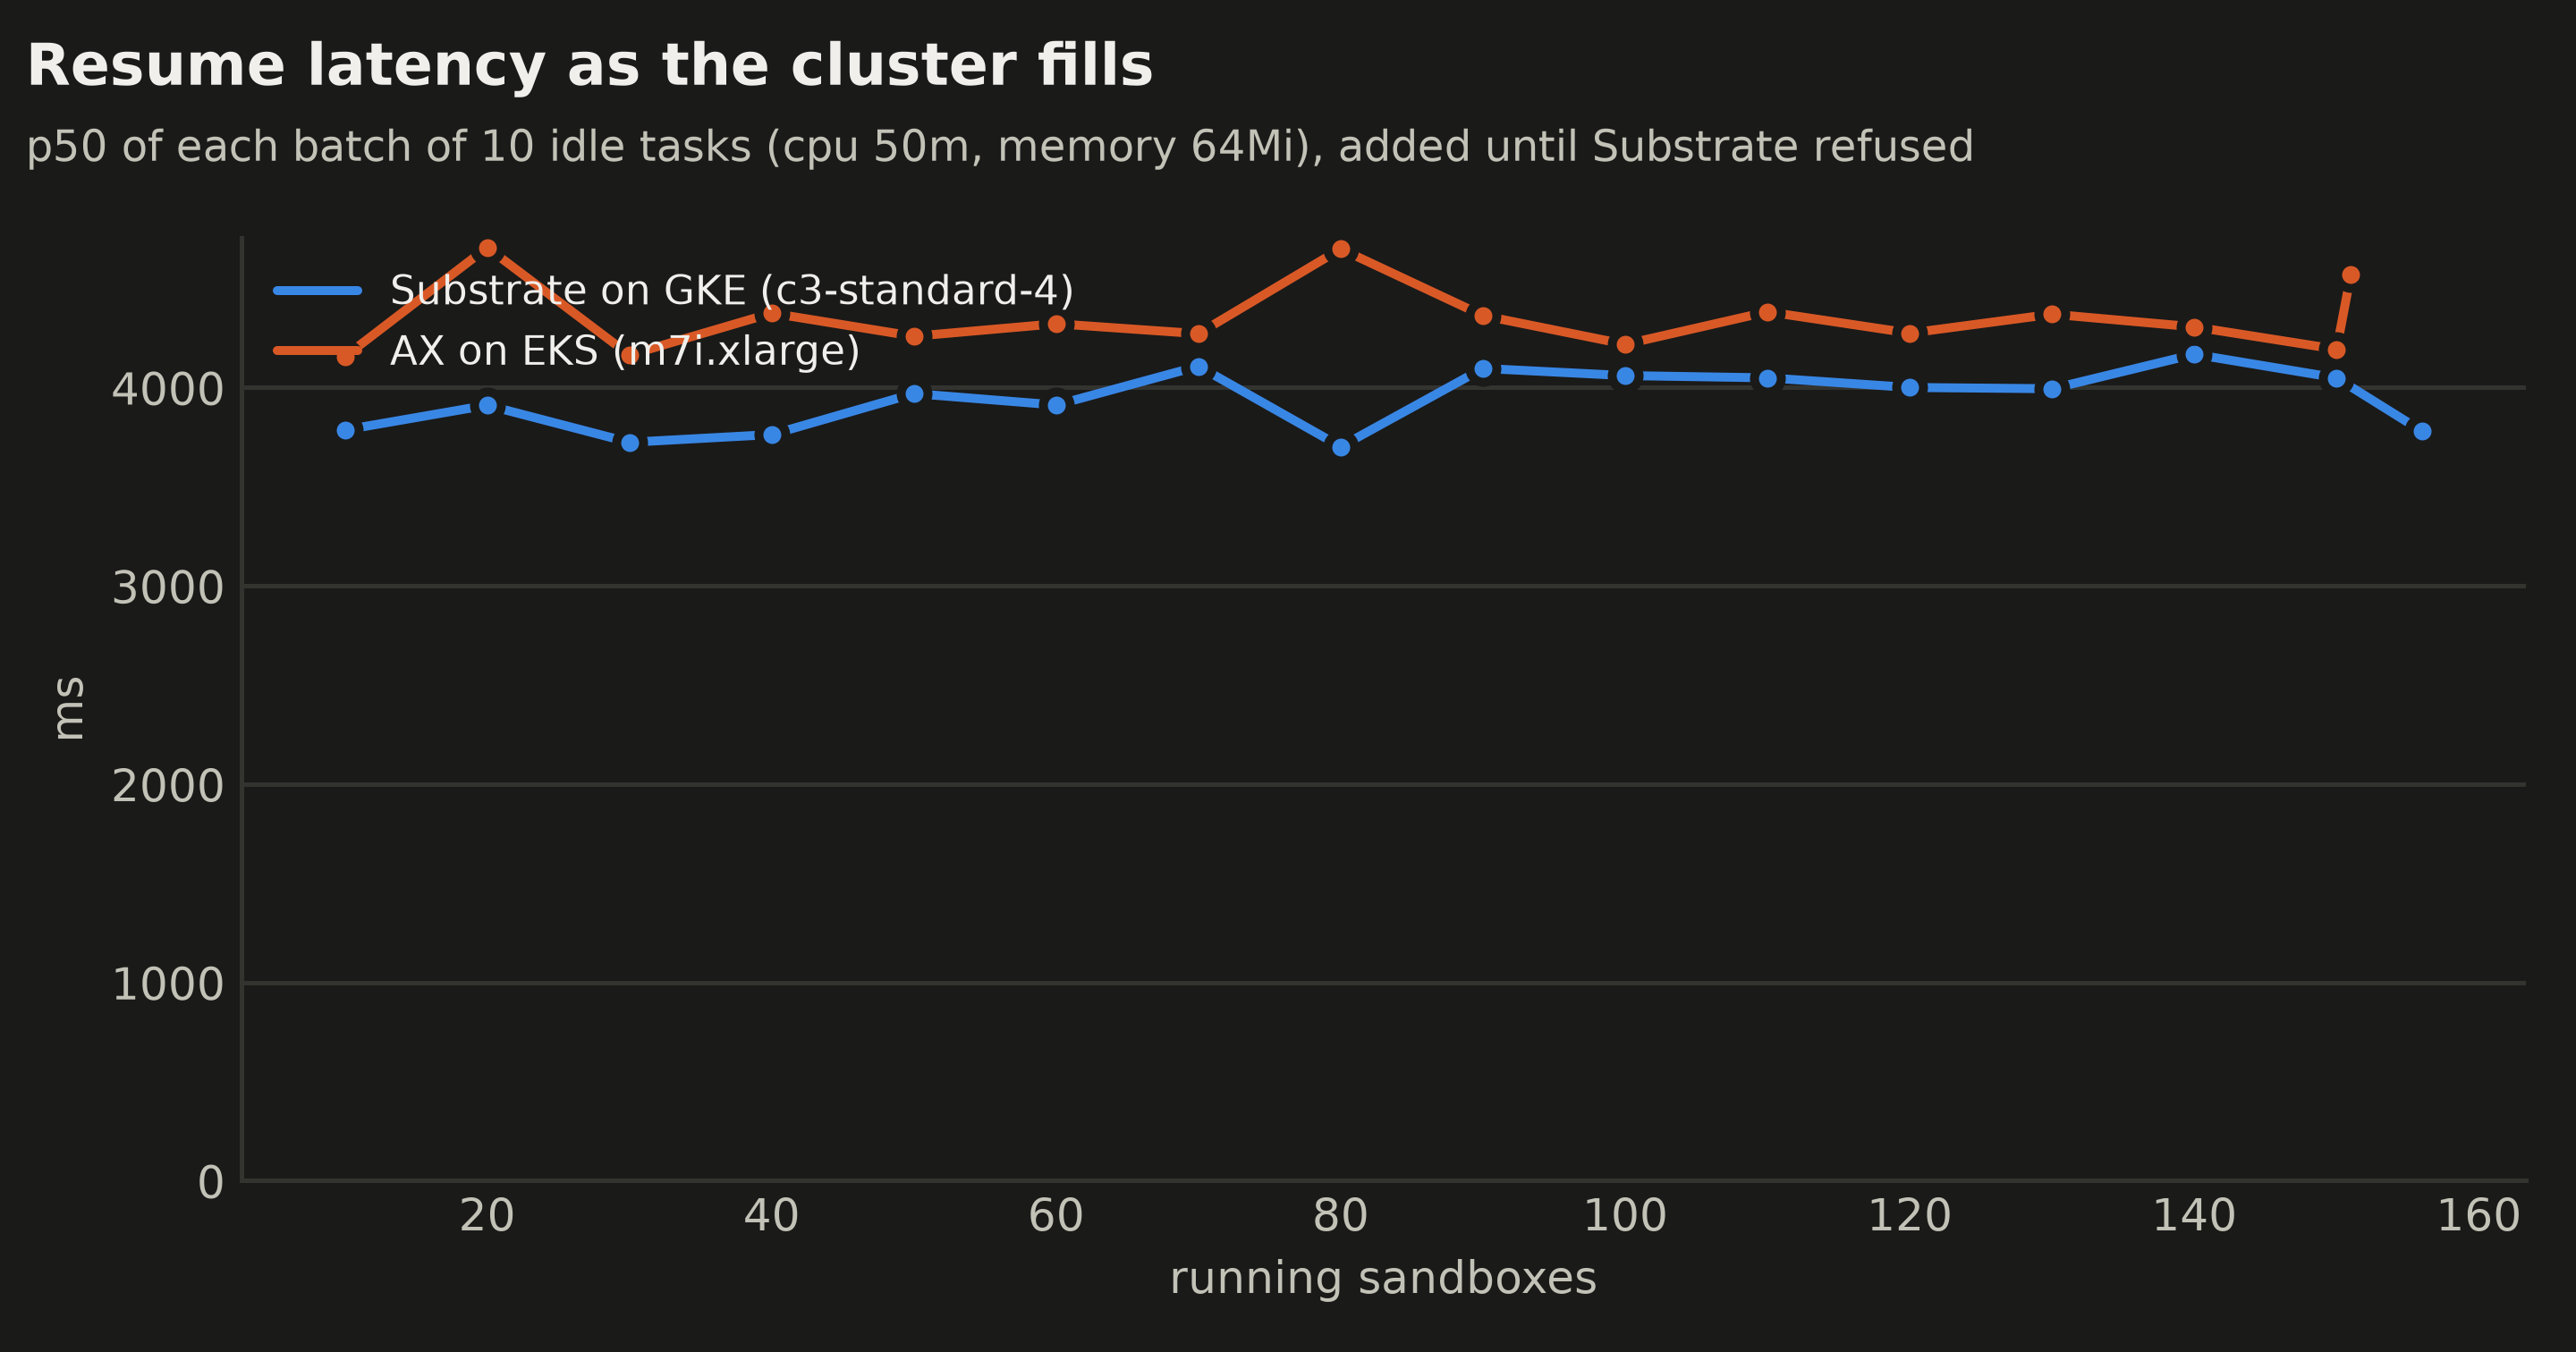
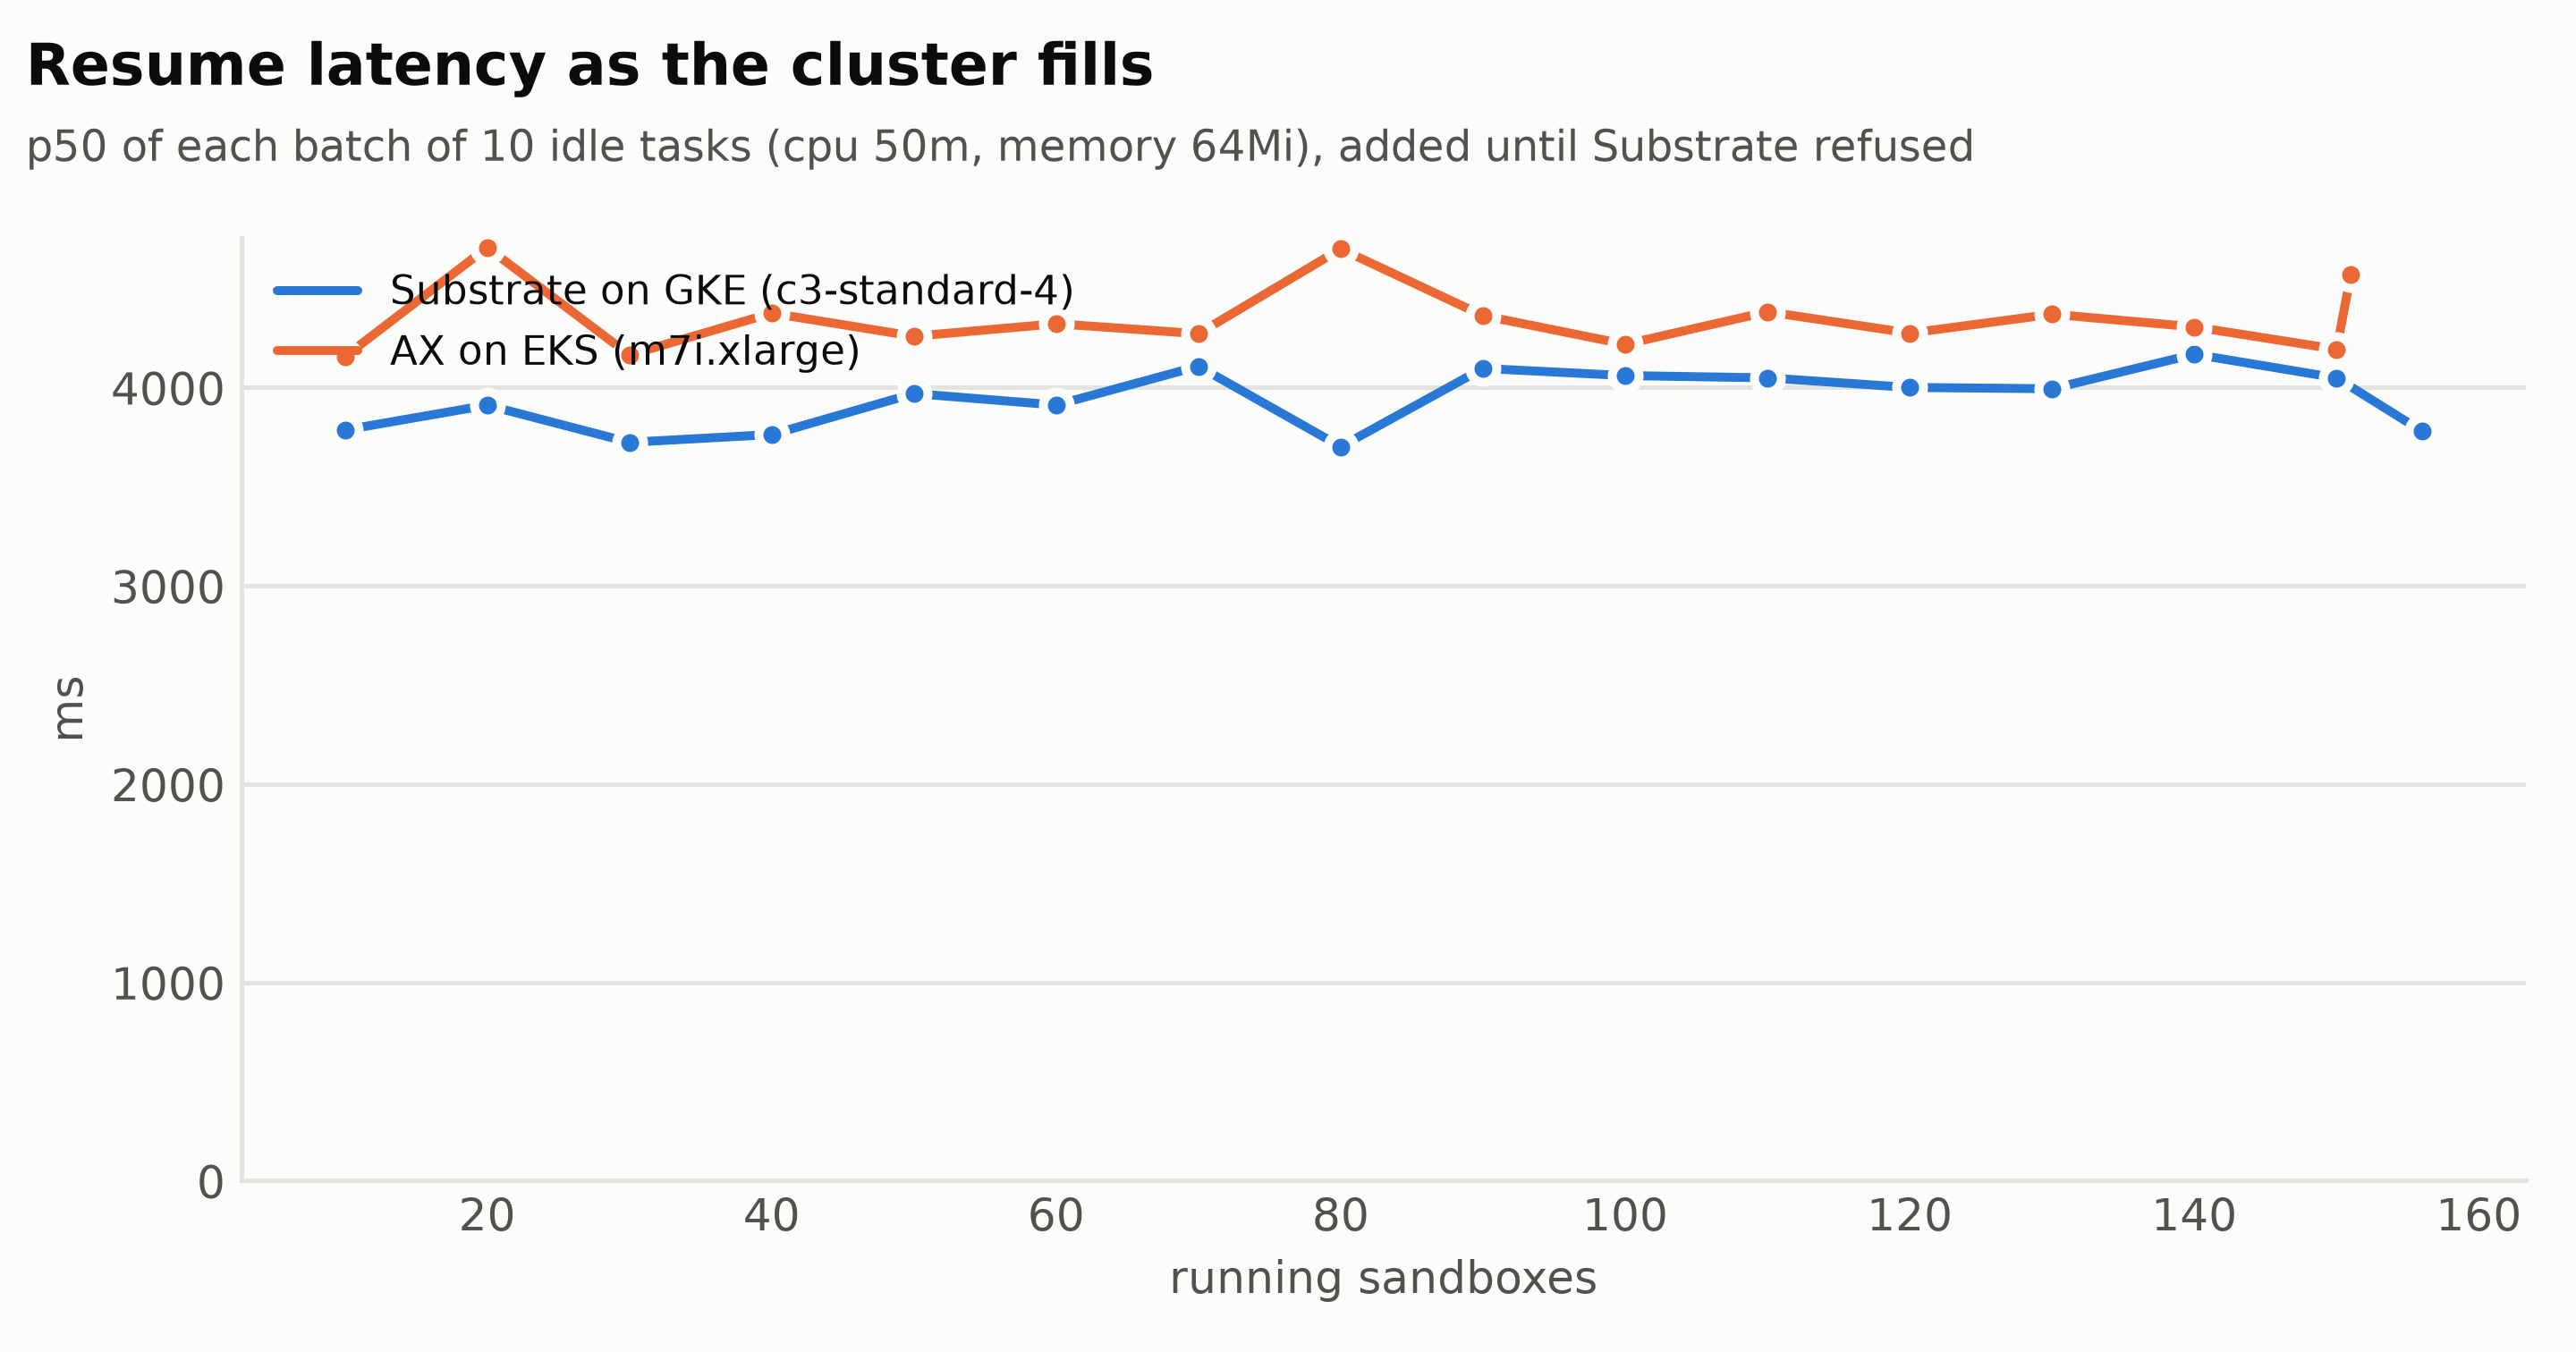
| Ramp at 50m / 64Mi, batches of 10 | 156 | the next batch | p50 3,910, p95 4,324, p99 4,585 ms (EKS p50 4,286) |
The refusal is the same no worker has room for the actor, and the first two rows are the same counts as on EKS: 6 and 30. The ramp ended at 156, against 151 on EKS. Substrate v1.0.0 says it books per-actor runtime overhead, which I expected to lower the ceiling, and I saw no effect. At 156 the nodes held 3.1 and 2.9 GiB, against 2.3 and 2.0 with the first 10 running, which is about 12.6 MiB per additional idle sandbox (EKS: about 13).
Google’s two density figures, “over 1,000 dormant agents per host” and the docs’ “approximately 800 concurrent sandboxes per node” before kernel tuning, are for suspended actors, which hold no worker capacity. What I counted is running sandboxes, and two 4 vCPU nodes top out near 150 at the smallest size, because booked CPU is 50m each. The kernel sysctls the docs say you need above about 800 are the ones I set on the pool.
Test 7: Latency under concurrency and control-plane load
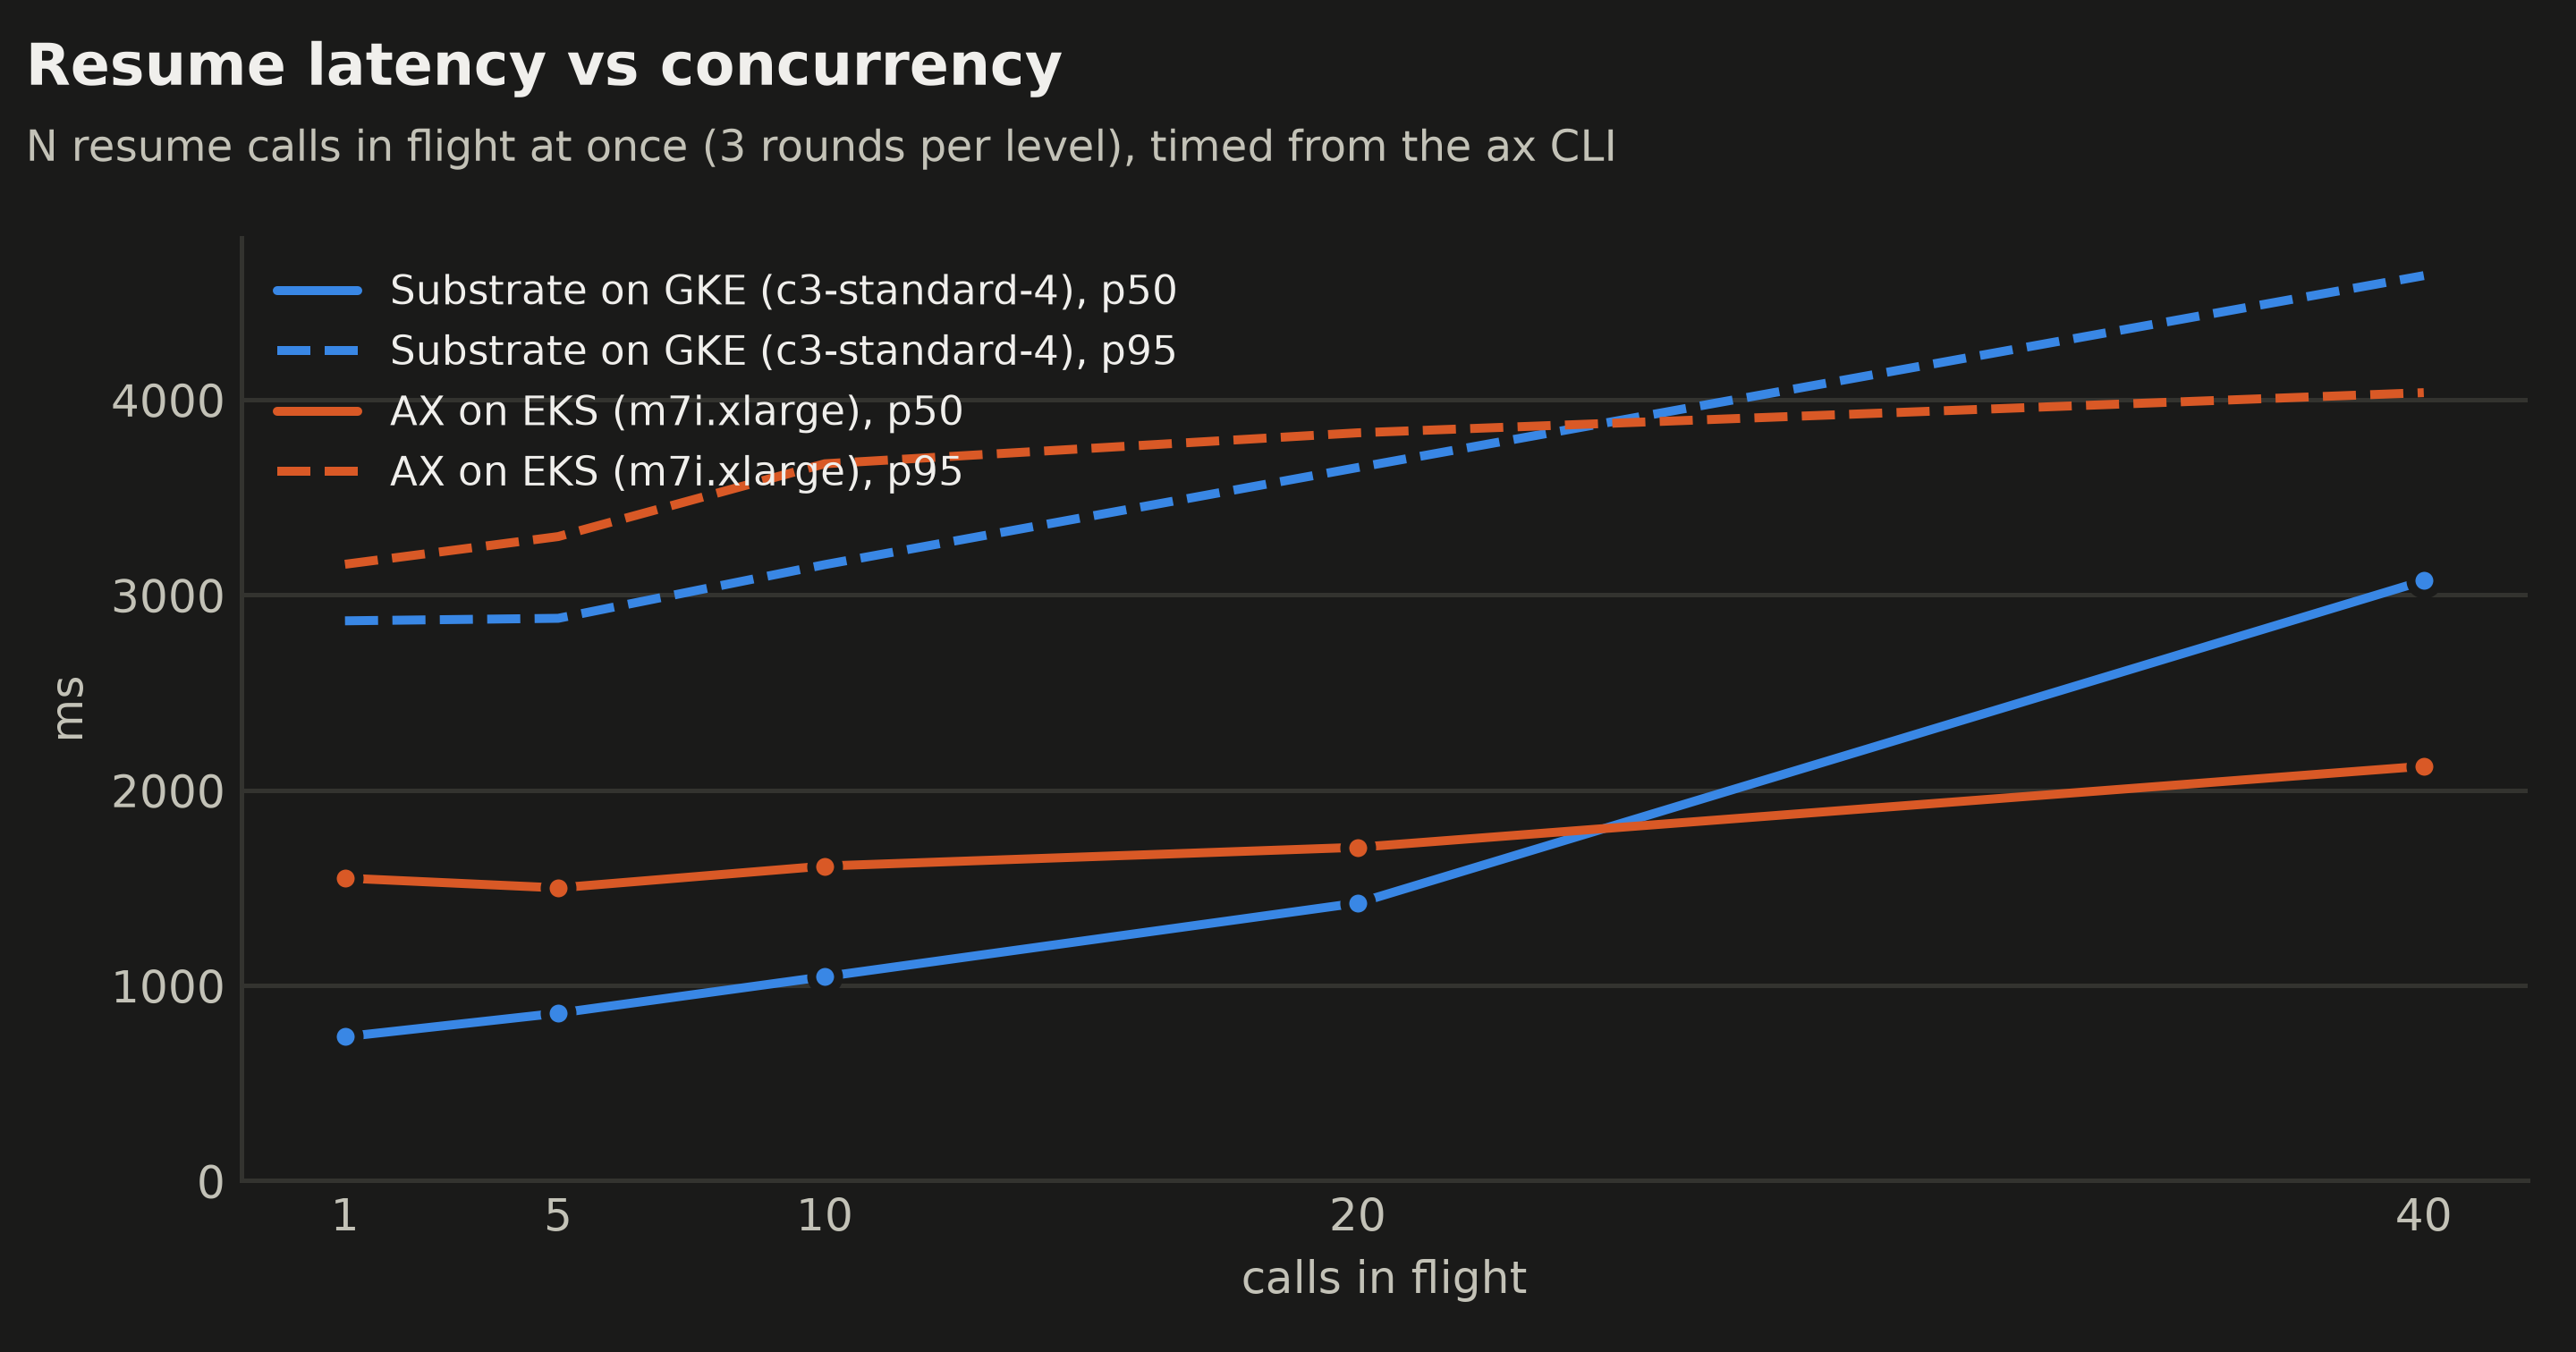
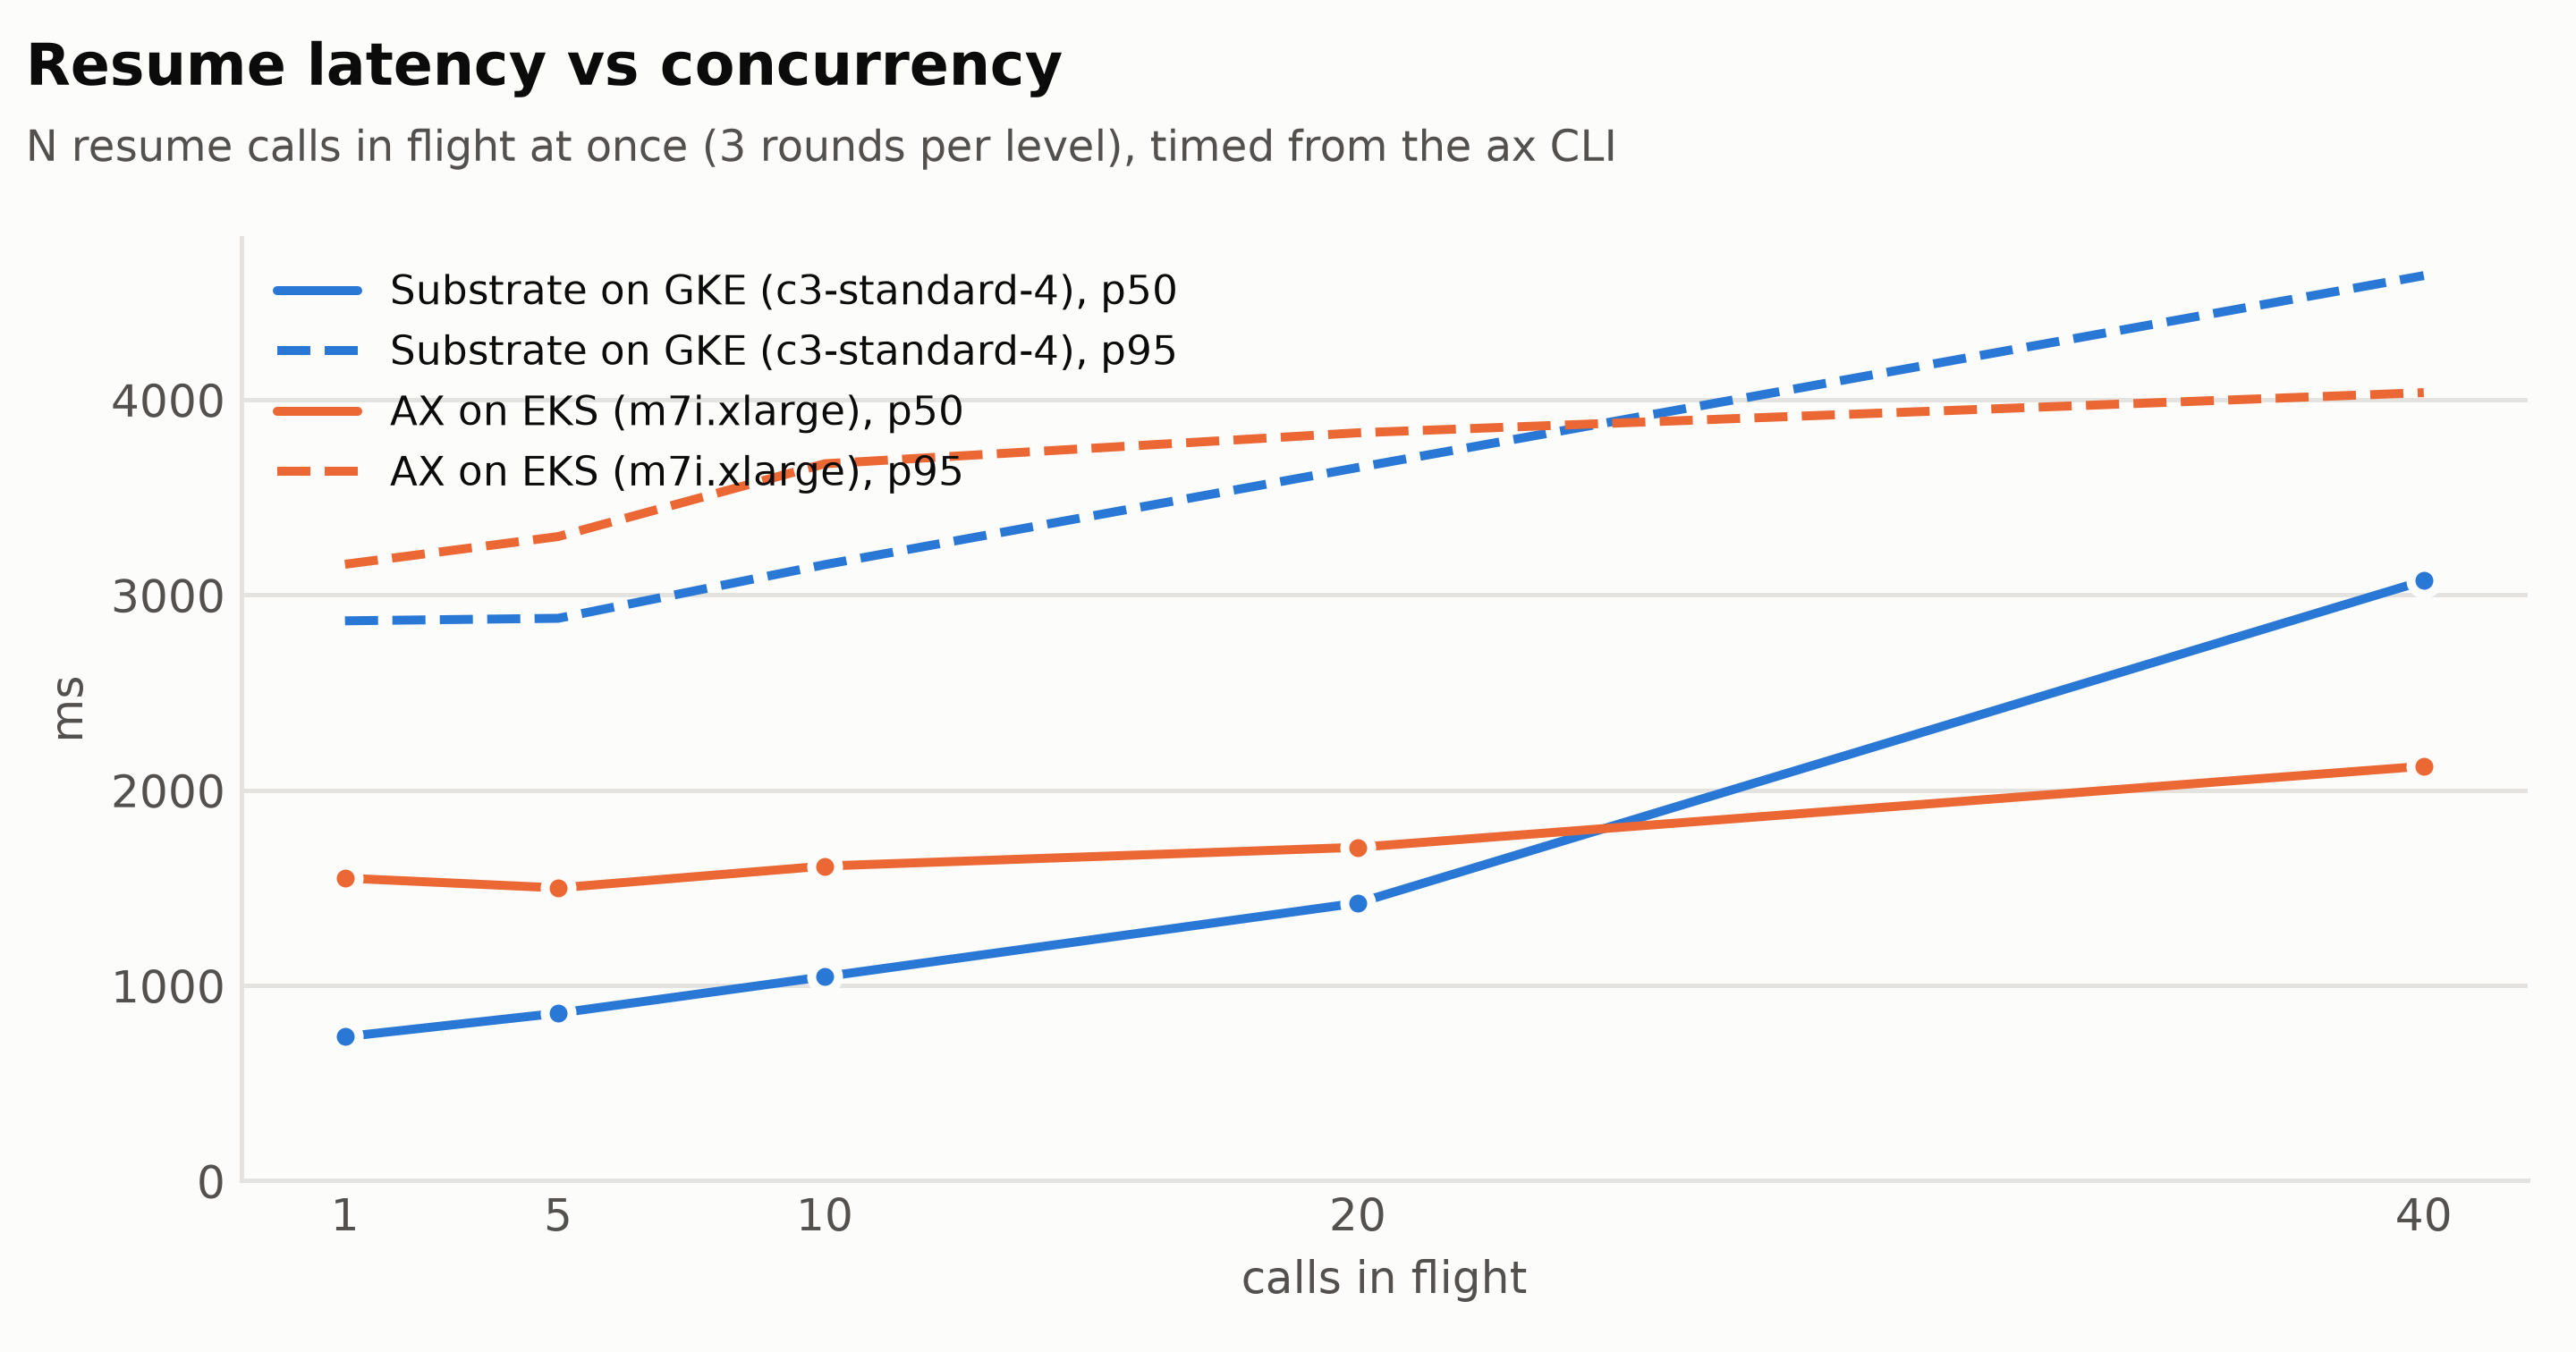
N calls in flight at once, three rounds per level, at 100m / 128Mi. Medians, with EKS in brackets:
| In flight | Create | Resume | Suspend |
|---|---|---|---|
| 1 | 519 (708) | 738 (1,550) | 568 (770) |
| 5 | 536 (718) | 858 (1,500) | 614 (812) |
| 10 | 552 (726) | 1,045 (1,612) | 677 (862) |
| 20 | 652 (746) | 1,422 (1,707) | 804 (1,029) |
| 40 | 889 (758) | 3,072 (2,123) | 1,175 (1,175) |
GKE was faster through 20 in flight and slower at 40, where resumes climbed to 3.1 s at the median and 4.6 s at p95 (EKS 2.1 and 4.0 s). The first resume of each task is slower than later ones, as on EKS: it boots the template’s golden snapshot, so the p95 includes it. With zero errors at every level.
The control-plane test creates, resumes, suspends and deletes 120 tasks with 20 in flight:
| Phase | Wall time | Throughput | p50 (EKS) |
|---|---|---|---|
| Create | 4.0 s | 29.7/s (EKS 26.4) | 580 ms (728) |
| Resume | 27.4 s | 4.4/s (EKS 3.0) | 4,352 ms (6,305) |
| Suspend | 7.8 s | 15.4/s (EKS 19.7) | 1,135 ms (920) |
| Delete | 4.3 s | 28.1/s (EKS 22.4) | 682 ms (848) |
No failures. The peak CPU of the busiest pods: ate-api-server 352m (during creates), atelet 243m, Substrate’s PostgreSQL 165m, ax-server 63m and AX’s PostgreSQL 19m, and the four I tracked on EKS summed to a peak of 599m, about 0.6 of one core (EKS: about 0.5). The conclusion repeats: on two nodes the sandboxes, not the API, set the throughput. Resume is slow because each one boots a runner under a CPU limit; Google’s 500 activations per second would need far more than 8 vCPUs.
Test 8: Wake time by CPU limit, and bursts
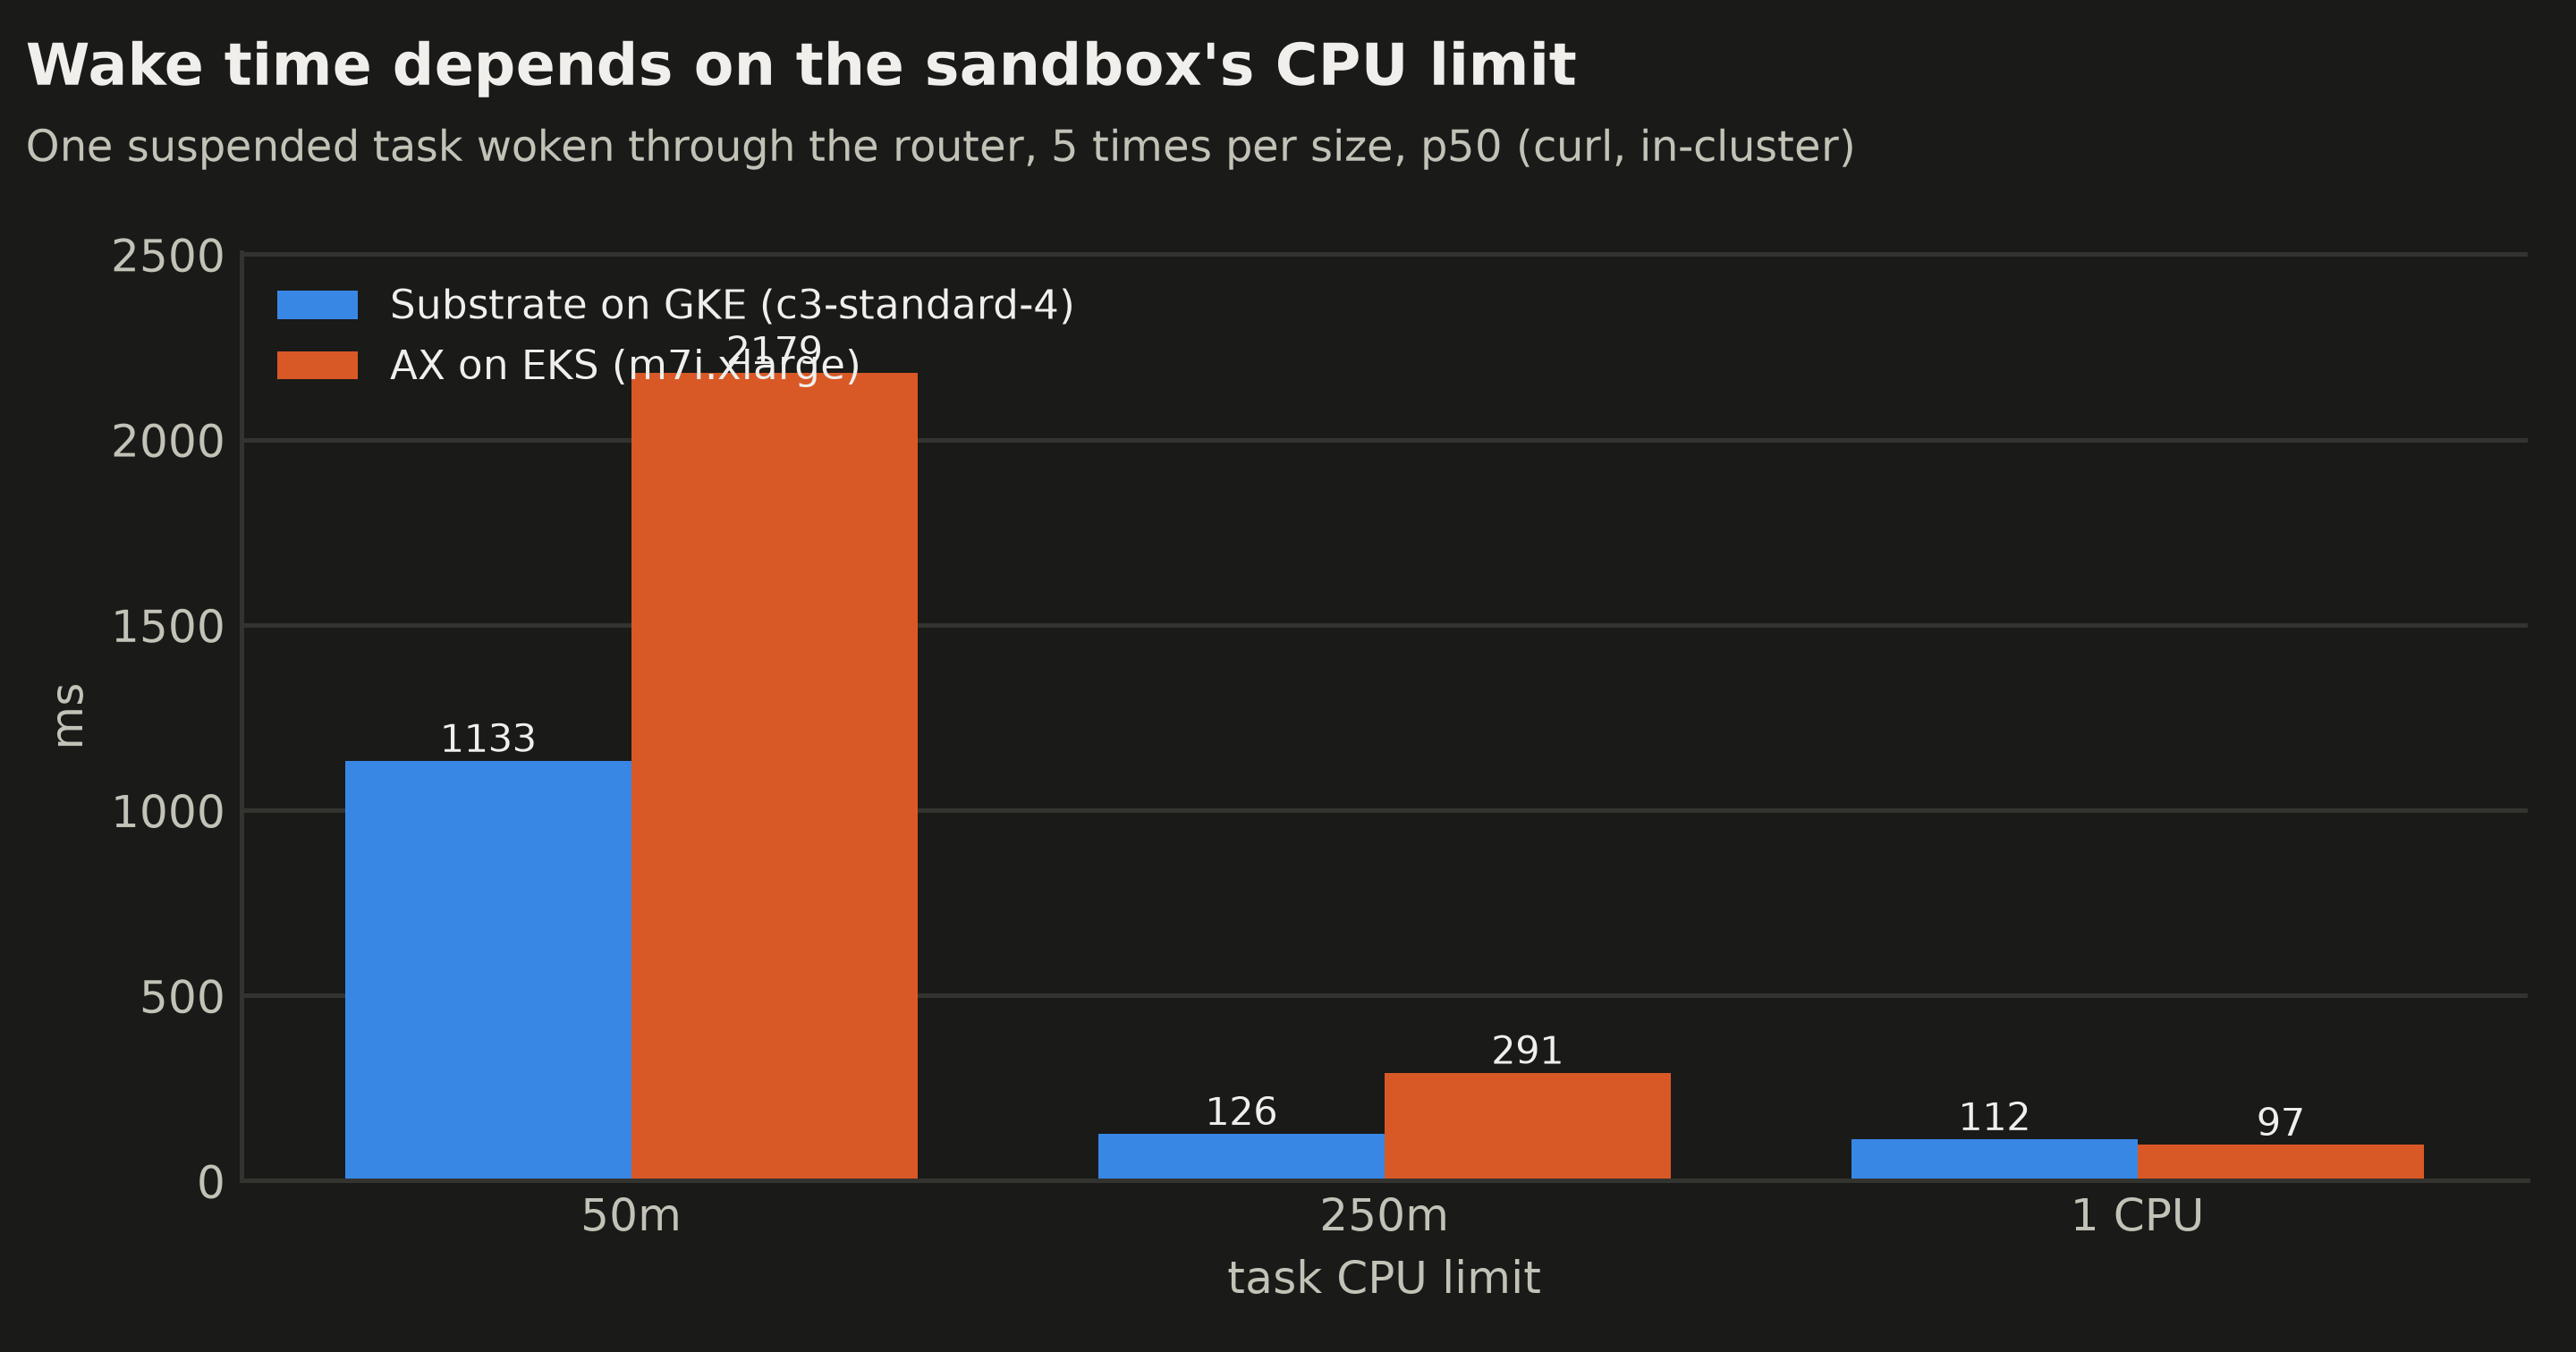
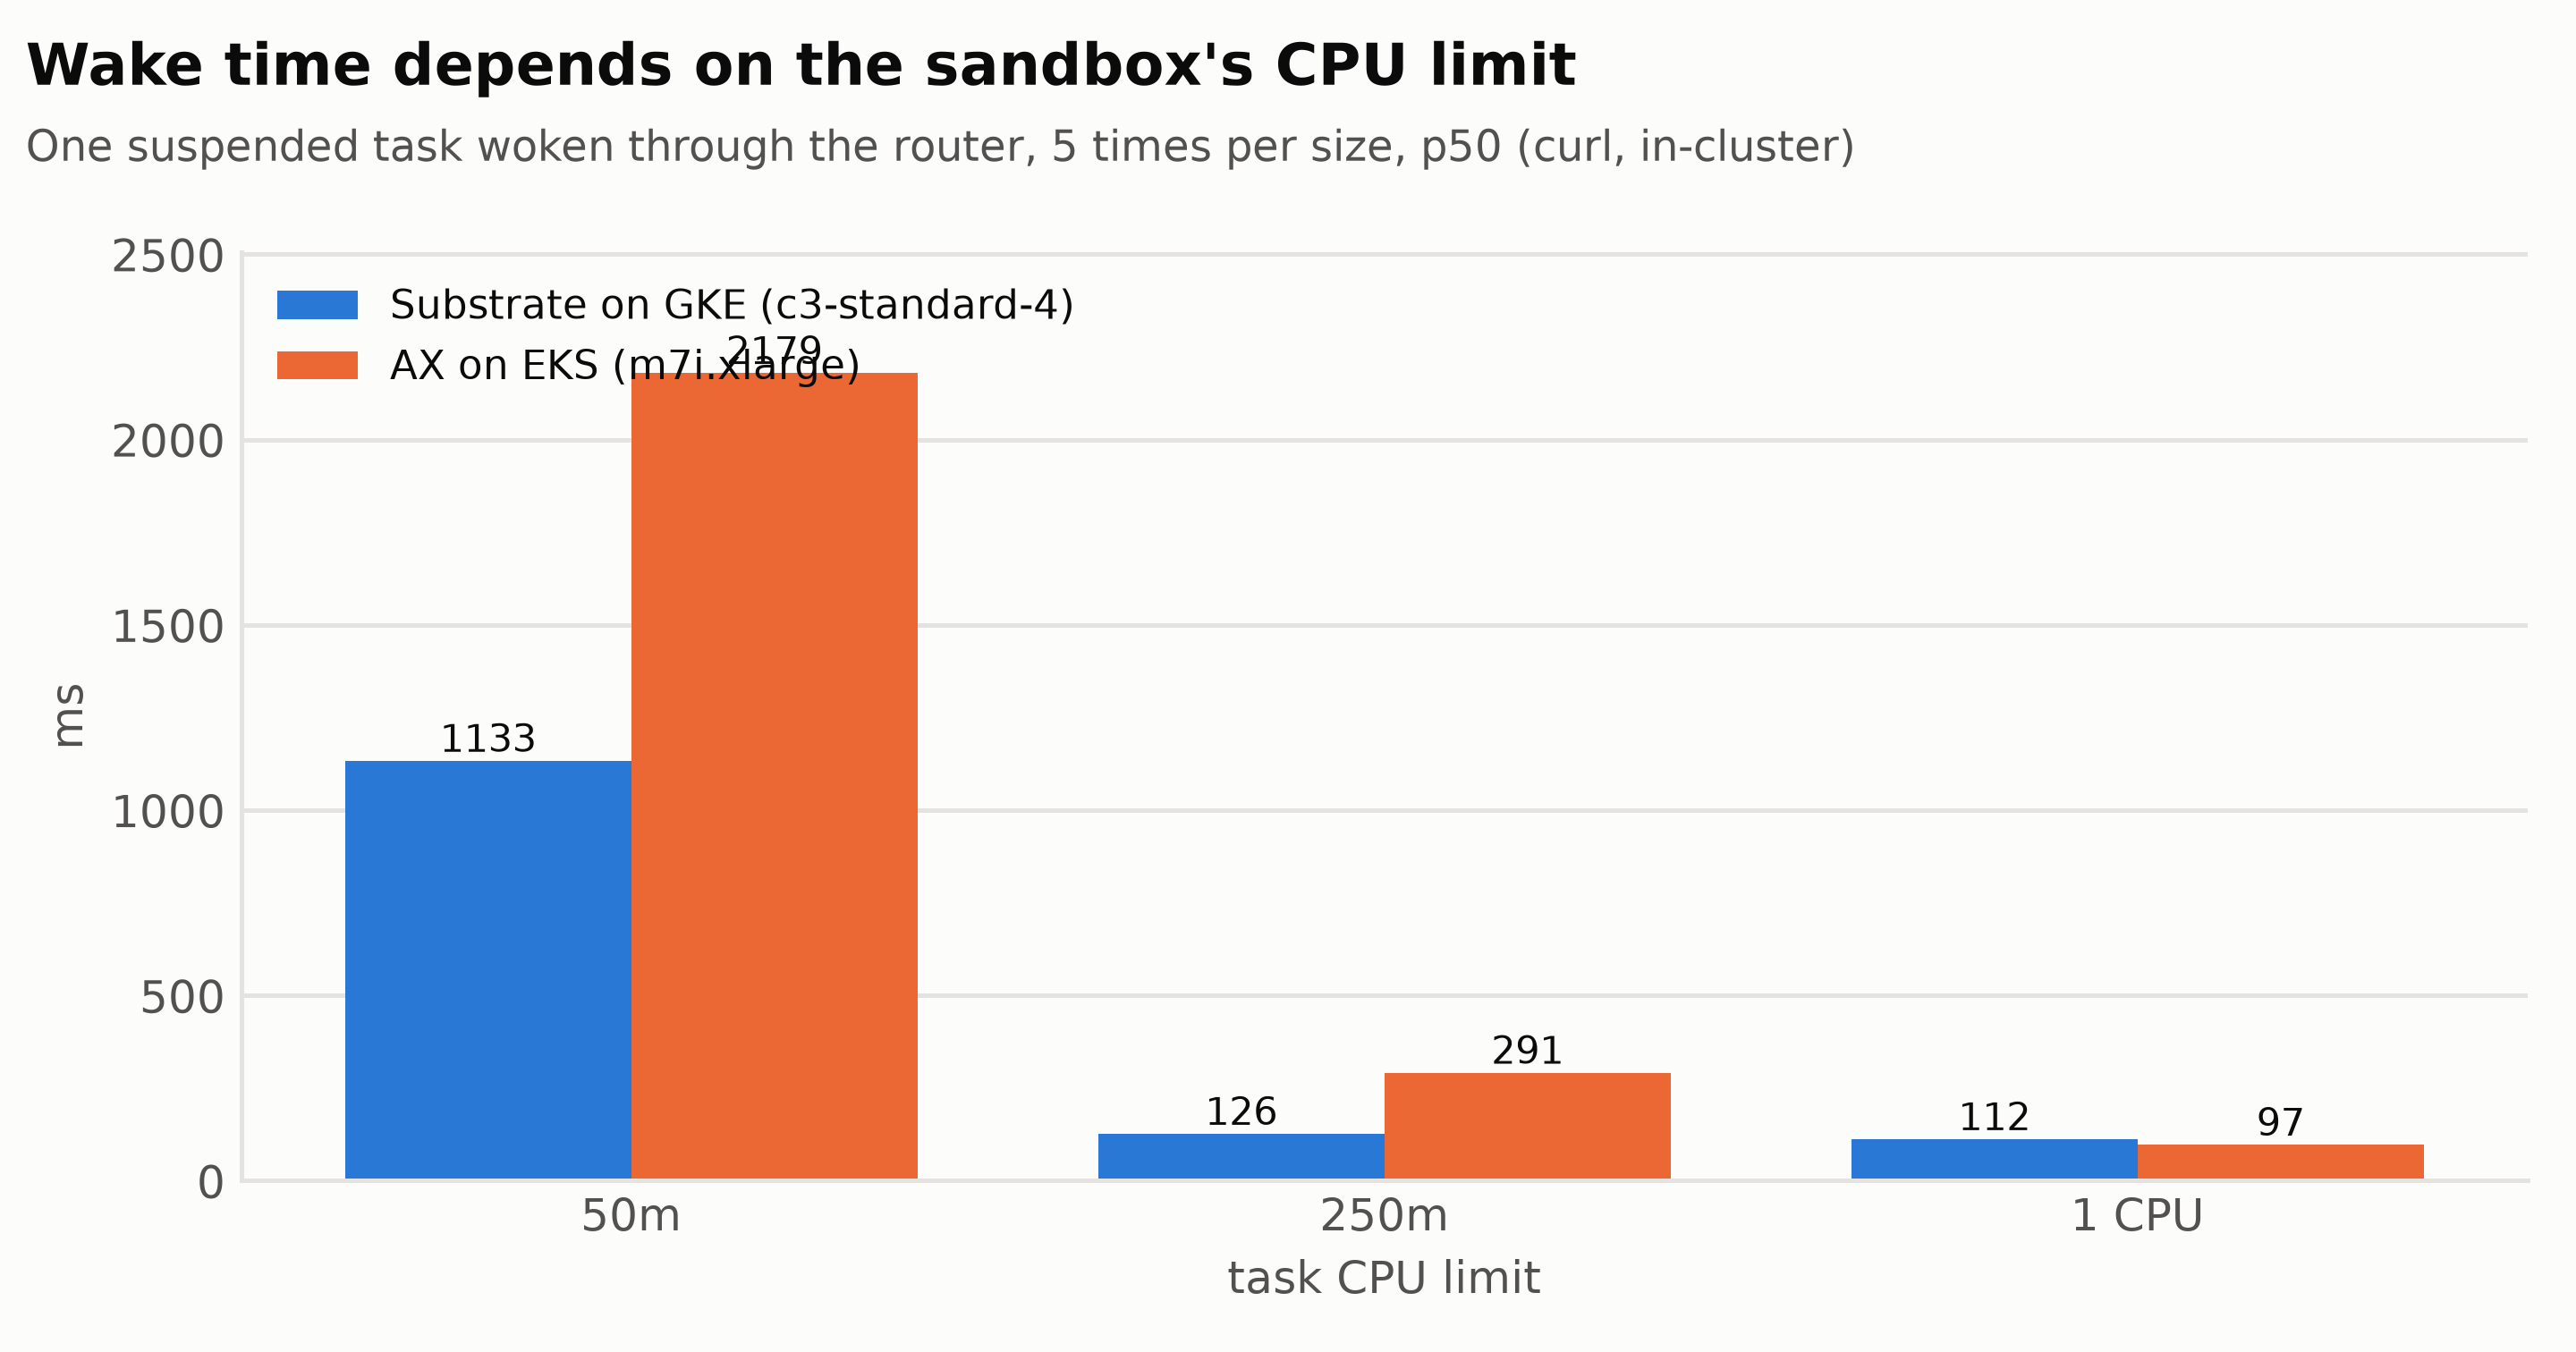
One suspended task per size, woken five times through the router, in-cluster, then bursts of 1, 10 and 30 tasks at 250m woken at once:
| GKE p50 | EKS p50 | |
|---|---|---|
| 50m | 1,133 ms (p95 1,396) | 2,179 ms |
| 250m | 126 ms (p95 184) | 291 ms |
| 1 CPU | 112 ms (p95 118) | 97 ms |
| Burst of 1 | 188 ms | 316 ms |
| Burst of 10 | 413 ms (p95 559) | 434 ms |
| Burst of 30 | 1,245 ms (p95 1,461, p99 1,512) | 903 ms |
All 200s. The headline reproduces: wake time is a CPU-limit choice, because the runner boots under the limit. A sandbox sized at 250m or 1 CPU wakes in about a tenth of a second, and one sized at 50m takes a full second. Google’s “sub-500ms” holds at 250m and above for one wake, and at 10 simultaneous wakes at the median.
Test 9: Noisy neighbors
Six victim tasks at 250m / 256Mi ran a CPU benchmark and a 64 MB write with fsync, alone and then next to four hog tasks of one kind. Medians, with the write p95:
| Neighbors | CPU benchmark | Write p95 | Suspend p95 |
|---|---|---|---|
| None | 518 ms | 620 ms | 727 ms |
| 4 CPU hogs | 642 ms (+24%) | 194 ms | 900 ms |
| 4 disk hogs | 592 ms | 199 ms | 1,551 ms |
| 4 memory hogs | 594 ms | 196 ms | 712 ms |
On EKS the CPU hogs slowed the benchmark by 74% and the disk hogs pushed the write p95 from 192 ms to 1,097 ms. Neither effect showed here: the CPU hogs cost 24%, and the write p95 stayed near 200 ms (the baseline’s 620 ms was one sample of six). The disk hogs did show up once, as a suspend p95 of 1.55 s. The memory hogs ended Failed at their limit, where on EKS they stayed Running, and their neighbors were unaffected either way. One run each means I wouldn’t lean on a +24% against +74%, but the missing disk effect is worth a second run, and it may come from the node’s disk (a hyperdisk-balanced boot disk against EBS gp3) as much as from the software.
Test 10: Snapshot storm, the network path and failure modes
Twenty tasks each wrote 100 MB and were suspended at once. Suspend took 1,951 ms at the median and 2,890 ms at p95 (EKS 1,124 and 1,879); an earlier run of the same test gave 1,866 and 3,235. No snapshot was in Cloud Storage for the first 5 minutes, and all 20 were durable at +324 seconds, the same as EKS at +325. The bucket held 1.95 GiB for them.
The question the EKS run raised was the network path: its VPC had no S3 endpoint, so 2.1 GB went through the NAT gateway and was billed as NAT data. On GKE I pulled Cloud NAT’s sent_bytes_count and Cloud Storage’s received_bytes_count from Cloud Monitoring for the same window. Cloud Storage received 2,090 MB in the minute of the first storm and 2,097 MB in the second. Cloud NAT sent 0 bytes. As a check that the NAT metric works, over the whole six hours it showed 749 MB received, during the install (images from ghcr.io), and 3.3 MB sent (t10d_nat_sanity.py). The EKS VPC had no S3 endpoint; I assume it is Private Google Access on the subnet that kept these uploads inside Google’s network, but I didn’t test the subnet with it off.
The failure modes, in order:
- A command that exits. The task stays
Running, with the runner as PID 1 and no exit code, as on EKS. - A worker pod deleted under one running and one suspended task: the running one became
Failed; the suspended one was unaffected and resumed in 614 ms with its file. Resuming the failed task took 634 ms and started fresh (up 0 min, its unsaved file gone). - A WorkerPool change (declaring capacity) took 14.2 s to roll out, against 3.0 s on EKS, and every running task became
Failed. Run it last. - Resources over the whole window. Cloud Monitoring’s 1-minute means peaked at 9% of allocatable CPU and 17.5% of memory on the two nodes, my 3-second kubelet samples reached up to 63% of a node’s CPU in the heaviest test, and there were 0 container restarts.
Results summary
| Claim or question | Result |
|---|---|
| GA on GKE, allowlist | No allowlist or eligibility message at install |
| Install effort | About 20 min from an empty project; bootstrap is 10 of them |
| What a suspend keeps | AX: /workspace only. Native, memory fidelity: process, /tmp, uptime. Neither: an open connection |
| ”Sub-500ms” resume | p50 112 to 126 ms through the router at 250m and 1 CPU; 107 to 314 ms for native actors; 1.1 s at 50m |
| Snapshot to object storage | 324 s after a suspend, detached from the node at 1,807 s, 104.9 MB for 200 MB of files, resume from GCS 1.7 to 2.3 s |
| Uploads and the NAT gateway | 2.1 GB to Cloud Storage, 0 bytes through Cloud NAT |
| Density | 156 idle sandboxes on 2 x 4 vCPU (EKS 151), 12.6 MiB each |
| Control-plane load | 0.6 core at the peak; the sandboxes are the limit |
| Noisy neighbors | CPU +24%, disk hogs did not slow neighbors’ writes |
Monitoring
Cloud Monitoring’s GKE system metrics are on by default and free: node CPU and memory (kubernetes.io/node/cpu/allocatable_utilization), container restarts, and per-pod numbers, which is where the peaks above come from alongside my kubelet sampler. bootstrap also creates three dashboards, “Substrate gRPC Server: latency / QPS / errors”, “Substrate Routing & E2E Latency” and “Substrate Snapshot Size & QPS”. Cloud NAT and Cloud Storage publish byte counts, which is how I answered the network question; Cloud Storage’s lagged by a few minutes. The console shows the workloads in ate-system and the snapshot objects in the bucket, but there is no view of actors, so for those you use kubectl ate get actor.
Pricing
Substrate adds no fee: you pay for GKE, Compute Engine and Cloud Storage. Idle, my cluster cost about $0.61 an hour (about $14.60 a day): two c3-standard-4 at $0.2016 an hour each, the cluster management fee (a free-tier credit covers one zonal cluster, which brings it to about $0.51), a 500 GiB pd-balanced volume for Substrate’s PostgreSQL (about $0.07 an hour), the 10 GiB AX volume, two 100 GB boot disks and Cloud NAT. EKS was about $0.63 an hour. The whole exploration and the recorded run took a few hours, so a few dollars. That 500 GiB volume is the one to remember: it is created by a PersistentVolumeClaim, so deleting the cluster leaves it behind, billing, until you delete the disk. The snapshots themselves are Cloud Storage objects: 105 MB per 200 MB workspace here, and a bucket that you should give a lifecycle rule if you suspend many actors.
Cleanup, in order: delete the tasks and actors, the WorkerPools and the router-probe pod; delete the cluster; then delete the orphaned pvc-* disks in Compute Engine; the snapshot and -assets buckets; the Artifact Registry repository; the ate-snapshot-transfer and node service accounts and their IAM bindings; the Cloud NAT and router. The next day, check that Billing shows no growth in GKE, Compute Engine, Cloud Storage, Artifact Registry or NAT. The repo’s teardown.sh does these and verifies them.
Verdict
What works
The sub-500ms resume claim held, on a modest cluster. A suspended actor woke through the router in about 120 ms with a CPU to spare, 156 idle sandboxes fit on two 4 vCPU nodes, and a snapshot of 100 MB reached Cloud Storage in 5 minutes without touching Cloud NAT, a real difference from my EKS run that I put down to the network setup and not to luck. A native actor with memory fidelity continued exactly where it stopped, which is more than AX asks for. The install had no allowlist, ran in about 20 minutes, and most of my EKS numbers reproduced within a margin I would call noise.
What doesn’t, yet
The sharp edges are in the defaults. The router’s allowlist decides who can wake an actor, the installer README says kubectl ate needs no entry and proxy needs one, and AX happily schedules onto any WorkerPool in the cluster, which changed my density numbers until I noticed. A new project’s disk quota is smaller than the volume Substrate asks for, and a console-created cluster doesn’t tell you. A wake with a 50m CPU limit took over a second, resumes under 40 concurrent calls took 3 seconds at the median, and a connection open at suspend time does not come back. A WorkerPool change took 14 seconds to roll out and failed every running task. Not tested: a microVM WorkerPool, credential injection with an API key, GPUs, and anything above two nodes or one run each. Versions differ from the EKS runs, so a few of the differences may be v1.0.0 and not GKE.
Who should use it
Use Substrate on GKE when you have many mostly idle agents and want each to keep its state without paying for an awake machine, and you are fine running a cluster. Set the sandbox size on purpose (the wake time follows the CPU limit), choose the snapshot fidelity you need, add your clients to the router allowlist, and keep the 500 GiB volume in mind at teardown. If you’d rather not run a cluster, the earlier parts cover the managed options, and part 1 puts all of them on one map.