GKE Agent Sandbox: Hands-On with Warm Pools, Pod Snapshots and the Silent Fallback
By Fabio Douek
Human-led, AI-assisted. Research and implementation done with AI tools, led, tested and edited by me. How posts are labeled
Jump to section
- Overview
- Setup
- Step 1: Project, tools and versions
- Step 2: The cluster and its node pools
- Step 3: The snapshot bucket and its permissions
- Testing
- Test 1: Two ways to install
- Test 2: Isolation and network posture
- Test 3: Warm-pool claim latency
- Test 4: Pod Snapshots
- Test 5: Restore on the wrong machine type
- Test 6: gVisor and microVM on one cluster
- Test 7: What an operator can see
- Results summary
- Monitoring
- Pricing
- Verdict
- What works
- What doesn’t, yet
- Who should use it
Explain (TLDR) like I am...
Imagine a toy shop with a row of already-open play boxes. When a child asks for one, the shop hands it over right away, and that is fast. If all the open boxes are taken, the shopkeeper has to build a new one, and that takes much longer.
There is also a magic photo: you can freeze a game in the middle, put the box away, and later it comes back exactly as it was. But if you unfreeze it on a different kind of table, it quietly starts the game from the beginning and tells nobody.
Agent Sandbox is open source software you run on your own GKE cluster, isolating each agent in a gVisor or microVM sandbox. There is no extra fee. The isolation, the network rules and the admission policy are your responsibility to configure and to verify.
In my tests the default network rules protected only sandboxes created from a template: a sandbox created directly reached the metadata server and the rest of the cluster. A snapshot restored onto a different machine type started cold without any error. Check both before relying on either for a compliance statement.
The presenting need is running untrusted agent code with strong isolation and fast starts. The treatment is a pool of warm gVisor pods claimed on demand, plus snapshots to suspend and resume agents. Warm claims took a fraction of a second; a cold create took about two and a half.
Side effects to monitor: when claims exceed the warm pool, the overflow took 21 to 32 seconds in my burst, and a restore on the wrong node type produced no error, only a counter back at zero. A persistent volume set the pace instead: a resume took about 12 seconds with one and about 2 without.
There is a calm that comes from knowing every agent has its own walled room, and much of that calm is earned: warm rooms were ready in a fraction of a second, and the snapshot brought an agent back mid-thought.
The unease sits in the quiet failures. A room made by hand had no walls on the network, and a snapshot restored onto the wrong machine simply began again with no warning. Naming those moments in advance makes them easier to plan around than to discover at 3 a.m.
Think of the warm pool as a band that has already tuned up: the claim is the downbeat, and the first note lands in a fraction of a second. Ask for more players than are tuned and the rest have to unpack, which in my burst meant a long silence before they came in.
The snapshot is a recording of the take. Played back on the same kit it picks up mid-bar. Played on a different kit, it does not complain: it just starts the song again from the top, and nobody on stage can tell until the counter reads zero.
The story is fast starts with real isolation: warm Agent Sandbox claims returned in well under a second in my runs, on gVisor, with no license fee beyond the cluster. Pod Snapshots add suspend and resume, and a restore without volumes came back in about two seconds.
The honest angle for a case study is the fine print: overflow claims took 20 seconds or more, directly created sandboxes skip the default network policy, and a snapshot restored on the wrong machine type starts cold with no error. Pair the speed with those three checks.
 See the source code here: gcp-sandboxes/gke-agent-sandbox
Overview
Agent Sandbox is a Kubernetes SIG Apps project that Google offers on GKE with no extra charge. It adds four custom resources: Sandbox (one isolated, stateful pod), and the extensions SandboxTemplate, SandboxWarmPool and SandboxClaim. A warm pool keeps ready pods waiting, and a claim takes one. Isolation comes from GKE Sandbox, either gVisor or, on Standard clusters since 1.37.0, a Kata and Cloud Hypervisor microVM. Google announced it as generally available on May 21, 2026 with two numbers: “300 sandboxes per second, per cluster” and “90% of allocations completing in 200 milliseconds”. The concept page now recommends Agent Substrate for most agent workloads and keeps Agent Sandbox for agents that need a dedicated Pod, GPUs or TPUs, a full PodSpec or Autopilot.
This post, part 5 of 6 in the Google Cloud Sandboxes series, tests it on a real cluster. Part 1 maps Google Cloud’s options for running code you don’t trust. Part 2 covered the sandbox behind Managed Agents, part 3 the Agent Platform sandboxes, and parts 4 and 6 cover Cloud Run sandboxes and Agent Substrate on GKE. This is the one where the sandbox is a pod in your own cluster, so the cluster’s defaults matter as much as the sandbox’s.
I ran it on November 14, 2026 on a GKE Standard zonal cluster in us-central1-a (Rapid channel, 1.37.1-gke.2097000), with kubectl, a small Python harness around the k8s-agent-sandbox SDK, and a recorded clean run for the video. Six results stood out:
- There are two install paths, and the docs show one.
gcloud beta container clusters update --enable-agent-sandboxstill works and installs a managed add-on with two admission policies, but the console has no row for it. The documented path is akubectl applyof the open-source controller; I used the latest release, v1.0.11, while the GKE pages still pin v1.0.6. - The default network protection only covers templated sandboxes. A Sandbox from a template could not reach the metadata server, cluster DNS or other pods. A Sandbox I created directly reached all of them and got a token from the metadata server, exactly as a normal pod does.
- A warm claim is fast, and everything past the pool is slow. Claims against a warm pool took 0.28 seconds at the median from my laptop, and the controller’s own histogram put the 90th percentile at 220 to 233 ms, just above Google’s 200 ms. In a burst of 20 against a pool of 10, the 10 overflow claims took 21 to 32 seconds.
- A volume decides how fast a resume is. Without one, restoring a Pod Snapshot took 2.1 to 2.7 seconds to the first reply, no slower than a cold restart. With a PersistentVolumeClaim attached, resumes took 12 seconds in most of my runs and 3 to 5 seconds in two, and a snapshot didn’t make them faster.
- A snapshot restored onto the wrong machine type starts cold, silently. On an N2 node, the C3 snapshot was ignored: the pod started fresh, the counter went back to 5, and no event or condition said so.
- gVisor and microVM differ where you’d expect, and one thing is the same. The microVM sandbox had a real 6.6 kernel, started in about 4 seconds against 1 for gVisor, and cost 250 mCPU and 130 MiB extra per pod. Both reached the metadata server on this cluster.
Setup
Step 1: Project, tools and versions
I used a separate billed project with a budget alert, us-central1-a, and these versions: Google Cloud CLI 593.0.0 (beta 2026.11.06), kubectl 1.37.2, Python 3.12 and k8s-agent-sandbox 1.0.11. Billing, the Kubernetes Engine, Compute Engine, Cloud Storage and IAM APIs are the only prerequisites. The SDK and the controller versions must match.
Step 2: The cluster and its node pools
Standard, zonal, Rapid channel, Workload Identity on, Dataplane V2 so that NetworkPolicy is enforced, and Pod Snapshots on. GKE Sandbox also needs at least one node pool that is not sandboxed, so the cluster’s default pool is a small system pool:
gcloud beta container clusters create sbx-gke --zone us-central1-a --release-channel rapid --num-nodes 1 \
  --machine-type e2-standard-2 --workload-pool=$PROJECT.svc.id.goog --enable-dataplane-v2 \
  --enable-pod-snapshots --no-enable-autoupgrade

gcloud container node-pools create gvisor --cluster sbx-gke --zone us-central1-a --num-nodes 1 \
  --machine-type c3-standard-4 --image-type cos_containerd --sandbox=type=gvisor --workload-metadata=GKE_METADATA
The cluster took 7 minutes and the pool 1.4 minutes. The sandbox pool is a c3-standard-4, not the docs’ e2-standard-2, because whole-pod snapshots don’t work on E2. In the console the gVisor option is the Enable sandbox with gVisor checkbox under Security when you add a node pool; there is no microVM option there, and the microVM pool in Test 6 is gcloud only.
Step 3: The snapshot bucket and its permissions
Pod Snapshots write to Cloud Storage, and the bucket needs hierarchical namespace on and soft delete off, plus a managed folder. A custom role and Workload Identity bindings let one Kubernetes service account write to it:
gcloud storage buckets create gs://$BUCKET --location=us-central1 --uniform-bucket-level-access \
  --enable-hierarchical-namespace --soft-delete-duration=0
gcloud storage managed-folders create gs://$BUCKET/snapshots/
gcloud iam roles create podSnapshotGcsReadWriterP5 --project=$PROJECT \
  --permissions="storage.objects.get,storage.objects.create,storage.objects.delete,storage.folders.create"
Then roles/storage.bucketViewer for the namespace, the custom role and roles/storage.objectUser for the one service account, and roles/storage.objectUser for GKE’s snapshot controller robot (all in 00_cluster.sh in the companion repo). I gave the role a new ID because a deleted custom role’s ID can’t be reused for weeks. The Agent Sandbox controller itself is Test 1.
Testing
Test 1: Two ways to install
The GKE install page tells you to apply a release manifest. Search results from before the page changed describe a managed flag, so I tried both, flag first.
gcloud beta container clusters update sbx-gke --zone us-central1-a --enable-agent-sandboxIt succeeded, after 6 to 7.5 minutes. What it did:
| What I looked at | Result |
|---|---|
addonsConfig.agentSandboxConfig | enabled: true |
| CRDs | The four Agent Sandbox CRDs, serving both v1alpha1 and v1beta1 |
| Controller | No pod anywhere: the leader-election lease was held by a control-plane VM, so it seems to run on Google’s side |
| Version | Not visible; the CRD annotation says component-version: 1.37.5, which is the add-on’s, not the controller’s |
| Admission policies | Two new ones: sandbox-core-policy (13 checks) and sandbox-hardening-policy (4). They allow runtimeClassName: microvm |
| Console | No row for it in the cluster’s Features list, though Pod Snapshots: Enabled is there; the text “Agent Sandbox” appears nowhere on the Details page |
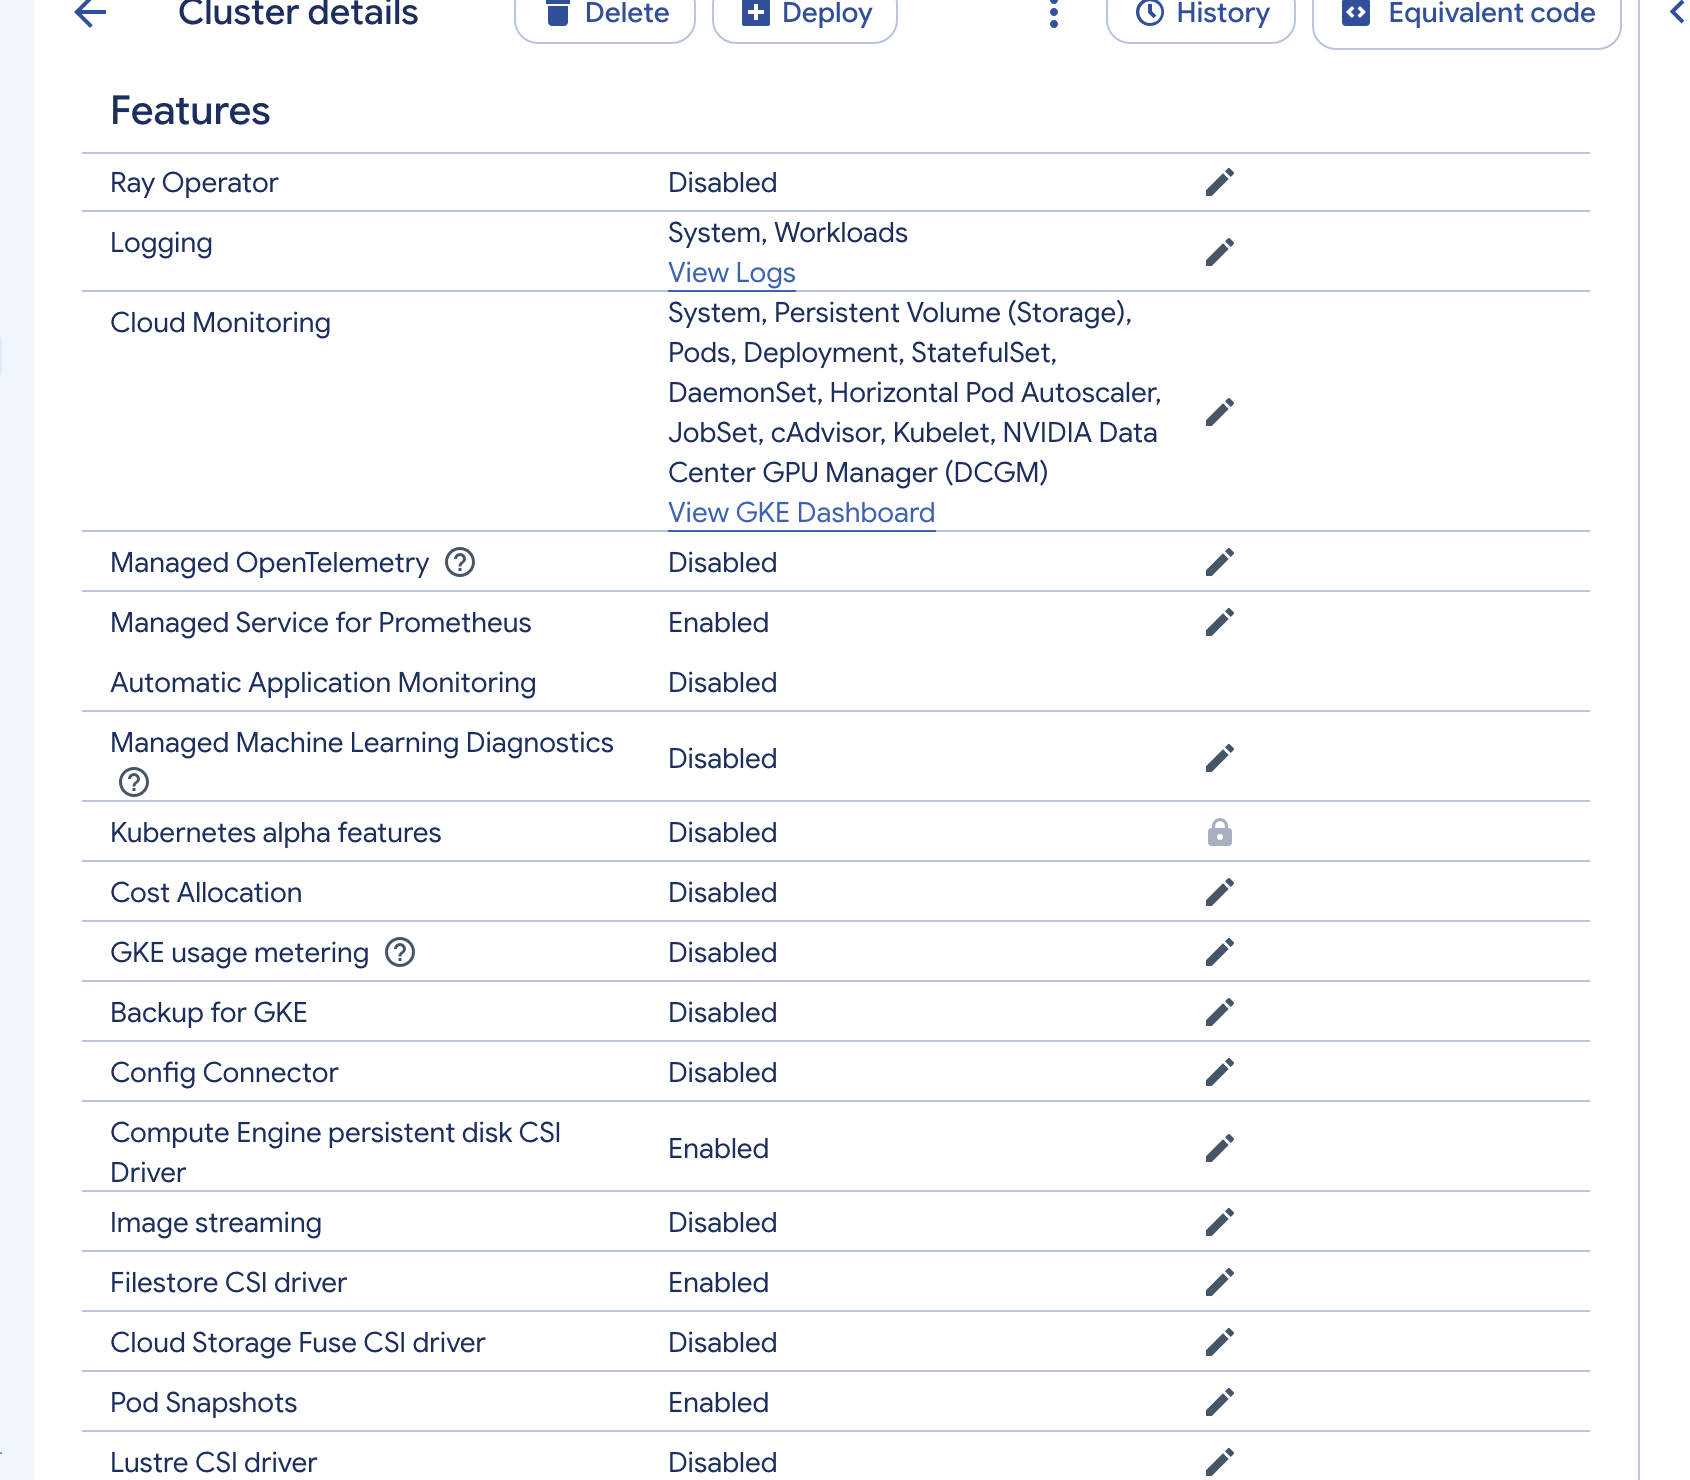
With the add-on on, a template and a pool of 2 were ready in 8 seconds and a claim came back in under a second. Turning it off with --no-enable-agent-sandbox took 6 to 8 minutes and left everything behind: the CRDs, both policies and bindings, and my sandboxes, with the controller’s lease gone. I deleted them by hand before the next step.
The documented path:
kubectl apply -f https://github.com/kubernetes-sigs/agent-sandbox/releases/download/v1.0.11/sandbox-with-extensions.yaml
kubectl rollout status deployment/agent-sandbox-controller -n agent-sandbox-system
The apply took 6 to 8 seconds and the controller was ready within 8 to 14 seconds of starting it, in two runs. This one serves only v1beta1, and it runs as a pod on the system node with --leader-elect=true --extensions. Then the recommended secure-sandbox-policy (16 checks) and the Sandbox Router, which the Python client needs.
The policy rejected both Sandboxes I expected it to:
The sandboxes "reject-root" is invalid: : ValidatingAdmissionPolicy 'secure-sandbox-policy' with binding
  'secure-sandbox-binding' denied request: Security Violation: Pods or Containers must set 'runAsNonRoot: true', ...
The sandboxes "reject-microvm" is invalid: : ... Security Violation: All Sandboxes must use 'runtimeClassName: gvisor'
One thing the policy does not tell you: the snapshot guide’s own template doesn’t satisfy it. It has no securityContext, no capability drop and no limits, and the guide’s earlier install page recommends the policy. kubectl apply accepted the template and a warm pool of 1; the pool just stayed at DESIRED 1, READY empty. The reason appeared only in the controller’s log: ... denied request: Security Violation: All containers must explicitly drop 'ALL' capabilities. The policy checks Sandboxes, and the controller creates those later.
I used v1.0.11 with the recommended policy for everything below. According to the release notes, v1.0.10 changed the router’s NetworkPolicy to allow egress on TCP 443 and 6443 and DNS to any destination; I kept that default.
Test 2: Isolation and network posture
Three workloads on the same cluster, one probe: a plain runc pod on the system node, a Sandbox claimed from a SandboxTemplate, and a Sandbox created directly with kind: Sandbox. Google’s concept page says the controller doesn’t create a NetworkPolicy for a Sandbox you create directly. I wanted to see what that means.
./02_isolation.sh # runs probe.sh inside each workload| Probe | runc pod | Templated Sandbox | Direct Sandbox |
|---|---|---|---|
uname -r | 6.18.53+ | 4.19.0-gvisor | 4.19.0-gvisor |
dmesg | permission denied | Starting gVisor... | Starting gVisor... |
| Metadata server token | HTTP 200 | timed out | HTTP 200 |
| Cluster DNS name | resolves | fails | resolves |
| Another pod on :8888 | HTTP 200 | timed out | HTTP 200 |
www.google.com | HTTP 200 | HTTP 200 | HTTP 200 |
The templated Sandbox is sealed from the cluster and open to the internet. The controller’s NetworkPolicy allows egress to 0.0.0.0/0 except 10.0.0.0/8, 172.16.0.0/12, 192.168.0.0/16 and 169.254.0.0/16, and ingress only from the router’s pods. It also sets dnsPolicy: None with public nameservers 8.8.8.8 and 1.1.1.1, which is why cluster names don’t resolve but www.google.com does. A runc pod on the system node could not reach the templated Sandbox either.
The directly created Sandbox has the gVisor kernel and none of that. It reached the metadata server and printed the project ID, zone, node name and a Bearer token for the namespace’s Workload Identity principal, with automountServiceAccountToken: false set. That token has no roles unless you grant some, but guides like the snapshot one grant roles/storage.bucketViewer to every service account in a namespace. Google’s GKE Sandbox page says pods on gVisor nodes “can’t access cluster metadata on the node OS level”; with Workload Identity on, what answers is the GKE metadata server, and a direct gVisor Sandbox could use it. kubectl get networkpolicy -A showed one policy, the template’s.
One more gVisor limit from the docs, confirmed: kubectl port-forward into a gVisor pod connects and then fails with connection refused. kubectl exec and the router both work.
Test 3: Warm-pool claim latency
Google’s claim is “300 sandboxes per second” and 90% of allocations in 200 ms, on hardware it doesn’t state. I have one c3-standard-4 node, so I can’t test 300 per second, but I can test the 200 ms. The harness uses the SDK through the router (kubectl port-forward to the router service) and reads the controller’s agent_sandbox_claim_controller_startup_latency_ms histogram before and after each phase. The template uses small requests (50m, 128Mi) so 30 sandboxes fit on the node, and the pool is allowed to refill between claims: the harness polls the pool’s readyReplicas before each one.
sb = client.create_sandbox(warmpool="bench-pool10", namespace="default")   # claim created -> claim Ready
sb.commands.run("echo ok") # first round trip through the router| Case | create_sandbox p50 / p90 / max | Server: claim to Ready |
|---|---|---|
| Pool of 2, 20 sequential claims | 0.28 / 0.61 / 0.63 s | p50 at most 100 ms, p90 233 ms, 19 of 20 under 250 ms |
| Pool of 10, 20 sequential claims | 0.28 / 0.32 / 0.34 s | p50 at most 100 ms, p90 220 ms, 20 of 20 under 250 ms |
| No pool (cold), 10 sequential | 2.5 / 3.4 / 3.5 s | p50 2.4 s, p90 4.4 s |
| Burst of 10 on a pool of 10 | 0.83 / 1.2 / 2.1 s, all done in 5.1 s | p50 393 ms, p90 750 ms |
| Burst of 20 on a pool of 10 | 12 / 31 / 32 s | warm claims: p50 1.2 s, p90 2.5 s; cold claims: p50 27 s |
The histogram’s buckets run 100, 250, 500, 750 ms and then 1 s and up, so the percentiles are interpolated inside a bucket. On a quiet pool the 90th percentile fell in the 100 to 250 ms bucket, at 220 to 233 ms by interpolation. That is near Google’s 200 ms but not under it, and with no bucket edge between 100 and 250 ms the histogram can neither confirm nor refute the claim. With ten claims arriving together the 90th percentile moved to the 500 to 750 ms bucket. Median create_sandbox from my laptop, which includes the round trip to the API server, was 0.28 seconds.
Three things the table hides:
- The first command is the slow part.
commands.runtook about 2.4 seconds the first time on every sandbox and 125 ms after that (03b_first_command.py: 2.53, 0.12, 0.14 and 0.12 s on one sandbox, and 2.47 s for the first command on a second one), so a warm claim plus a first command was about 2.7 seconds end to end. I didn’t dig into what the SDK does on first use; whatever it is, the pool doesn’t hide it. - Overflow doesn’t fail, it goes cold. When the 20 claims outran the 10 warm pods, the other 10 got fresh sandboxes. Sequentially a cold create was 2.5 seconds; in the burst, with the pool also refilling, the ten overflow claims took 21 to 32 seconds on one node, while the ten warm ones took 0.8 to 3.4 seconds. I didn’t isolate why the cold ones slowed down so much. Classmethod measured 25.6 seconds in total for 10 concurrent claims against 3 warm pods, on different hardware and in another region, which is a similar shape.
- Size the pool for the burst. The warm path was never the problem. What I’d watch is pool depth against your concurrent claims.
Test 4: Pod Snapshots
On the 1.37.1 cluster kubectl api-resources lists podsnapshot.gke.io/v1 for all four snapshot resources, not the v1alpha1 that some of Google’s pages mention. I ran one Sandbox with a small Python app that holds four kinds of state: an in-memory counter, an open TCP connection to www.google.com, a file in an emptyDir and a file on a PVC. After a baseline (suspend with no snapshot, resume), I ran 5 cycles: write markers to both volumes, take a snapshot with a PodSnapshotManualTrigger, write a second marker, set spec.operatingMode: Suspended, wait for the pod to go, set Running, and time it.
python 04_pod_snapshots.py 5            # with the PVC
python 04_pod_snapshots.py 3 --no-pvc # the same without it| No snapshot, PVC attached | Snapshot, PVC attached (5 cycles) | No snapshot, no PVC | Snapshot, no PVC (3 cycles) | |
|---|---|---|---|---|
| Snapshot Ready | 2.1 to 2.5 s | 2.1 to 2.4 s | ||
| Suspend until the pod is gone | 1.1 s | 1.1 to 1.9 s | 1.8 s | 0.8 to 1.8 s |
| Pod Running | 11.6 s | 12.2 to 12.5 s in four cycles, 3.2 s in one | 1.5 s | 1.9 to 2.3 s |
| First reply from the app | 12.0 s | 12.4 to 12.6 s and 3.4 s | 2.1 s | 2.1 to 2.7 s |
| Counter after resume | back to about 0 | continues from the snapshot | back to about 0 | continues from the snapshot |
What survived, per cycle:
| State | Result |
|---|---|
| Counter and the process (same start time) | Kept, from the moment of the snapshot, not of the suspend |
emptyDir file | Kept as of the snapshot: what I wrote after it was gone |
| PVC file | Everything kept, including the write after the snapshot, because the volume was never part of it |
| TCP connection | Dropped at the first restore: BrokenPipeError (my app didn’t reconnect afterwards) |
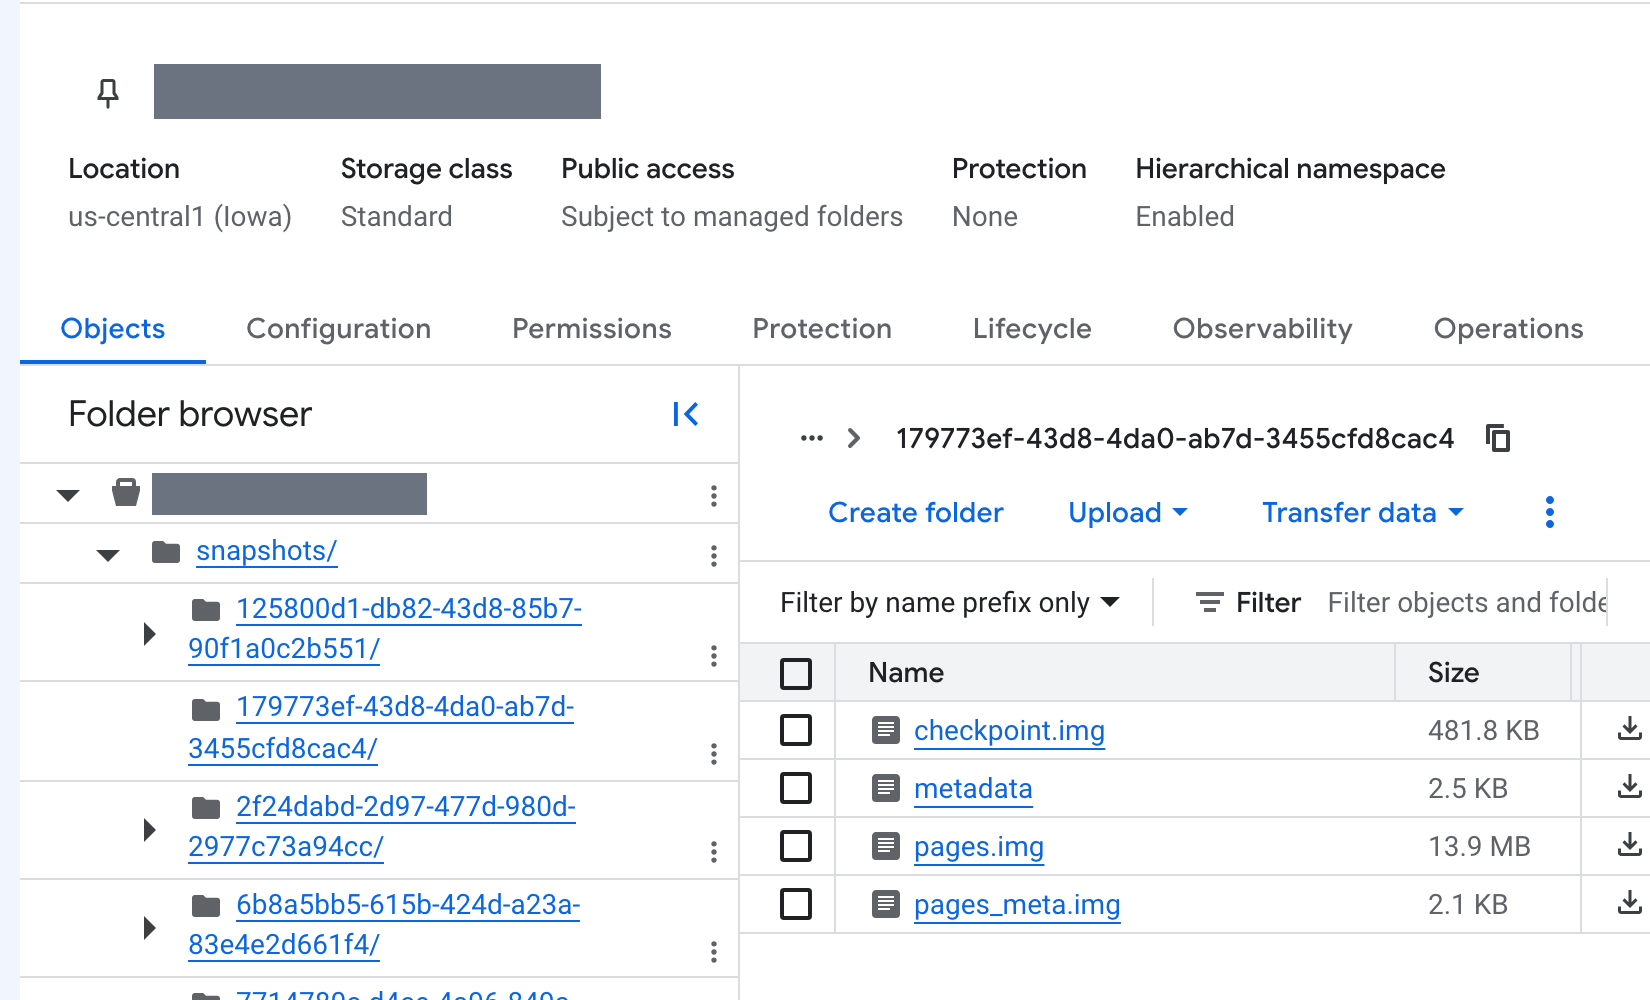
Each snapshot was four objects in the bucket’s snapshots/ folder, 14.4 MB in total for this small Python process (pages.img 13.9 MB, checkpoint.img about 0.48 MB). Each trigger made a new one, and five snapshots of the same sandbox were all still there afterwards: nothing pruned them until I deleted the PodSnapshot objects. The pod’s Running time was the interesting number. Google’s pages say the restore takes “a few seconds”, and with no volume it did: 2.1 to 2.7 seconds, the same as a cold start of this tiny app. With a PVC attached, a resume took 12 seconds in four of five cycles and 3.2 seconds in one, and the one no-snapshot resume in that run took 11.6 seconds. In my exploration run the no-snapshot resume with the PVC took 5.1 seconds, so the spread is wide and I can’t say why. I didn’t time the volume attach on its own, but taking the volume away took the delay away, so I’d blame the volume, not the memory restore. A snapshot saves the most for something that takes a long time to initialize, which a small Python process doesn’t.
Test 5: Restore on the wrong machine type
InfoQ’s coverage of Pod Snapshots warns that where no compatible snapshot exists the Pod “starts normally” and “nothing errors”. Google’s concept page says a whole-pod restore onto a node with mismatched CPU features “fails”, and the how-to documents a cold start when the snapshot isn’t ready. I wanted to see which of those happens on a different machine type. The snapshot’s own labels say what it was taken on: podsnapshot.gke.io/node-machine-family: c3, the node version and a hash of the pod template. I added a second gVisor pool of n2-standard-2, took a snapshot on the C3 node, cordoned that node, suspended and resumed:
python 05_mismatch.py before counter= 207 ... emptyDir: 3 lines, last pre3
snapshot 0a8927af-... ready after 2.3s
resumed counter= 5 ... emptyDir: none
landed on the N2 node: True
Normal Scheduled snap-sandbox Successfully assigned ... to gke-sbx-gke-mismatch-...
Normal Pulling snap-sandbox Pulling image "python:3.12-slim"
Normal Pulled snap-sandbox Successfully pulled image "python:3.12-slim" in 2.585s
Normal Started snap-sandbox Container startedThe pod started on the N2 node 5 seconds later (including a 2.6 second image pull), the counter was 5, the emptyDir was empty, and the Sandbox’s Ready condition said everything was fine. In the earlier restores the event list had a GKEPodSnapshotting ... Successfully restored the pod from PodSnapshot line. Here it was absent, and nothing replaced it: no warning, no condition. If you resume sandboxes in an automated flow, check for that restore event or for state in the app. A cordon that moves the pod to a different machine family looks exactly like this; InfoQ says a node pool upgrade can do the same, which I didn’t test.
Test 6: gVisor and microVM on one cluster
I added a microvm node pool on a c3-standard-4: gcloud only, with --sandbox=type=microvm --enable-nested-virtualization, and it took 1 minute 3 seconds (nested virtualization works on C3). The recommended policy only allows gVisor, so the script removes its binding while it runs and restores it after. The microvm RuntimeClass maps to kata-clh, carries its own node selector and toleration, and declares an overhead of cpu: 250m, memory: 130Mi.
| gVisor | microVM | |
|---|---|---|
uname -r | 4.19.0-gvisor | 6.6.94-g7b99f7ef5fbf, with a real Linux boot log in dmesg |
| Metadata server | token returned | token returned |
| Cold create to Ready, 10 sequential Sandboxes (image on the node) | 0.98 s median (0.75 to 1.33) | 3.98 s median (3.75 to 4.35) |
| First start of the probe Sandbox | 0.85 s | 3.7 s (5.5 s in an earlier run, when the image had to be pulled) |
| Memory the Sandbox sees (limit 512 Mi) | 512 MiB | 2,467 MiB, which looks like the guest VM’s size |
| Node “Allocated resources” for 5 pods requesting 100m / 128Mi | +500m CPU, +671 MB | +1,750m CPU, +1.35 GB |
| Pod Snapshot | works | refused |
The microVM’s extra cost is exactly the declared overhead: five pods asked for 500m and the node counted 1,750m. The microVM was about four times slower to start on this node. The metadata row is the surprise: Google’s GKE Sandbox page says pods on gVisor nodes “can’t access cluster metadata on the node OS level”, that this limitation “doesn’t apply to the microVM sandbox type”, and tells you to add a NetworkPolicy for microVMs. On this cluster, with Workload Identity on, the gVisor Sandbox I created directly reached it too (Test 2), so a NetworkPolicy is the control in both cases, not the runtime.
Asking for a snapshot of the microVM Sandbox was the one place where the platform said no, plainly. The trigger’s condition: cannot trigger a manual checkpoint because the target pod is not using the gvisor runtime class.
Test 7: What an operator can see
An issue on the gVisor project reported that cAdvisor shows only the pause container’s scope for runtimeClassName: gvisor pods on cgroup v2 with systemd-cgroup on. It was closed on November 5, 2026, fixed in a later change. So I ran the same workload, a busy loop limited to 500m with 100 MiB of memory and a log line per second, as a runc pod and as a gVisor Sandbox for six minutes and compared what GKE shows:
| Tool | runc pod | gVisor Sandbox |
|---|---|---|
kubectl top pod --containers | 500m, 104 Mi | 500m, 111 Mi |
kubelet /stats/summary | per-container CPU and memory | per-container CPU and memory |
Cloud Monitoring container/cpu/core_usage_time, memory/used_bytes | series for the burn container | series for the burn container |
| Cloud Logging stdout lines | yes | yes |
Nothing was missing on 1.37.1. The container’s CPU and memory showed up in every tool, with more memory reported under gVisor (117 MB against 109 MB for the container in Cloud Monitoring, and 141 MB against 110 MB for the pod in the kubelet; the two pods ran on different machine types, so I wouldn’t read much into it). I didn’t check whether my cluster uses systemd-cgroup, so this only shows that the metrics worked on 1.37.1.
Results summary
| Claim or question | Result |
|---|---|
| Install | --enable-agent-sandbox works (managed, hidden controller, no console row); kubectl apply v1.0.11 ready in 8 to 14 s; the snapshot guide’s template fails the recommended policy without telling you |
| Default network posture | Templated Sandbox: no metadata, no cluster, public internet; directly created Sandbox: no policy at all |
| Warm-pool claim | p50 0.28 s client side, server p90 220 to 233 ms (19 and 20 of 20 under 250 ms); a first command adds 2.4 s once |
| Beyond the pool | Falls back to a cold create: 2.5 s alone, 21 to 32 s in a burst of 20 on one node |
| Pod Snapshot restore | 2.1 to 2.7 s to first reply with no volume; 3 to 12 s with a PVC, snapshot or not; connections dropped; emptyDir as of the snapshot |
| Wrong machine type | Silent cold start, no error, no event |
| microVM | Real kernel, 4 s start, 250m and 130 MiB overhead, no snapshots, same metadata exposure |
| Operator visibility | kubectl top, kubelet, Monitoring and Logging all show gVisor sandboxes |
Monitoring
The sandboxes are ordinary pods, so the GKE console’s Workloads and Observability views, Cloud Monitoring’s container metrics and Cloud Logging all work as for any other pod (Test 7). The controller exports Prometheus metrics on port 8080, including agent_sandboxes and the claim-latency histogram I used; Google’s page shows a PodMonitoring resource to collect them in Cloud Monitoring. With the managed add-on there’s no controller pod to scrape, so I don’t know where its metrics go. The restore event GKEPodSnapshotting is in the namespace’s events and nowhere else I looked.
Pricing
Agent Sandbox and Pod Snapshots add no fee: you pay for the cluster management fee ($0.10 per hour for Standard, which the $74.40 monthly credit covers for one zonal cluster), the nodes, their boot disks and the Cloud Storage the snapshots use. My cluster ran at roughly $0.40 per hour at list price: the cluster fee, one e2-standard-2 system node and one c3-standard-4 gVisor node ($0.37 together) plus two 100 GB boot disks. The temporary microVM pool (c3-standard-4) and the N2 pool (n2-standard-2) added about $0.20 and $0.10 per hour while they existed. The snapshots were 14 MB each, well inside Cloud Storage’s free tier. The whole part, exploration and recording together, used about two hours of cluster time and cost about $0.90 at list price, with the cluster fee counted in full.
Cleanup order matters: delete the Sandboxes, claims and snapshot resources, then the PVCs before the cluster (their disks outlive it otherwise), the temporary pools, the cluster, and last the bucket, the custom role and the bindings. teardown.sh in the repo does it and then lists clusters, instances, disks, buckets and the role.
Verdict
What works
The warm path does what the page says: a claim against a ready pool returned in about a quarter of a second from my laptop, and the controller’s own numbers are in the range of Google’s 200 ms. The isolation is real: a gVisor kernel by default, a real Linux kernel if you pay for the microVM, and ordinary Kubernetes tooling (kubectl top, Monitoring, Logging, admission policies) works on both. Pod Snapshots work for what they say: the process memory came back at the moment of the snapshot, and with no volume attached a restore took about 2 seconds. The admission policy rejected both bad Sandboxes with a clear message, and the platform refused a microVM snapshot with an explicit one.
What doesn’t, yet
The sharp edges are quiet. A directly created Sandbox has no network policy, so it reaches the metadata server and the rest of the cluster, and the install steps don’t say so (the concept page mentions it once). The snapshot guide’s template fails the policy from the install guide, and the only evidence is in the controller’s log. A restore on the wrong machine type starts cold with no event, and a PVC attached to the sandbox made resumes slow and uneven, 3 to 12 seconds, snapshot or not. The overflow behavior of a pool, 21 to 32 seconds in my burst, isn’t in the docs I read. The docs pin v1.0.6 while v1.0.11 is out, and the managed add-on is hidden from the console and leaves its CRDs and policies behind when you turn it off. Not tested: the 300-per-second figure, anything but one node per pool, Autopilot, GPUs, more than one namespace, and restores across node upgrades.
Who should use it
If each agent needs its own pod, a full PodSpec or a GPU, and you’re comfortable owning a Kubernetes cluster, Agent Sandbox gives you a good warm-start story and a credible isolation boundary. Create sandboxes from templates, so the network policy applies, or write the policy yourself for direct ones. Size warm pools for your peak claims, put volumes aside when you want fast restores, and check for the restore event and for state before trusting a resume. If you’d rather not run a cluster, the earlier parts cover the managed options; and for the density and suspend-resume story at scale, part 6 looks at Agent Substrate on GKE.