Agent Platform Sandboxes: Hands-On with Code Execution, Shell, Computer Use and Custom Containers
By Fabio Douek
Human-led, AI-assisted. Research and implementation done with AI tools, led, tested and edited by me. How posts are labeled
Jump to section
- Overview
- Setup
- Step 1: Install the SDK
- Step 2: Create the Agent Runtime instance
- Step 3: Permissions for Computer Use and custom containers
- Step 4: Templates
- Testing
- Test 1: What the sandboxes are
- Test 2: Create times
- Test 3: Identity and network
- Test 4: State and TTL
- Test 5: Code Execution limits
- Test 6: Pause vs snapshot
- Test 7: Computer Use
- Test 8: Custom containers
- Test 9: What gets logged
- Results summary
- Monitoring
- Pricing
- Verdict
- What works
- What doesn’t, yet
- Who should use it
Explain (TLDR) like I am...
Imagine one toy shop with four kinds of play boxes: a box for doing sums, a box for typing commands, a box with a little web browser inside, and a box you fill with your own toys. You ask the shop for a box and it hands you one in a couple of seconds, because it keeps spares on the shelf.
The boxes can be put to sleep and woken up, and the shop can take a photo of a box and make a twin from it. The sums box has no lid timer, though, so if you forget it, it stays on the shelf and the shop keeps counting.
The service offers four managed sandbox types behind one API, all running in a Google-managed project. Network access is off by default, the metadata server is unreachable even when internet access is on, and the audit log records who created, paused or ran something in a sandbox.
The gaps are specific. Code Execution sandboxes have no default expiry and bill while they exist, several documented limits differ from what I measured, and the audit log does not contain the code that was run. Confirm the expiry, the quotas and the billing terms for your contract.
The presenting need is a safe place to run code an agent wrote. The treatment is a gVisor sandbox with no network by default, created in about two seconds from a pre-warmed pool. In my tests the two types I could fingerprint, Code Execution and Shell, both showed gVisor.
Side effects to monitor: a Code Execution sandbox that never expires, a resume that returns before the sandbox answers, and documentation that disagrees with the product on sizes, limits and what a pause keeps. Order the checks yourself before prescribing it widely.
It is calming to ask for a sandbox and have one in two seconds, and to know that the network is closed unless you open it. Much of the anxiety that comes with running generated code fades when the defaults are this cautious.
The friction shows up in small surprises: a sandbox that never expires, a pause that keeps more than the page promised, and a console that cannot show you any of it. You end up checking things yourself, which is reassuring once it is done and tiring while you do it.
Think of four instruments in one rack, each patched into the same mixing desk. They come up fast, because the desk keeps a few warmed up and ready, and the two I could listen to closely, Code Execution and Shell, sit in the same acoustic room, a gVisor sandbox.
The tempo is steady at about two seconds a take, apart from the one case where you ask for a fresh patch and wait nearly twenty. Pause is a held note: the process is still sounding when you come back. And nothing on stage tells you the volume of the room, you read it from the logs.
The pitch is one API for four kinds of sandbox: run code, run shell commands, drive a browser, or bring your own container. Creation takes about two seconds, network access is off by default, and a paused sandbox comes back with its running process intact.
The honest story for a slide: no sandbox console, a Code Execution sandbox that never expires unless you set a time to live, and billing at about 18 cents an hour for the default Code Execution size, for as long as it exists.
 See the source code here: gcp-sandboxes/agent-platform-sandboxes
Overview
Agent Platform sandboxes are the sandbox family of Google’s Gemini Enterprise Agent Platform, the product formerly known as Vertex AI. One API creates four kinds of “gVisor-isolated container” in a Google-managed tenant project: Code Execution (run Python or JavaScript), Shell (run bash commands), Computer Use (a Chrome browser an agent can drive) and custom containers (your own image from Artifact Registry). The docs say sandboxes “can be short-lived, session-based, or stateful for several days”, and they can be paused, snapshotted and restored. Launch stages are uneven: Shell and Computer Use went GA on September 9, 2026, while Code Execution has been in Preview since September 2025 with no GA note, and custom containers, templates and snapshots entered Preview on May 26, 2026 with none either, though GA Shell and Computer Use depend on templates.
This post, part 3 of 6 in the Google Cloud Sandboxes series, tests those claims. Part 2 covered the sandbox behind Managed Agents in the Gemini API, where a model decides what to run. Here you call the sandbox yourself, with a plain execute call. Part 1 maps all of Google Cloud’s options, and parts 4 to 6 cover Cloud Run sandboxes, GKE Agent Sandbox and Agent Substrate on GKE.
I tested it on November 14, 2026 in us-central1, with the Python SDK and with raw REST calls, and recorded a clean run of every test for the video. Seven results stood out:
- Creation is fast once something is warm. A Code Execution, Shell or Computer Use sandbox from a template took 1.0 to 3.0 seconds. Asking for a Shell sandbox without a template took about 19 seconds, because the SDK builds a new template every time. The very first Code Execution sandbox in a new project took 142 seconds.
- Sizes are mostly undocumented. A default Shell sandbox is 0.5 vCPU and 0.5 GiB and Computer Use is 2 vCPU and 4 GiB; the docs give neither. The Code Execution sandbox reports 2 GiB, not the documented 1.5 GiB.
- The network is closed, and the metadata server is closed even when it isn’t. With internet access on,
www.google.comand a raw IP answered; the metadata server and private ranges still timed out. - A Code Execution sandbox never expires by default. Shell and Computer Use get 2 hours. All of them bill while they exist.
- Pause keeps more than the docs say. A background process, a package and the boot id all survived a pause. A snapshot restored into a new sandbox kept them too.
- The audit log records the lifecycle but not the work. Create, pause, resume and snapshot are logged, and
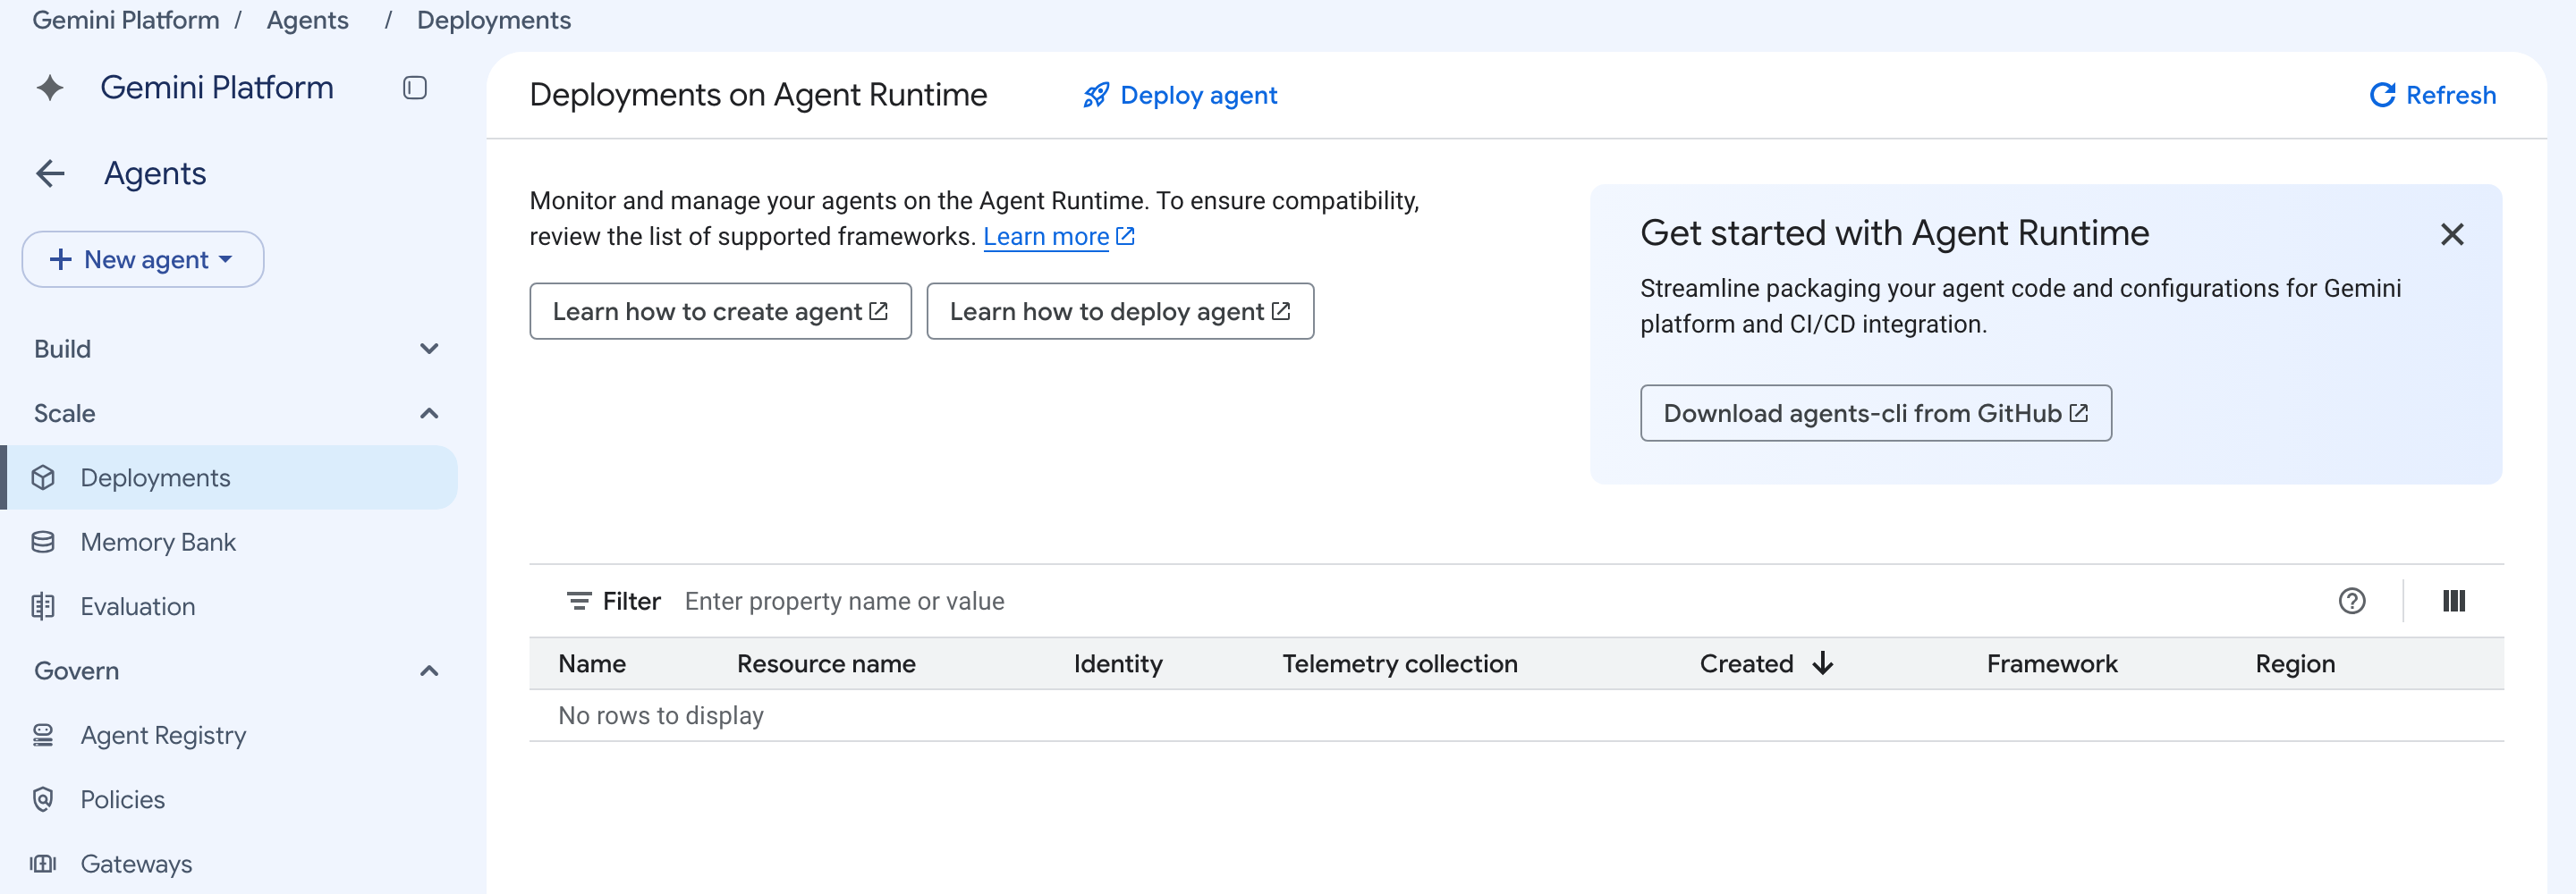
executeis logged once Data Access logs are on, but the code I ran appeared nowhere. - No console shows any of this. The Agent Runtime page lists no instances and no sandboxes. Quotas, logs and billing are the only console views.
Setup
New to Google Cloud? Everything lives in a project: the APIs you turn on, the permissions, and the billing. I used a dedicated, billed project in us-central1, with billing enabled and these APIs on: aiplatform, artifactregistry, cloudbuild, iamcredentials and logging.
Step 1: Install the SDK
python3.12 -m venv .venv && .venv/bin/pip install google-cloud-agentplatform==2.9.0 google-genai httpx requests websocketsEverything uses agentplatform.Client().sandboxes.* with api_version="v1beta1": the GA v1 API has no computerUseEnvironment and no bidiExecute, and every quickstart pins v1beta1. The Shell quickstart mixes in an older SDK (vertexai); I used only the agentplatform one. Versions: Python 3.12.13, google-cloud-agentplatform 2.9.0, google-genai 3.3.0, Google Cloud CLI 593.0.0.
Step 2: Create the Agent Runtime instance
Every sandbox, template and snapshot is a child of an Agent Runtime instance, the same resource that hosts deployed agents. You don’t need to deploy an agent into it. client.runtimes.create() wants extra packages, so I created the instance with one REST call (t0_setup.py):
curl -s -X POST -H "Authorization: Bearer $(gcloud auth print-access-token)" -H 'Content-Type: application/json' \
  "https://us-central1-aiplatform.googleapis.com/v1beta1/projects/$PROJECT/locations/us-central1/reasoningEngines" \
  -d '{"displayName": "sbx-part3"}'
It was ready in about two seconds. The SDK wants Application Default Credentials; to avoid a browser login, sbx.py in the companion repo hands it your gcloud token instead. Open it with python -i sbx.py and you have a ready-made client and one-line helpers.
Step 3: Permissions for Computer Use and custom containers
Code Execution and Shell need only roles/aiplatform.user on the caller. Computer Use talks to the sandbox’s own HTTPS endpoint with a JWT signed through iamcredentials, so it needs a service account with roles/aiplatform.user, and the caller needs roles/iam.serviceAccountTokenCreator on it. IAM changes took a minute or two to apply: my first token call returned 403 and worked a few minutes later.
Custom containers need an Artifact Registry repo and roles/artifactregistry.reader for service-<project number>@gcp-sa-vertex-sandbox.iam.gserviceaccount.com. Cloud Build also failed at first: the project’s default compute service account had no access to its own source bucket, so I gave it roles/cloudbuild.builds.builder.
Step 4: Templates
Code Execution takes an inline spec. Shell and Computer Use are template-backed: a template names the container category, its size and its network setting, and the platform keeps a pool of ready sandboxes for it. I made three, once, and reused them (t1_create.py): Shell with internet off, Shell with internet on, and Computer Use.
Testing
Test 1: What the sandboxes are
# Code Execution: ask Python
os.cpu_count(), MemTotal, platform.uname(), dmesg
# Shell: bash
uname -r; dmesg | head -2; id; nproc; free -m
# Computer Use: ask the browser
navigator.hardwareConcurrency, navigator.userAgent| Code Execution | Shell | Computer Use | |
|---|---|---|---|
| Kernel | 4.19.0-gvisor | 4.19.0-gvisor | (browser only) |
| dmesg | ”Starting gVisor…" | "Starting gVisor…“ | n/a |
| User | root (uid 0) | appuser (uid 999) | n/a |
| OS and runtime | Python 3.12.5, Node 18 | Debian 12, Python 3.11.2, no Node | Chrome 139 on Linux |
| Memory seen inside | 2 GiB (4 GiB at the larger size) | 512 MiB | n/a |
| Size the platform assigned | docs: 2 vCPU, 1.5 GiB | 0.5 vCPU, 0.5 GiB | 2 vCPU, 4 GiB |
Code Execution and Shell are gVisor, whose dmesg greets you with “Starting gVisor…” and a joke boot log. In Computer Use I could only ask the browser, so I have no kernel string for it, and the custom containers I tested serve only HTTP, so I didn’t fingerprint them either. The sizes took some digging. Code Execution has two machine configs, and MACHINE_CONFIG_VCPU4_RAM4GIB gave me 4 GiB inside, but both report 8 CPUs, the host’s, so the vCPU count can’t be read from inside; the docs say 2 and 4. The Shell and Computer Use sizes are not documented. Each sandbox has a routing token, a JWT, with claims machine_vcpu and machine_memory_gib, and the template’s resources.limits say the same: Shell 0.5 vCPU, 0.5 GiB (512 Mi), Computer Use 2 vCPU, 4 GiB. A Shell sandbox’s nproc reports 2 CPUs while the limit is 0.5.
Test 2: Create times
op, secs = timed(client.sandboxes.create, name=rt, config={"sandbox_environment_template": tpl, "ttl": "600s"})| Create | Runs | Time |
|---|---|---|
| Code Execution, inline spec | 5 | 1.0 to 2.4 s (median 1.6 s) |
| Shell, from a template | 5 | 1.6 to 3.0 s (median 1.7 s) |
| Computer Use, from a template | 3 | 1.6 to 2.1 s (median 1.7 s) |
| Shell, inline spec, no template | 2 | 18.5 and 19.3 s |
| A template, create to ACTIVE (three in parallel) | 3 | 17.8 to 18.0 s |
The docs promise “under a second” for Code Execution (not reached: 1.0 to 2.4 seconds, plus 0.5 to 1.1 seconds for the first execute) and “about 20 seconds” for Shell, which is what I got only without a template. With one, the platform hands over a sandbox from a pre-warmed pool. The REST resource says how big that pool is: every template I created had warmPoolConfig.targetInstanceCount: 10, an undocumented default. The Shell sandboxes I took from a pool had been up between 105 seconds and 27 minutes already (/proc/uptime).
Two more things. The inline Shell create builds a new template every time: after two creates, the instance had two extra templates named shell-sandbox-template, which keep their warm pools, and the SDK never deletes them. And “cold” is real, but only the first time: my very first Code Execution sandbox in a new project took 142 seconds (the docs say “up to 2 minutes”), the first template in a new Agent Runtime instance took about 2 minutes 40, and a second instance in the same project showed none of it: 2.1 seconds, and templates ready in 18 seconds. The REST field warmPoolConfig is not in the SDK, but it works: I created a template with a pool of 1, which later tests used for the cheaper custom containers. A template with a pool of 0 never produced a sandbox in the 13 minutes I waited.
Test 3: Identity and network
whoami; id; sudo -n true; env | wc -l; which curl
python3 probe.py <url>     # prints the HTTP status, or why it failed
The Shell sandbox runs as appuser, has no sudo, no curl, 21 environment variables and none named like a secret, plus 8 KUBERNETES_* variables: it’s a pod. Then the same probes against each destination, with internet access off and on in the template, and Code Execution as the control:
| Destination | Shell, internet off | Shell, internet on | Code Execution |
|---|---|---|---|
| Metadata server (169.254.169.254) | timeout | timeout | unreachable |
metadata.google.internal | no DNS | no DNS | no DNS |
www.google.com | no DNS | HTTP 200 | no DNS |
storage.googleapis.com | no DNS | HTTP 400 (the server answered) | no DNS |
| 8.8.8.8 (raw IP) | timeout | HTTP 200 | unreachable |
| 10.128.0.2, 192.168.0.1 (private) | timeout | timeout | unreachable |
pip install cowsay | fails | works | fails |
With internet off, DNS doesn’t resolve and raw IPs time out. With it on, the sandbox gets the public internet but not the metadata server or private ranges, as documented. There is no allowlist in between: the template field is a boolean, and per-domain control needs a VPC attachment with a firewall you run. So “internet access” is all or nothing, unlike the allowlists of part 2. The GA note sells Shell for installing packages, but without internet and without root, that works only after you open the network and install into the user-writable virtualenv (/opt/venv): pip install --user fails there.
Test 4: State and TTL
run(sb, "x = 41"); run(sb, "print(x + 1)")      # 42
rest("GET", sandbox)["expireTime"]                 # after creating with no ttl
Code Execution keeps its Python state between calls. For expiry, the docs disagree with each other (2 hours, 7 days, 14 days, “not automatically deleted”). I created each type without a ttl and read it back over REST:
| Type | Default expiry |
|---|---|
| Code Execution | none: no expireTime at all |
| Shell | 2 hours |
| Computer Use | 2 hours |
I also created a Code Execution and a Shell sandbox with ttl: 300s, ran a command at 240 seconds, and read expireTime again: it didn’t move. An execute doesn’t reset the clock, though the Code Execution quickstart says each execution does. After the expiry a GET returned 404 and the audit log showed an AutoDeleteSandboxEnvironment entry.
ttl never expires, and sandboxes bill while they exist. At the list price for the documented default size that is about $0.18 an hour, $4.40 a day. Always set a ttl.
Test 5: Code Execution limits
client.sandboxes.execute_code(name=sb, input_data={"code": code, "files": [...]})- JavaScript works: with
code_language: LANGUAGE_JAVASCRIPT,console.log(process.version, typeof require)printed Node v18.20.1 andfunction. The overview doesn’t mention JavaScript. - Libraries are preinstalled, pip isn’t: numpy 2.1.3, pandas 2.2.3, matplotlib 3.10.1, openpyxl 3.1.5, scipy 1.15.2 and Pillow are there;
pip install cowsayfailed, since the sandbox has no network. - Output files come back as extra chunks with a file name: a matplotlib PNG (16,656 bytes) and an XLSX (4,850 bytes) arrived as valid files. The data is already raw bytes: the doc sample’s
content.b64decode()is a bug, and abase64.b64decodeisn’t needed either. - The 100 MB cap didn’t bite. I uploaded 99 and 101 MiB as input files, and both worked (
blob101.bin 105906176bytes inside). Each took about 9 minutes from my home connection, so I ran this one outside the recorded run (t5b_upload.py).
Test 6: Pause vs snapshot
I set up a Shell sandbox with internet on: a background http.server, a file in /workspace, another in /tmp, an installed package and the boot id. Then:
client.sandboxes.pause(name=sb)
client.sandboxes.resume(name=sb)
snap = client.sandboxes.snapshots.create(source_sandbox_environment_name=sb, config={"ttl": "7200s"})
new = client.sandboxes.create(name=rt, config={"sandbox_environment_snapshot": snap.name})| After pause and resume | After snapshot and restore (new sandbox) | |
|---|---|---|
| Background process | alive, port answered | alive, port answered |
/workspace and /tmp files | kept | kept |
| Installed package | kept | kept |
boot_id | same | same |
The docs say a pause keeps the file system and a snapshot also keeps memory. In my runs both kept the running process and the same boot id, so I could not tell them apart this way. The timings across my runs: pause 5.3 to 9.8 seconds, resume() 4.1 to 8.5 seconds, snapshot 5.1 to 9.4 seconds, restore into a new sandbox 4.5 to 8.1 seconds. The restored sandbox is a different resource, and the source kept running afterwards. A second restore from the same snapshot worked too.
The surprises are in the edges:
- Running a command on a paused sandbox resumes it. The call fails with
503 UNAVAILABLE: Sandbox environment is paused; resume has been initiated. Please retry the request.and a 10 second retry hint, and the sandbox was running again 4 to 5 seconds later. The docs say the data plane “returns errors until you resume”. resume()returns before the sandbox answers. After an explicitresume(), the first command that succeeded through my retry loop (every 3 seconds, up to 36) came about 34 seconds later in all three runs; after the automatic resume it answered at once. Treat 34 seconds as “up to half a minute”, not a measured readiness time.- Resuming a running sandbox is not an error. It returned fine.
FAILED_PRECONDITIONappeared only while the sandbox was still resuming (must be in PAUSED or STOPPED state to be resumed). - The snapshot resource is thin. REST returns
createTime,expireTime(7,200 seconds, my ttl),ownerandsourceSandboxEnvironment, but nosizeBytesand noparentSnapshot, though the reference documents both. I couldn’t draw an ancestry tree or measure the storage a snapshot uses. - Code Execution can do neither. A snapshot returned
404 Failed to get OSS Agent Sandbox CRand a pause returned500 Internal error. The 404 text is the only place I saw it, and it suggests the platform looks for a custom resource of the open-source Agent Sandbox project, the one GKE’s own Agent Sandbox uses (part 5). That is my inference, not something the docs say.
Test 7: Computer Use
cdp(sb, "Page.navigate", {"url": "https://cloud.google.com/docs"})
png = cdp(sb, "Page.captureScreenshot")["data"]
The sandbox serves a small HTTP API on port 8080: GET / returns {"status":"healthy"}, and POST /cdp takes one Chrome DevTools Protocol command. It’s a Chrome 139 at 1280 by 720. A navigate plus a screenshot gave a 190 KB PNG of the Google Cloud documentation home page.
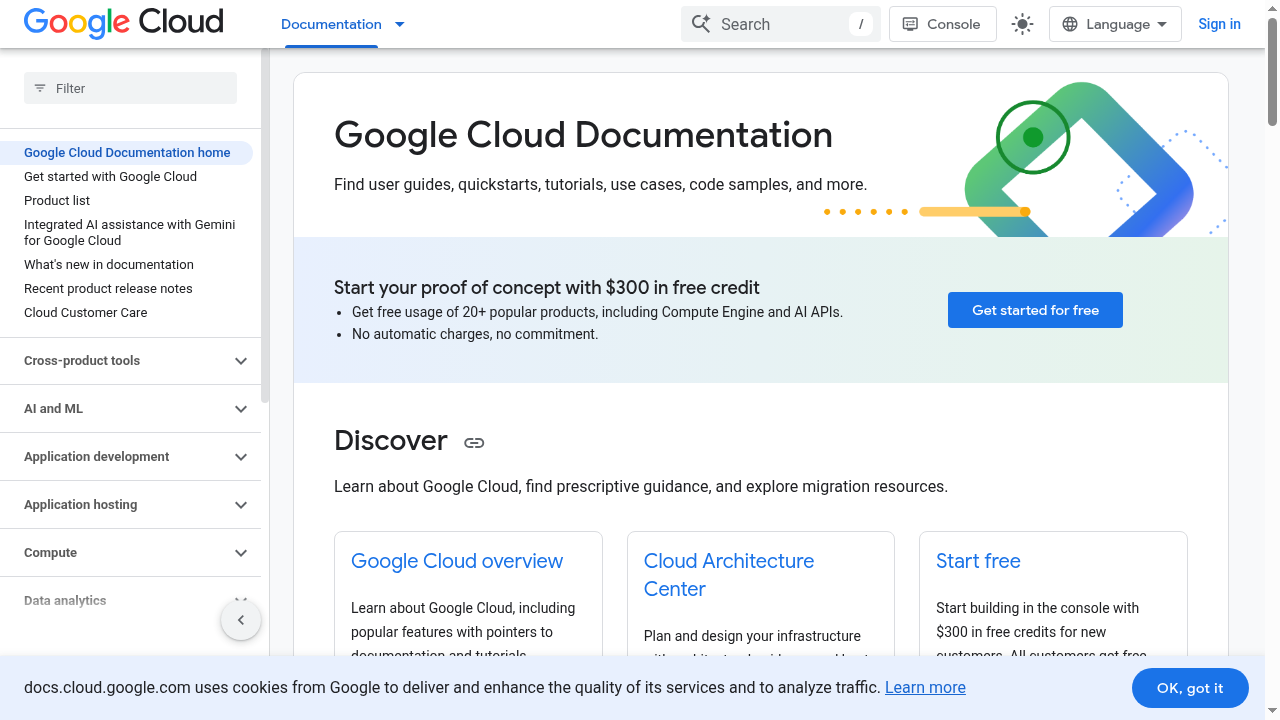
Then the loop (cu_loop.py, about 100 lines with the CDP translation): screenshot to Gemini 3.8 Flash with the computer-use tool, take the model’s action, translate it into CDP (Input.dispatchMouseEvent, Input.insertText, Page.navigate), screenshot again, at most 6 steps. The model page and the sandbox pages don’t reference each other, so the glue is yours.
step 1: click {'x': 608, 'y': 33, ...}   step 3: scroll {'direction': 'down', ...}
step 2: type {'text': 'Agent Platform sandboxes', 'press_enter': True}   step 4: click {'x': 432, 'y': 84}
Task: search the Google Cloud docs for “Agent Platform sandboxes” and open the first result. It took 4 actions, about 30,300 tokens (a few cents at list price) and 34 seconds, with 3 to 4 seconds per model call in the recorded run (13 to 17 seconds on a slow call in earlier runs), and ended on “Sandboxes overview”. Coordinates are 0 to 999 in both axes and map to the 1280 by 720 page. The action names differ from the documented ones: I saw click, type and scroll, not click_at, type_text_at and scroll_document.
noVNC: the sandbox has three ports, 5091, 8080 and 9222. Port 5091 serves a noVNC client (GET /vnc.html returned the 15,850 byte page, title “noVNC”), which is the live view the docs mention without a port. I could not open its websocket with the headers the CDP websocket uses (HTTP 400), so I can’t say a live view works.
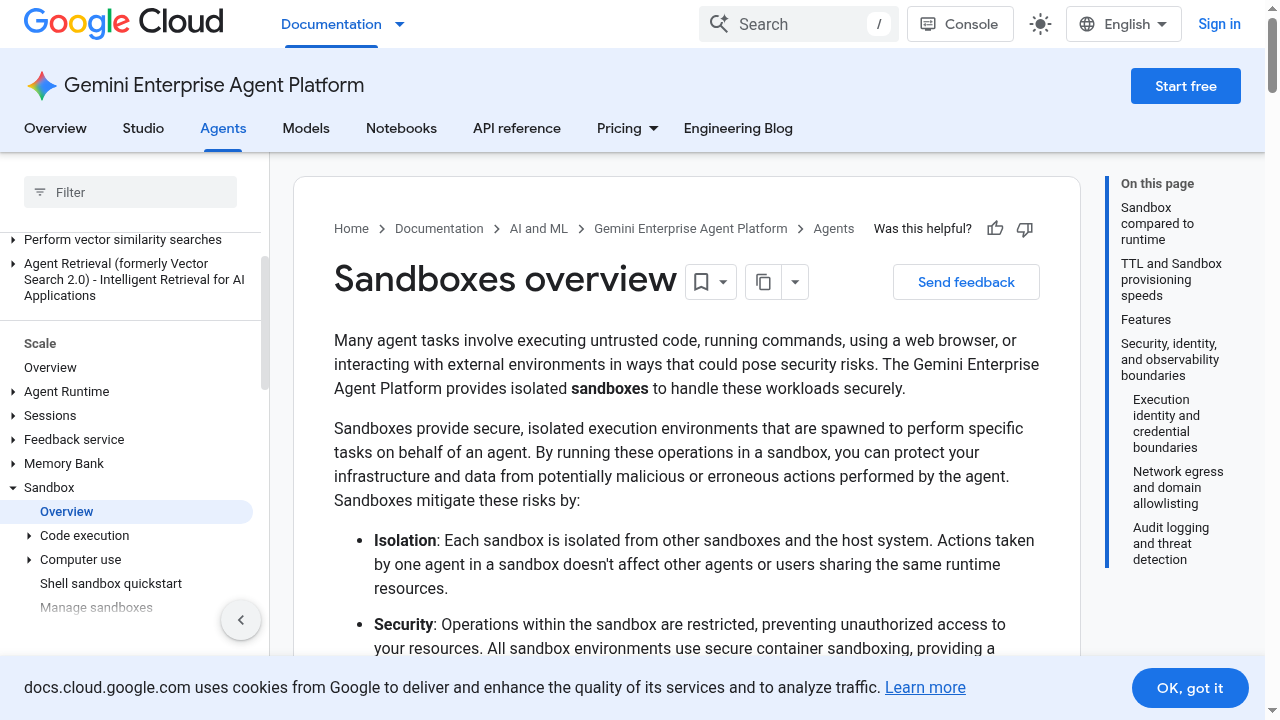
The screenshot the model saw after its fourth action: the first search result, opened.
Pause and snapshot work on a browser too. I left that page open, paused and resumed the sandbox, then snapshotted it and restored the snapshot into a new sandbox. The page was still open both times. One trap: in an earlier attempt, the sandbox object I already held answered Bad Gateway: Unable to reach the sandbox environment for the five minutes my retry loop ran after a resume. When I read the sandbox again with get() and used that fresh object, it answered in 0.6 seconds. I believe its connection_info changes on resume, but I didn’t compare the values.
Test 8: Custom containers
The docs ask for a Linux image with “a compatible runner or entry point” that “must not require root”, from Artifact Registry. The runner isn’t described anywhere in the docs, so I tested three images, all FROM python:3.12-slim and built with gcloud builds submit:
USER 1000
CMD ["python", "-m", "http.server", "8080"]     # image 1: HTTP on 8080, non-root
CMD ["sleep", "infinity"]                         # image 2: no HTTP server
USER 0                                            # image 3: like image 1, as root
Each got a template with port 8080, 1 CPU and 500 Mi (and a warm pool of 1), then one sandbox (I polled the template state every few seconds, so read the template column as “about 11 s”):
| Image | Template ACTIVE | Sandbox RUNNING | Call to port 8080 |
|---|---|---|---|
HTTP, USER 1000 | about 11 s | 4.5 s | the container answered |
| no HTTP server | about 11 s | 4.1 s | Bad Gateway: Unable to reach the sandbox environment |
HTTP, USER 0 | about 11 s | 4.2 s | the container answered |
So the contract is a server on a declared port. The same call two ways: :execute with the request URI and port as chunks (what execute_bash does for /exec) and send_command through the data plane. Python’s http.server answered the first with its own 501 Unsupported method ('POST') page, which tells you the control plane forwards your call as a POST; send_command with a GET returned the directory listing. Three more observations:
RUNNINGdoesn’t mean reachable. The image with no server reachedSTATE_RUNNINGin 4 seconds and every call to it failed.- Root wasn’t rejected. The
USER 0image started and served. I couldn’t runidin it, so I can’t say what uid the platform actually used. - A recreated repository broke templates. I had deleted my Artifact Registry repo and recreated it under the same name with the same permissions. Templates pointing at it stayed
PROVISIONINGfor 25 minutes, and the ones I deleted stayedDEPROVISIONING. A repo with a new name worked straight away.
Test 9: What gets logged
Admin Activity audit logs are always on. I turned on Data Access logs for aiplatform.googleapis.com (ADMIN_READ and DATA_WRITE), ran one Code Execution, one Shell (create, execute, pause, resume, snapshot, delete) and one Computer Use lifecycle with code that prints MARKER-4f2a, and read the entries back:
gcloud logging read 'protoPayload.serviceName="aiplatform.googleapis.com" AND protoPayload.methodName:"SandboxEnvironment"' --freshness=1h| Log | Methods that appeared |
|---|---|
| Admin Activity | CreateSandboxEnvironment, DeleteSandboxEnvironment, PauseSandboxEnvironment, ResumeSandboxEnvironment, SnapshotSandboxEnvironment, DeleteSandboxEnvironmentSnapshot (and AutoDeleteSandboxEnvironment when a ttl ran out, and Create/DeleteSandboxEnvironmentTemplate) |
| Data Access | ExecuteSandboxEnvironment, GetSandboxEnvironment, ListSandboxEnvironments, GetSandboxEnvironmentSnapshot, AuthorizeSandboxEnvironmentAccess |
- Pause and resume are logged, as Admin Activity. The general audit-logging page leaves them out and the sandbox overview lists them; the overview is right.
- The code is not logged. A search for
MARKER-4f2afound 0 entries. AnExecuteSandboxEnvironmententry has who called, from where and which sandbox, and its request holds only the sandbox name: no code, no output. - Computer Use shows up as authorization checks. The CDP commands I sent are not
executecalls: the only trace wasAuthorizeSandboxEnvironmentAccess.
Entries appeared within a minute or two, and some operations are logged more than once. The Data Access logs add ingestion cost, small here; I turned them off afterwards.
Results summary
| Claim or question | Result |
|---|---|
| Isolation | gVisor (4.19.0-gvisor) in Code Execution and Shell; not fingerprinted in Computer Use or custom containers |
| ”Under a second” to create | 1.0 to 2.4 s from warm; 142 s the first time in a project |
| Shell “about 20 s” | About 19 s without a template, 1.6 to 3.0 s with one |
| Sizes | Shell 0.5 vCPU / 0.5 GiB, Computer Use 2 / 4, Code Execution 2 GiB inside |
| Default network | Off. On: public internet, no metadata server, no private ranges |
| Default expiry | Code Execution never, Shell and Computer Use 2 h; execute doesn’t reset it |
| Code Execution | JavaScript works, no pip, 101 MiB input accepted |
| Pause keeps | The process, files, package and boot id; a command on a paused sandbox resumes it |
| Snapshot | Same as pause, into a new sandbox in 4.5 to 8 s; REST has no size or parent |
| Computer Use | Raw CDP and a Gemini loop work; noVNC served on port 5091 |
| Custom containers | A server on a declared port; no server still reaches RUNNING; root isn’t rejected |
| Audit | Lifecycle and execute logged; code and CDP commands not |
Monitoring
There’s no sandbox view in the Google Cloud console. The Agent Runtime page (Agents, Deployments) says “No agent instances” while the instance holding my sandboxes exists:
What the console does show:
-
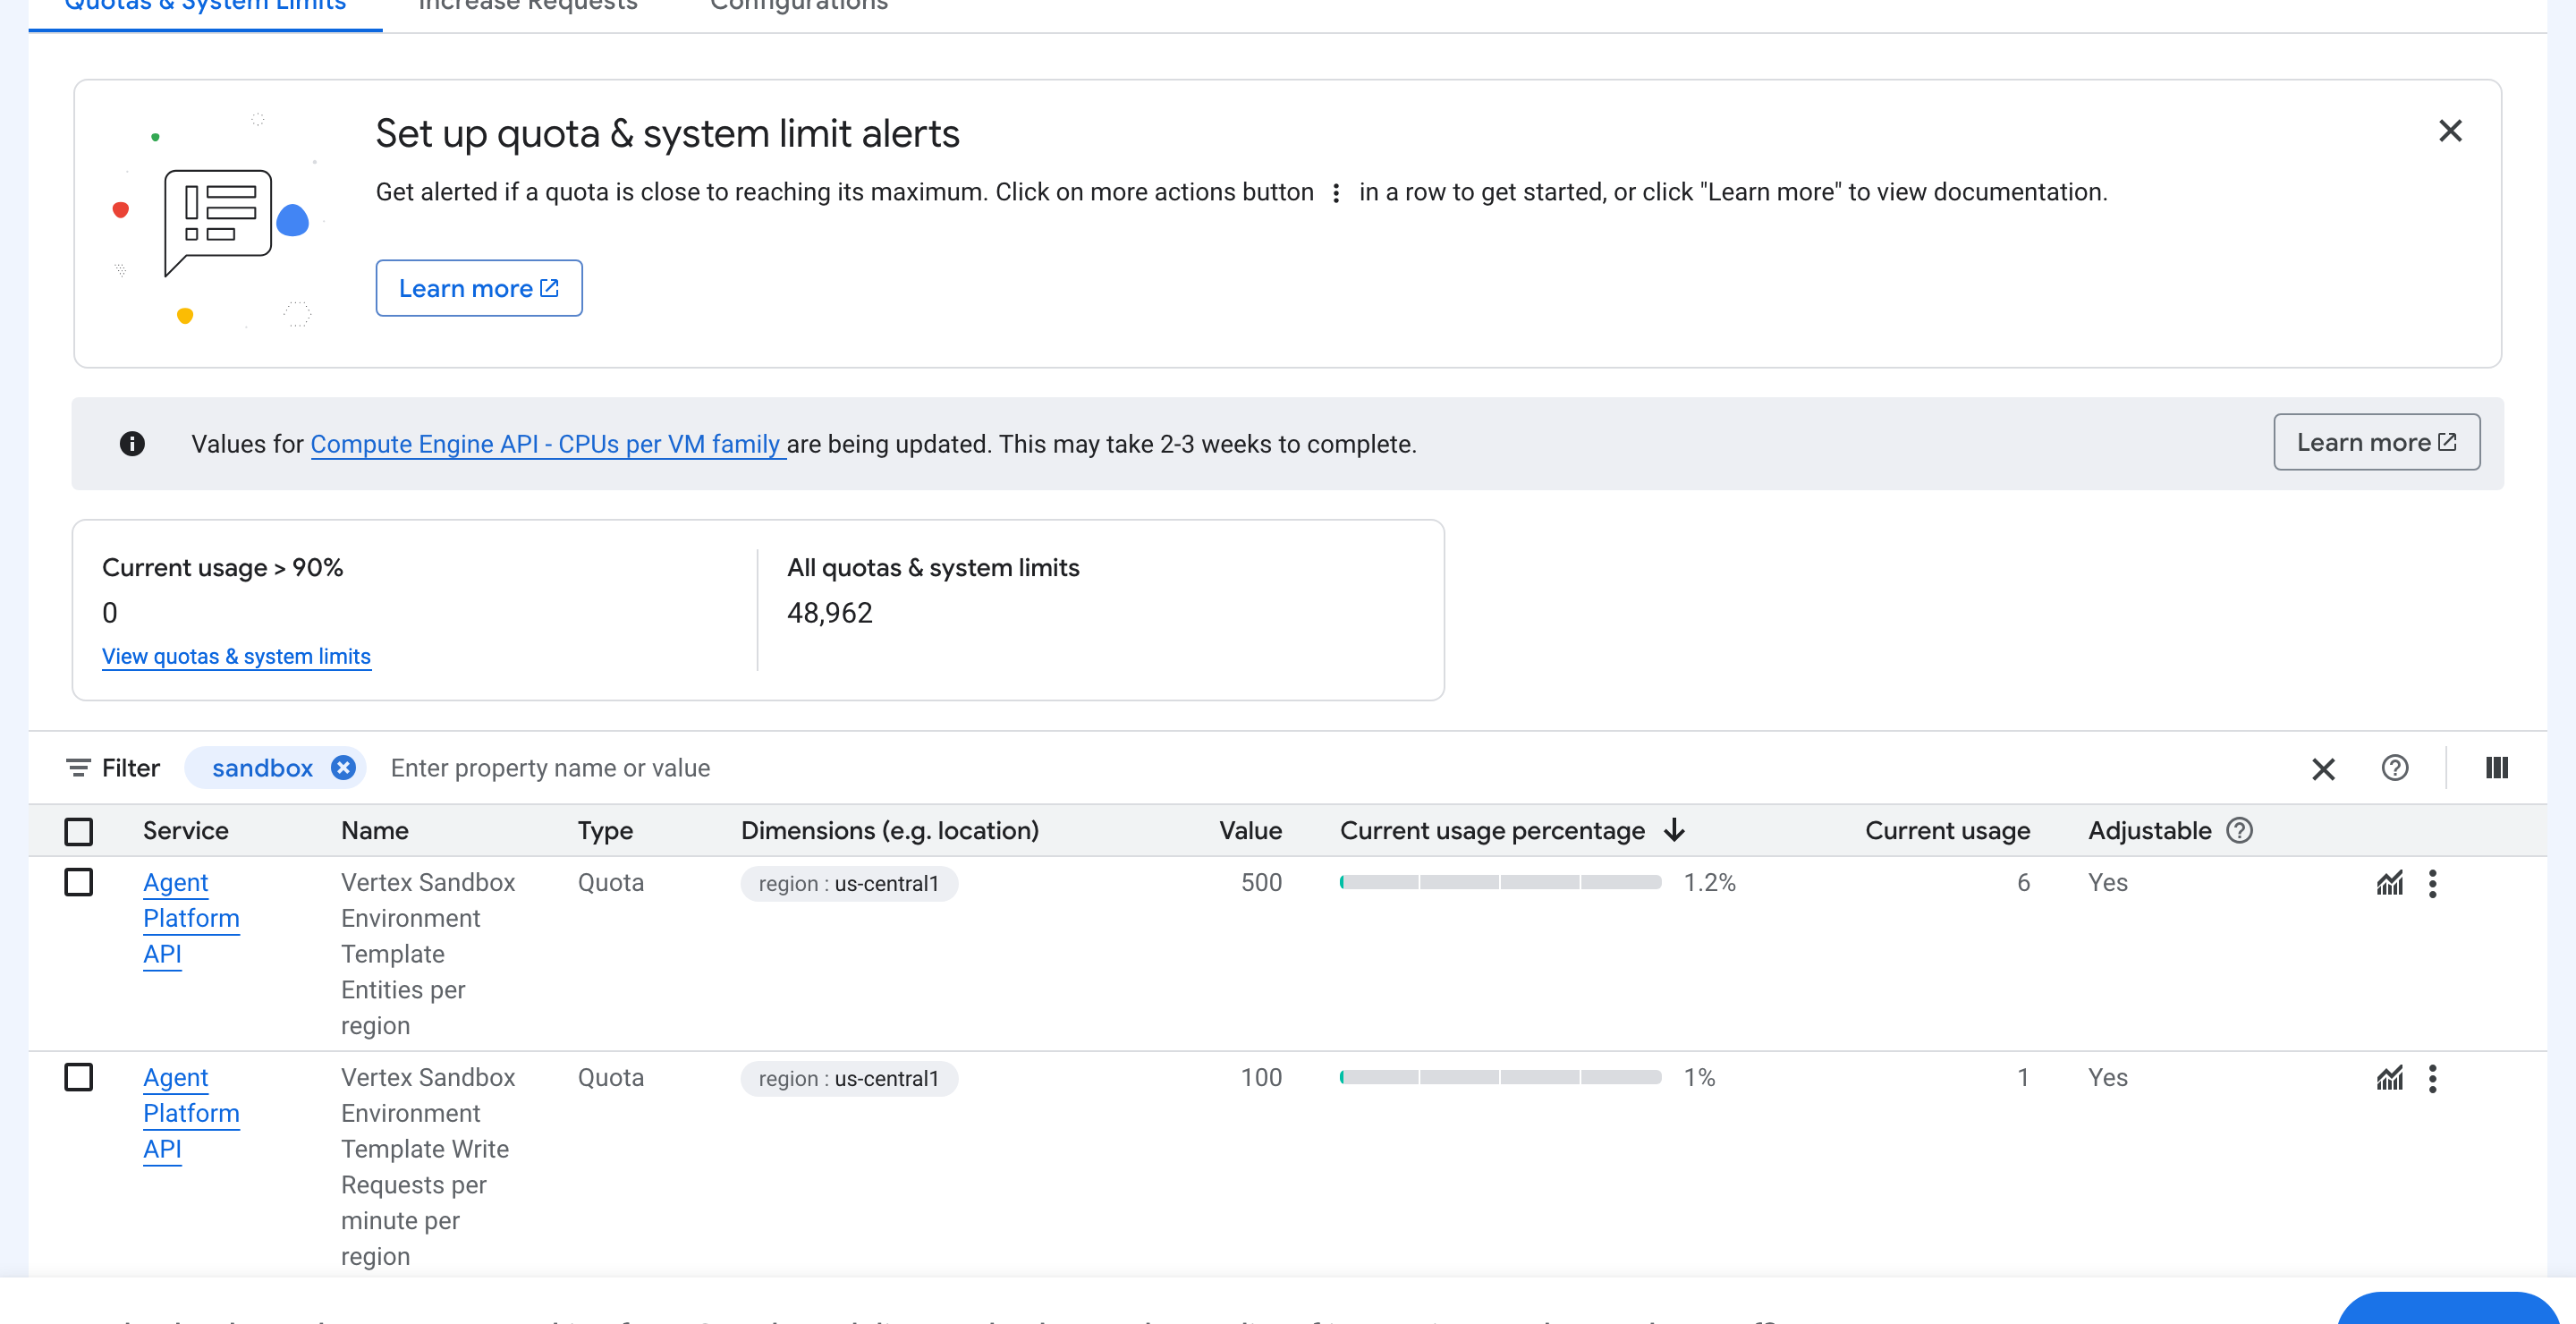
Quotas (IAM & Admin, filtered by “sandbox”): the docs publish quotas for Code Execution only, but the project has rows for the whole family, per region: 500 sandbox entities, 500 template entities, 400 sandbox write requests per minute, 100 template write requests per minute, and 500 execute requests per minute.
-
Logs Explorer: the audit entries from Test 9. Nothing from inside a sandbox: stdout and stderr aren’t collected.
-
Cloud Monitoring: I listed the 373
aiplatform.googleapis.commetric types in the project. None is about sandboxes; thereasoning_engineones cover deployed agents. -
Billing > Reports groups cost by SKU, but it lags: about nine hours after my first sandboxes the report still ended at November 13, and none of the SKUs on its first page was an Agent Platform one.
Pricing
The price page bills sandbox environments on two SKUs, Agent Compute at $0.085 per vCPU-hour and Agent Memory at $0.009 per GiB-hour, rounded to the second, and the docs say sandboxes bill “while they exist”. Shell and custom containers aren’t itemised separately, so I priced them the same way. Agent Storage is $0.30 per GiB-month. With the sizes from Test 1:
| Sandbox | Size | Per hour | Default expiry | Worst case if forgotten |
|---|---|---|---|---|
| Shell | 0.5 vCPU, 0.5 GiB | $0.047 | 2 h | $0.09 |
| Computer Use | 2 vCPU, 4 GiB | $0.206 | 2 h | $0.41 |
| Code Execution (docs size) | 2 vCPU, 1.5 GiB | $0.184 | none | $4.40 a day |
| Code Execution, 4 vCPU, 4 GiB | 4 vCPU, 4 GiB | $0.376 | none | $9.02 a day |
| Custom container (my template) | 1 vCPU, 500 Mi | $0.089 | not measured |
These are list prices from the price sheet; I couldn’t see my own bill (above). What I can’t price:
- Warm pools. Every template holds 10 ready sandboxes by default. If they bill like sandboxes, a Shell template would cost about $0.47 an hour and a Computer Use template about $2.06 an hour, while idle. The docs don’t say. I kept templates alive only while testing, and set a pool of 1 for the custom containers.
- Paused sandboxes and snapshots. The docs say a paused sandbox costs “significantly less”, with no figure, and no page says whether snapshots bill as Agent Storage. I left one running and one paused Shell sandbox side by side for about 40 minutes to compare, which is too short for the daily report anyway.
- Model tokens for Computer Use: the 4-action run used about 30,300 tokens, a few cents at Gemini 3.8 Flash list prices, which double on January 1, 2027.
At list price, the sandbox time of the whole exploration and recording (several dozen short sandboxes) came to well under a dollar. The open question is the warm pools, which could add a few dollars if they bill like sandboxes. To clean up:
python teardown.py # sandboxes, snapshots, templates, the instance, the repo, the service account, audit logsVerdict
What works
Creating a sandbox is quick and uniform: two seconds from a warm pool, the same API for four types, and gVisor in the two types I could fingerprint. The defaults are cautious: no network, no metadata server even with the network on, an unprivileged user in Shell. Pause is better than documented: a process, a browser page and a package all came back, and a snapshot, which the docs say keeps memory, restores into a fresh sandbox in seconds. Computer Use is simple to drive with a loop of about 100 lines, and the audit log answers who created, paused and ran what.
What doesn’t, yet
You can’t see any of it in the console, and the docs and the product disagree in many places: sizes, the 100 MB cap, what a pause keeps, what an execute does to the expiry, the quotas. A Code Execution sandbox that never expires is a billing risk, and “internet access” is a single switch with no allowlist. resume() returns before the sandbox answers, a stale connection after a Computer Use resume answers only Bad Gateway, and the snapshot resource lacks the size and parent fields the reference lists. Template pools are billed or not, nobody says.
Who should use it
Use it when you want sandboxes as an API without running a cluster, and when two-second creation and pause and resume matter more than a console. Set a ttl on everything, keep templates few and delete them, put your own firewall in front if you open the network, and read the audit log, not the code, for who did what. If you need to see sandboxes in a console or run them next to your own workloads, part 4 looks at Cloud Run sandboxes, and parts 5 and 6 at GKE.