Google AX on Amazon EKS: Stress Testing Two Nodes
By Fabio Douek
Jump to section
- Overview
- Architecture
- Setup
- Step 1: Container Insights, metrics only
- Step 2: A sampler for the fine-grained view
- Step 3: Start every test from zero
- Testing
- Test 1: Density ceiling
- Test 2: Latency under concurrency
- Test 3: Wake on request, and why CPU limits matter
- Test 4: Control-plane load
- Test 5: Noisy neighbors
- Test 6: Snapshot storm
- What CloudWatch saw
- Results summary
- Pricing
- Cleanup
- Verdict
Explain (TLDR) like I am...
Imagine a toy shelf with room for lots of robot helpers. I kept adding tiny robots until the shelf said "no more room", and it fit about one hundred and fifty, as long as each robot asked for only a little bit of energy.
The surprise was that robots with very little energy wake up slowly from a nap, while robots with more energy pop awake almost instantly. And when one robot runs around wildly, its neighbors slow down too.
This is a capacity and performance assessment of a self-hosted agent runtime on a fixed, deliberately small budget of two machines. The relevant findings for planning are the hard ceiling on concurrent sandboxes, the latency an end user would experience, and the operational costs that scale with use.
Two cost exposures stand out: snapshot uploads leave the network through a metered gateway unless a free storage endpoint is configured, and the monitoring add-on bills per observation while it runs. Neither is visible until the bill arrives.
I stress-tested the system along six axes, each with a controlled load and measured outcomes: capacity, latency under concurrency, wake time, control-plane load, interference between neighbors, and storage bursts. The findings are from single runs on two nodes, so treat them as a baseline, not a population study.
Main findings: capacity is set by CPU bookings, not memory; very small CPU limits make wake-up twenty times slower; and CPU-heavy neighbors slowed other sandboxes by about seventy percent despite their limits.
Load tests have a way of surfacing the gap between what we hoped a system would do and what it actually does, and that gap can feel like a letdown. Here it mostly felt reassuring: nothing fell over, and the limits were easy to name.
The harder conversation is about the trade-offs: packing more sandboxes in means each one wakes more slowly, and neighbors affect each other more than the limits suggest. Those are choices a team should make together, with the numbers in front of them.
Think of two small rehearsal rooms and as many musicians as you can fit. The rooms took about a hundred and fifty, but each one tuned up slowly when it barely had room to breathe, while a player with space was ready in a tenth of a second.
Put a drummer who never stops in the next room and everyone's timing drifts by about seventy percent, walls or no walls. The stage manager, the control plane, never broke a sweat.
The headline: two modest nodes held about a hundred and fifty idle agent sandboxes, woke a suspended one in about a tenth of a second at a full CPU, and the control plane stayed around half a core at peak.
The honest positioning is "dense for idle, fast for awake, plan for neighbors". It is a strong story for platform teams sizing an agent fleet, as long as they size CPU limits deliberately and add a free S3 endpoint before snapshots start flowing.
 See the source code here: google-ax-stress
Overview
Google’s numbers for Agent Substrate, the runtime under Google AX, are big: the GKE launch post promises sub-500 ms resume, over 500 suspend/resume activations per second, and over 1,000 dormant agents per host. None of them comes with hardware, agent size or method, and the repository has the benchmark scenarios but no results. The one independent test I found, a field test on two GKE c3-standard-4 nodes, measured 220 ms resume for few-megabyte agents and 3.5 s at 1 GiB. Upstream’s own PR #1934 reported 1.3 to 1.4 s wake on a two-node cluster.
So I measured my own, in this last part of the series, on the same cluster: two m7i.xlarge nodes on Amazon EKS 1.37, AX a496fc1, Substrate d3f2363. That’s the cluster from part 1, unchanged, and the budget I held to: no extra nodes. Six tests, each pushing one dimension: density, latency under concurrency, wake on request, control-plane load, noisy neighbors, and a snapshot storm. Every chart below is drawn from those runs by the companion code.
How to read the numbers: unless a test says otherwise, latencies are timed from my laptop through the ax CLI, so they include its round trip to the cluster, the way an AX user experiences them. Wake-on-request times are measured inside the cluster with curl. Each test ran once, on an otherwise empty cluster.
Architecture
Setup
Step 1: Container Insights, metrics only
The Terraform from the install post has an opt-in container_insights variable that adds the Amazon CloudWatch Observability add-on. I turned off its container logs and Application Signals (both bill on their own), and set preserve = false, because the EKS module otherwise leaves the agent running after you remove it from the add-on map:
amazon-cloudwatch-observability = {
  configuration_values = jsonencode({
    containerLogs = { enabled = false }
    manager       = { applicationSignals = { autoMonitor = { monitorAllServices = false } } }
  })
  pod_identity_association = [{ role_arn = aws_iam_role.cloudwatch[0].arn, service_account = "cloudwatch-agent" }]
  preserve = false
}
01_metrics.py applies it and records the start of the test window:
== terraform apply -var container_insights=true
  Creation complete after 47s [id=ax-eks:amazon-cloudwatch-observability]
  Apply complete! Resources: 3 added, 0 changed, 0 destroyed.
== the agent: one pod per node
cloudwatch-agent-bg8m2   1/1   Running   ip-10-40-33-18.ec2.internal
cloudwatch-agent-n5t2d   1/1   Running   ip-10-40-28-182.ec2.internal
Step 2: A sampler for the fine-grained view
Container Insights resolves to one minute. For per-second detail, every test wraps its work in a Sampler that polls each node’s kubelet stats through the API server and writes CPU and memory per pod to CSV:
class Sampler:
    """Polls each node's kubelet stats summary every `every` seconds and writes
    per-pod and per-node CPU (millicores) and memory (MiB) to results/<name>.csv."""
    def _run(self):
        ...
        s = json.loads(kubectl("get", "--raw", f"/api/v1/nodes/{node}/proxy/stats/summary").stdout)
        for pod in s["pods"]:
            if pod["podRef"]["name"].startswith(self.PODS):
                cpu = sum(c["cpu"]["usageNanoCores"] for c in pod["containers"])
Substrate runs runsc inside its worker pods, not as a Kubernetes RuntimeClass, so a worker pod’s numbers are the sum of the sandboxes it hosts. Kubernetes can’t see individual sandboxes; Substrate’s own record of them (kubectl-ate get workers) shows what each worker has booked.
Step 3: Start every test from zero
One bug in my harness shaped this step. My first runs cleaned up between tests by listing tasks and deleting them, and left about a hundred density-test tasks running, which then crowded every later test into no worker has room errors. The cause: ax get tasks returns at most 50 tasks. AX’s ListTasks defaults to a limit of 50, and the CLI has no flag to ask for more. Every test now starts by deleting until nothing is listed, and the numbers below are from clean re-runs:
def delete_all(prefix=""):
    """`ax get tasks` returns at most 50 tasks, so list and delete until nothing is left."""
    while True:
        names = [t for t in list_tasks() if t.startswith(prefix)]
        if not names:
            return
        delete_names(names)
Testing
Test 1: Density ceiling
02_density.py adds idle tasks (sleep infinity, cpu 50m, memory 64Mi) ten at a time and resumes each batch, until Substrate refuses:
for start in range(1, MAX + 1, BATCH):
    names = [f"st-d-{i:03d}" for i in range(start, start + BATCH)]
    parallel(lambda n: create(n, cpu="50m", memory="64Mi"), names, 10)
    res = parallel(lambda n: timed_call(ax, "resume", "task", n), names, 10)
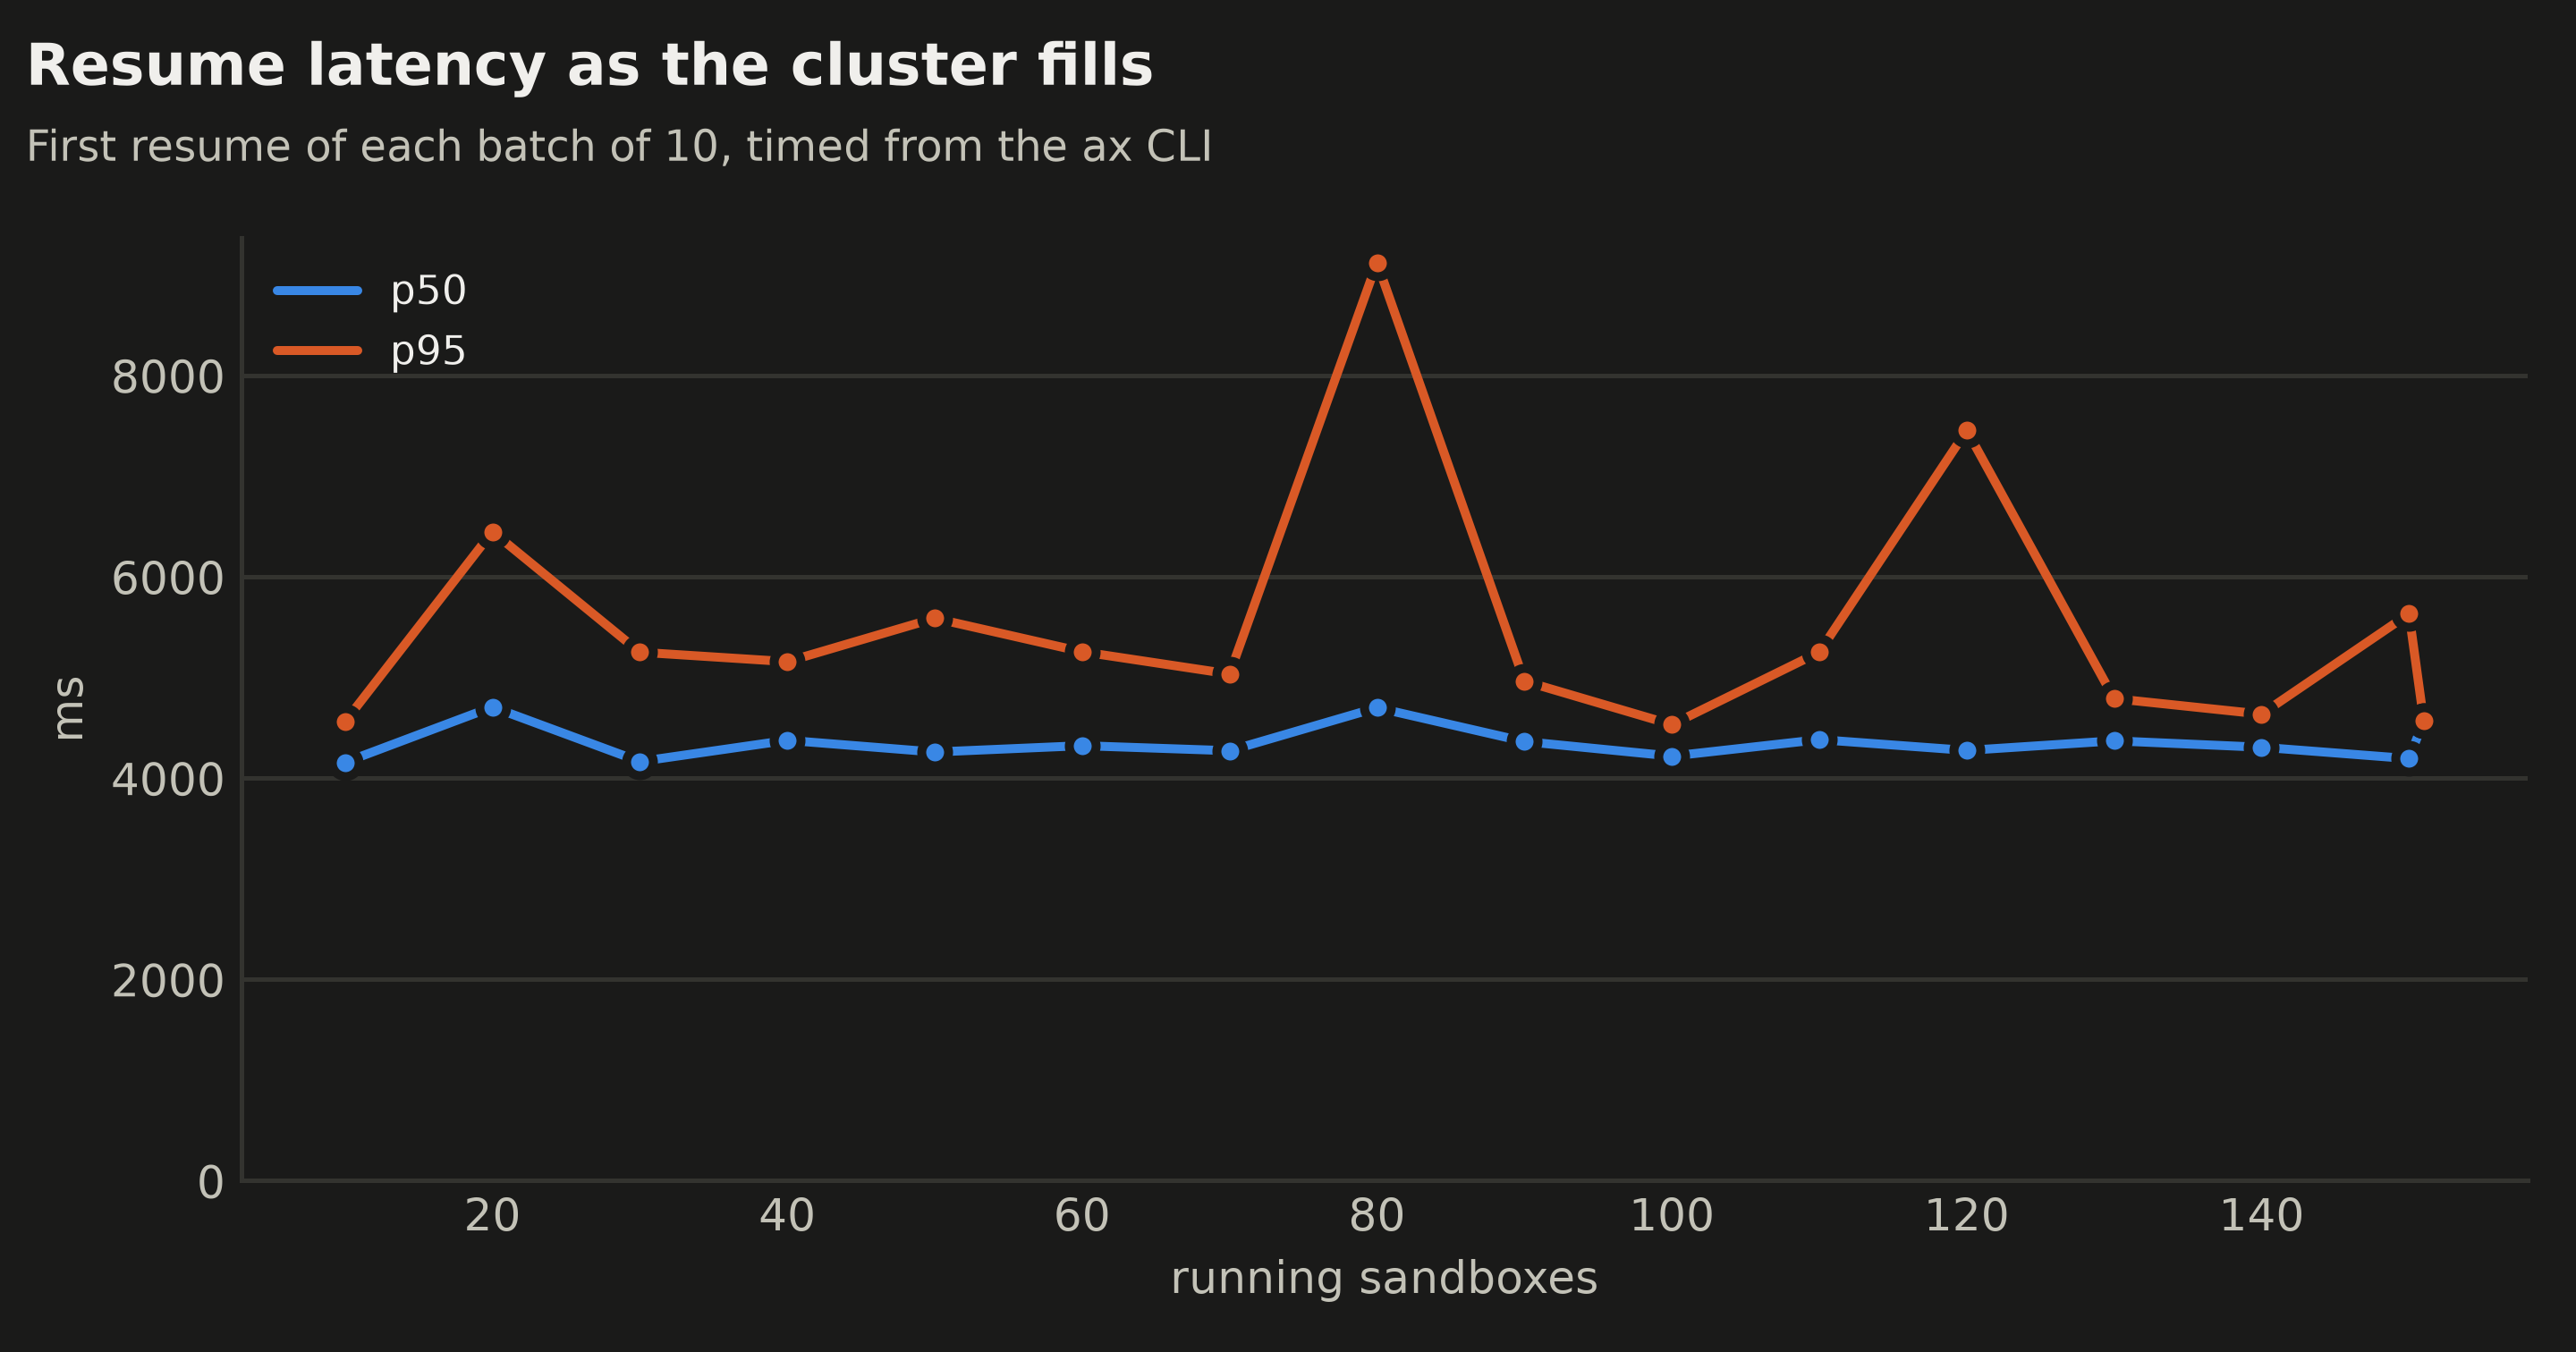
10 running (+10/10) resume p50 4156 ms node memory 1.6 / 1.6 GiB
50 running (+10/10) resume p50 4259 ms node memory 1.8 / 1.8 GiB
100 running (+10/10) resume p50 4218 ms node memory 2.1 / 2.2 GiB
150 running (+10/10) resume p50 4193 ms node memory 2.4 / 2.5 GiB
151 running (+ 1/10) resume p50 4570 ms node memory 2.5 / 2.5 GiB
refused: no worker has room for the actor
all resumes: n=151 p50 4286 ms, p95 5255, p99 7454, max 9121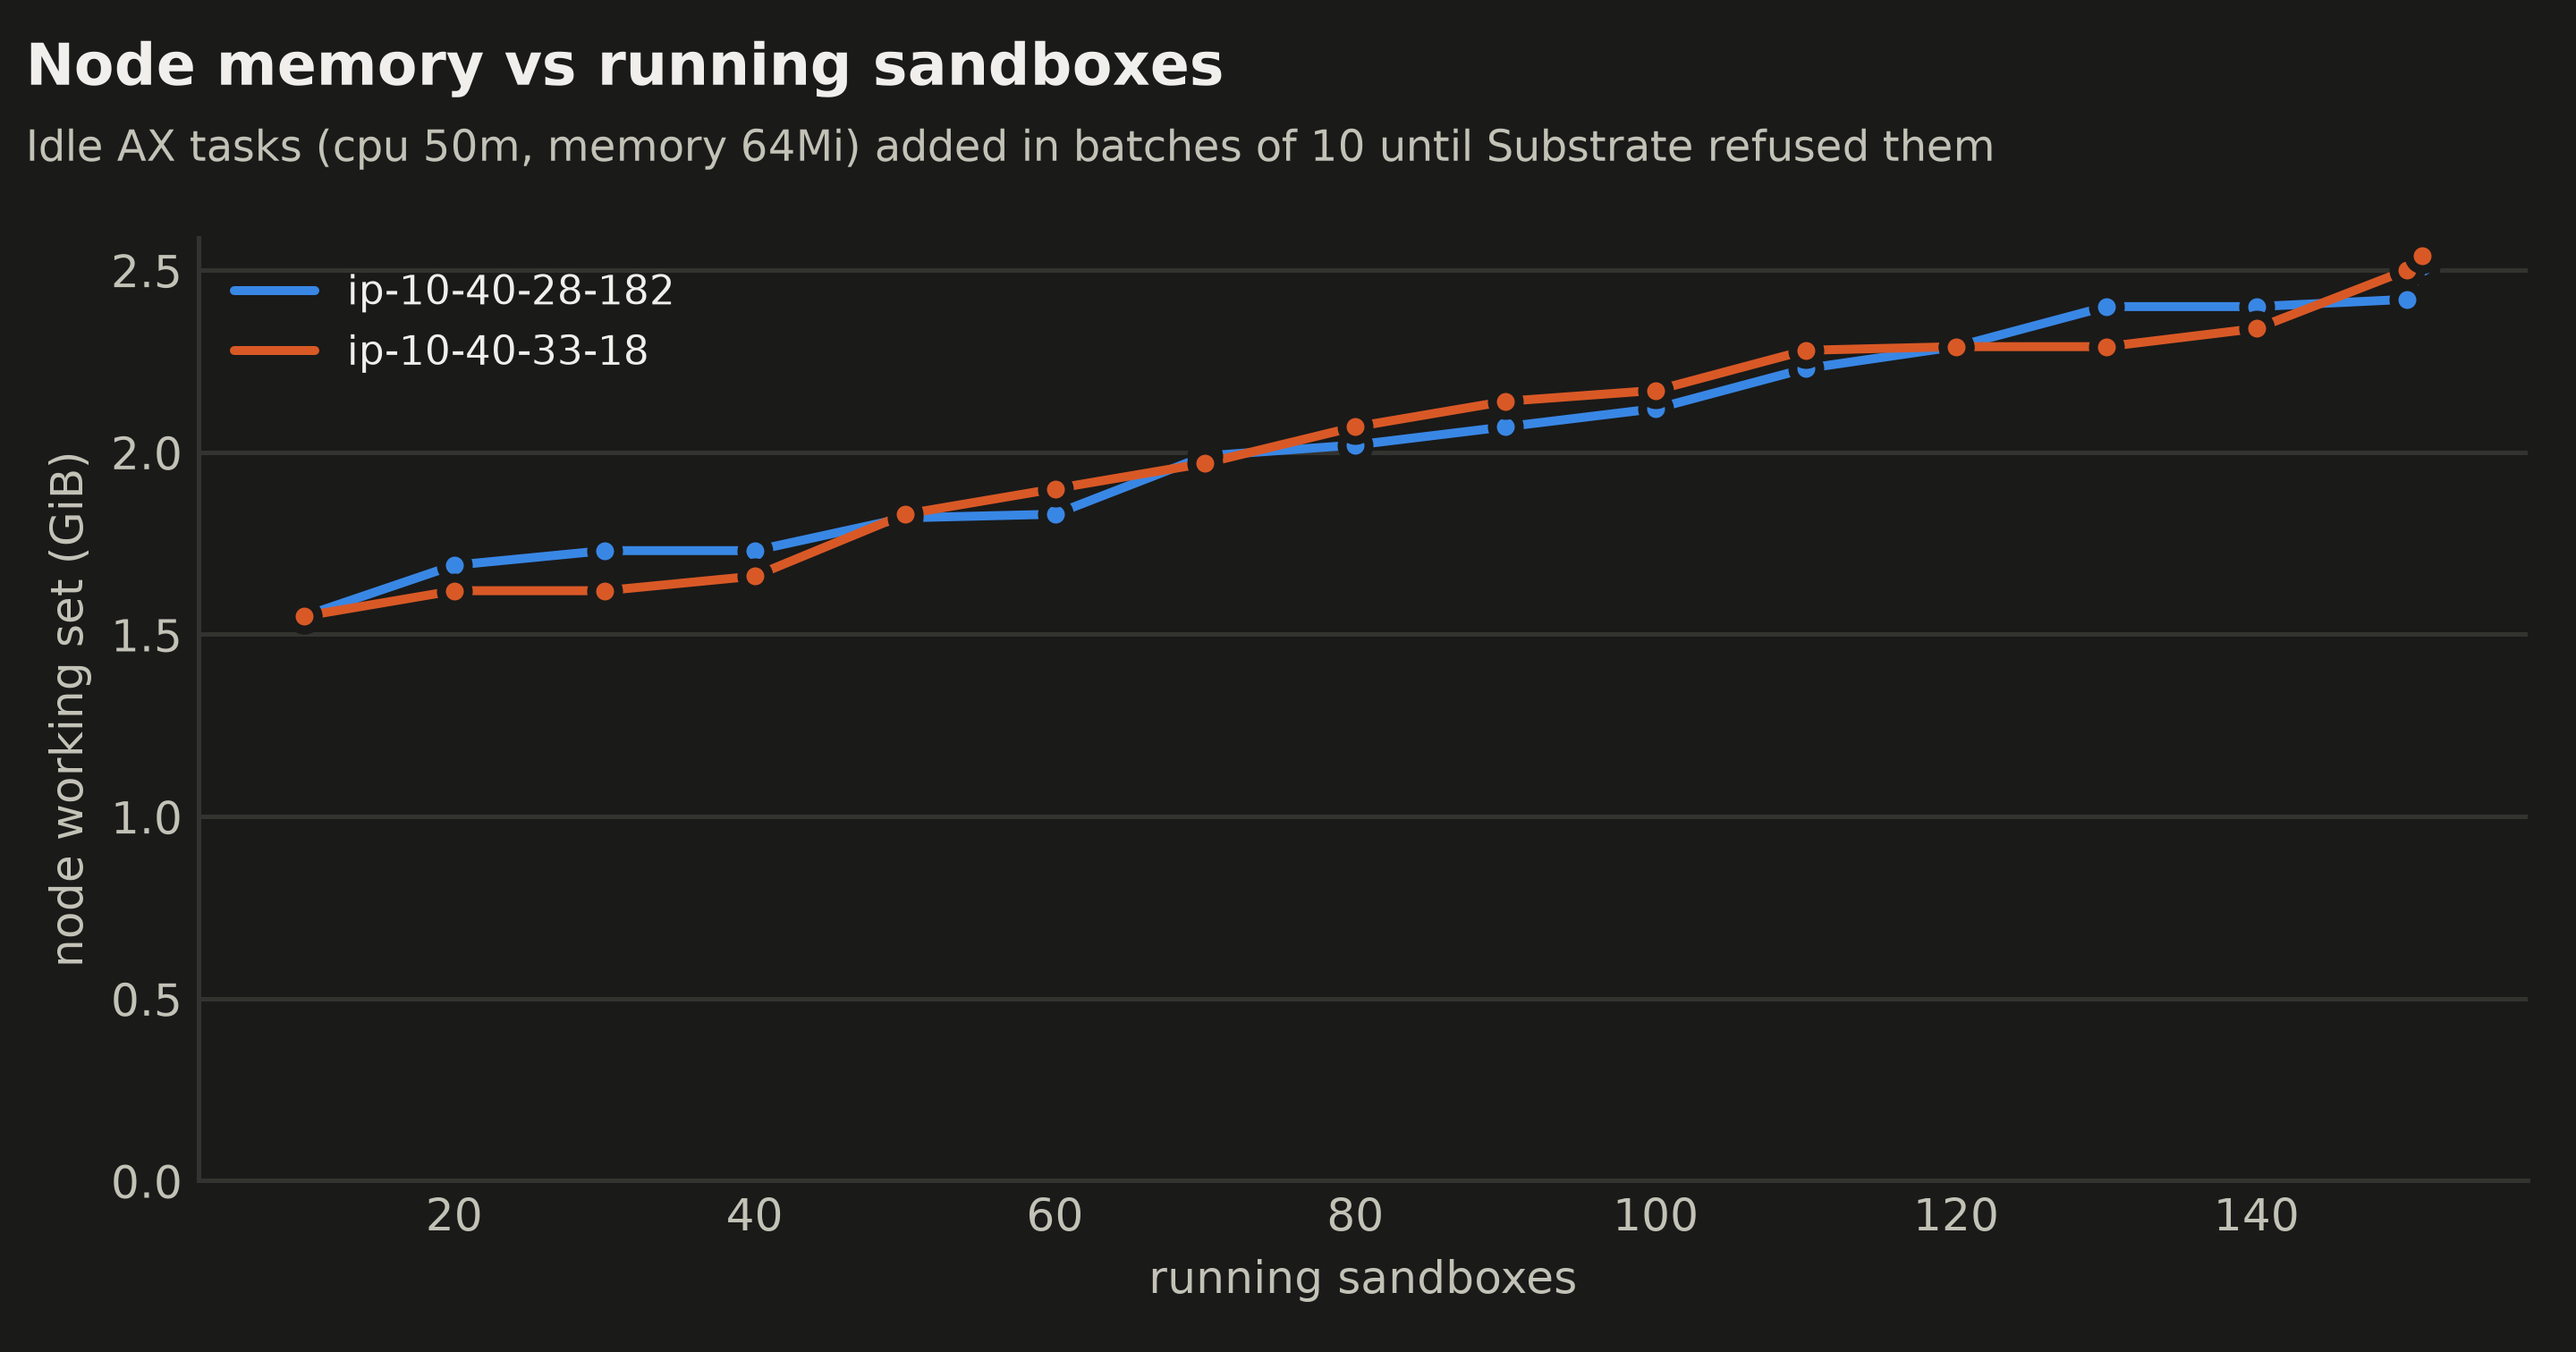
| Running sandboxes | Node memory (GiB, each node) | Resume p50 (ms) |
|---|---|---|
| 10 | 1.6 / 1.6 | 4,156 |
| 50 | 1.8 / 1.8 | 4,259 |
| 100 | 2.1 / 2.2 | 4,218 |
| 151 | 2.5 / 2.5 | 4,570 |
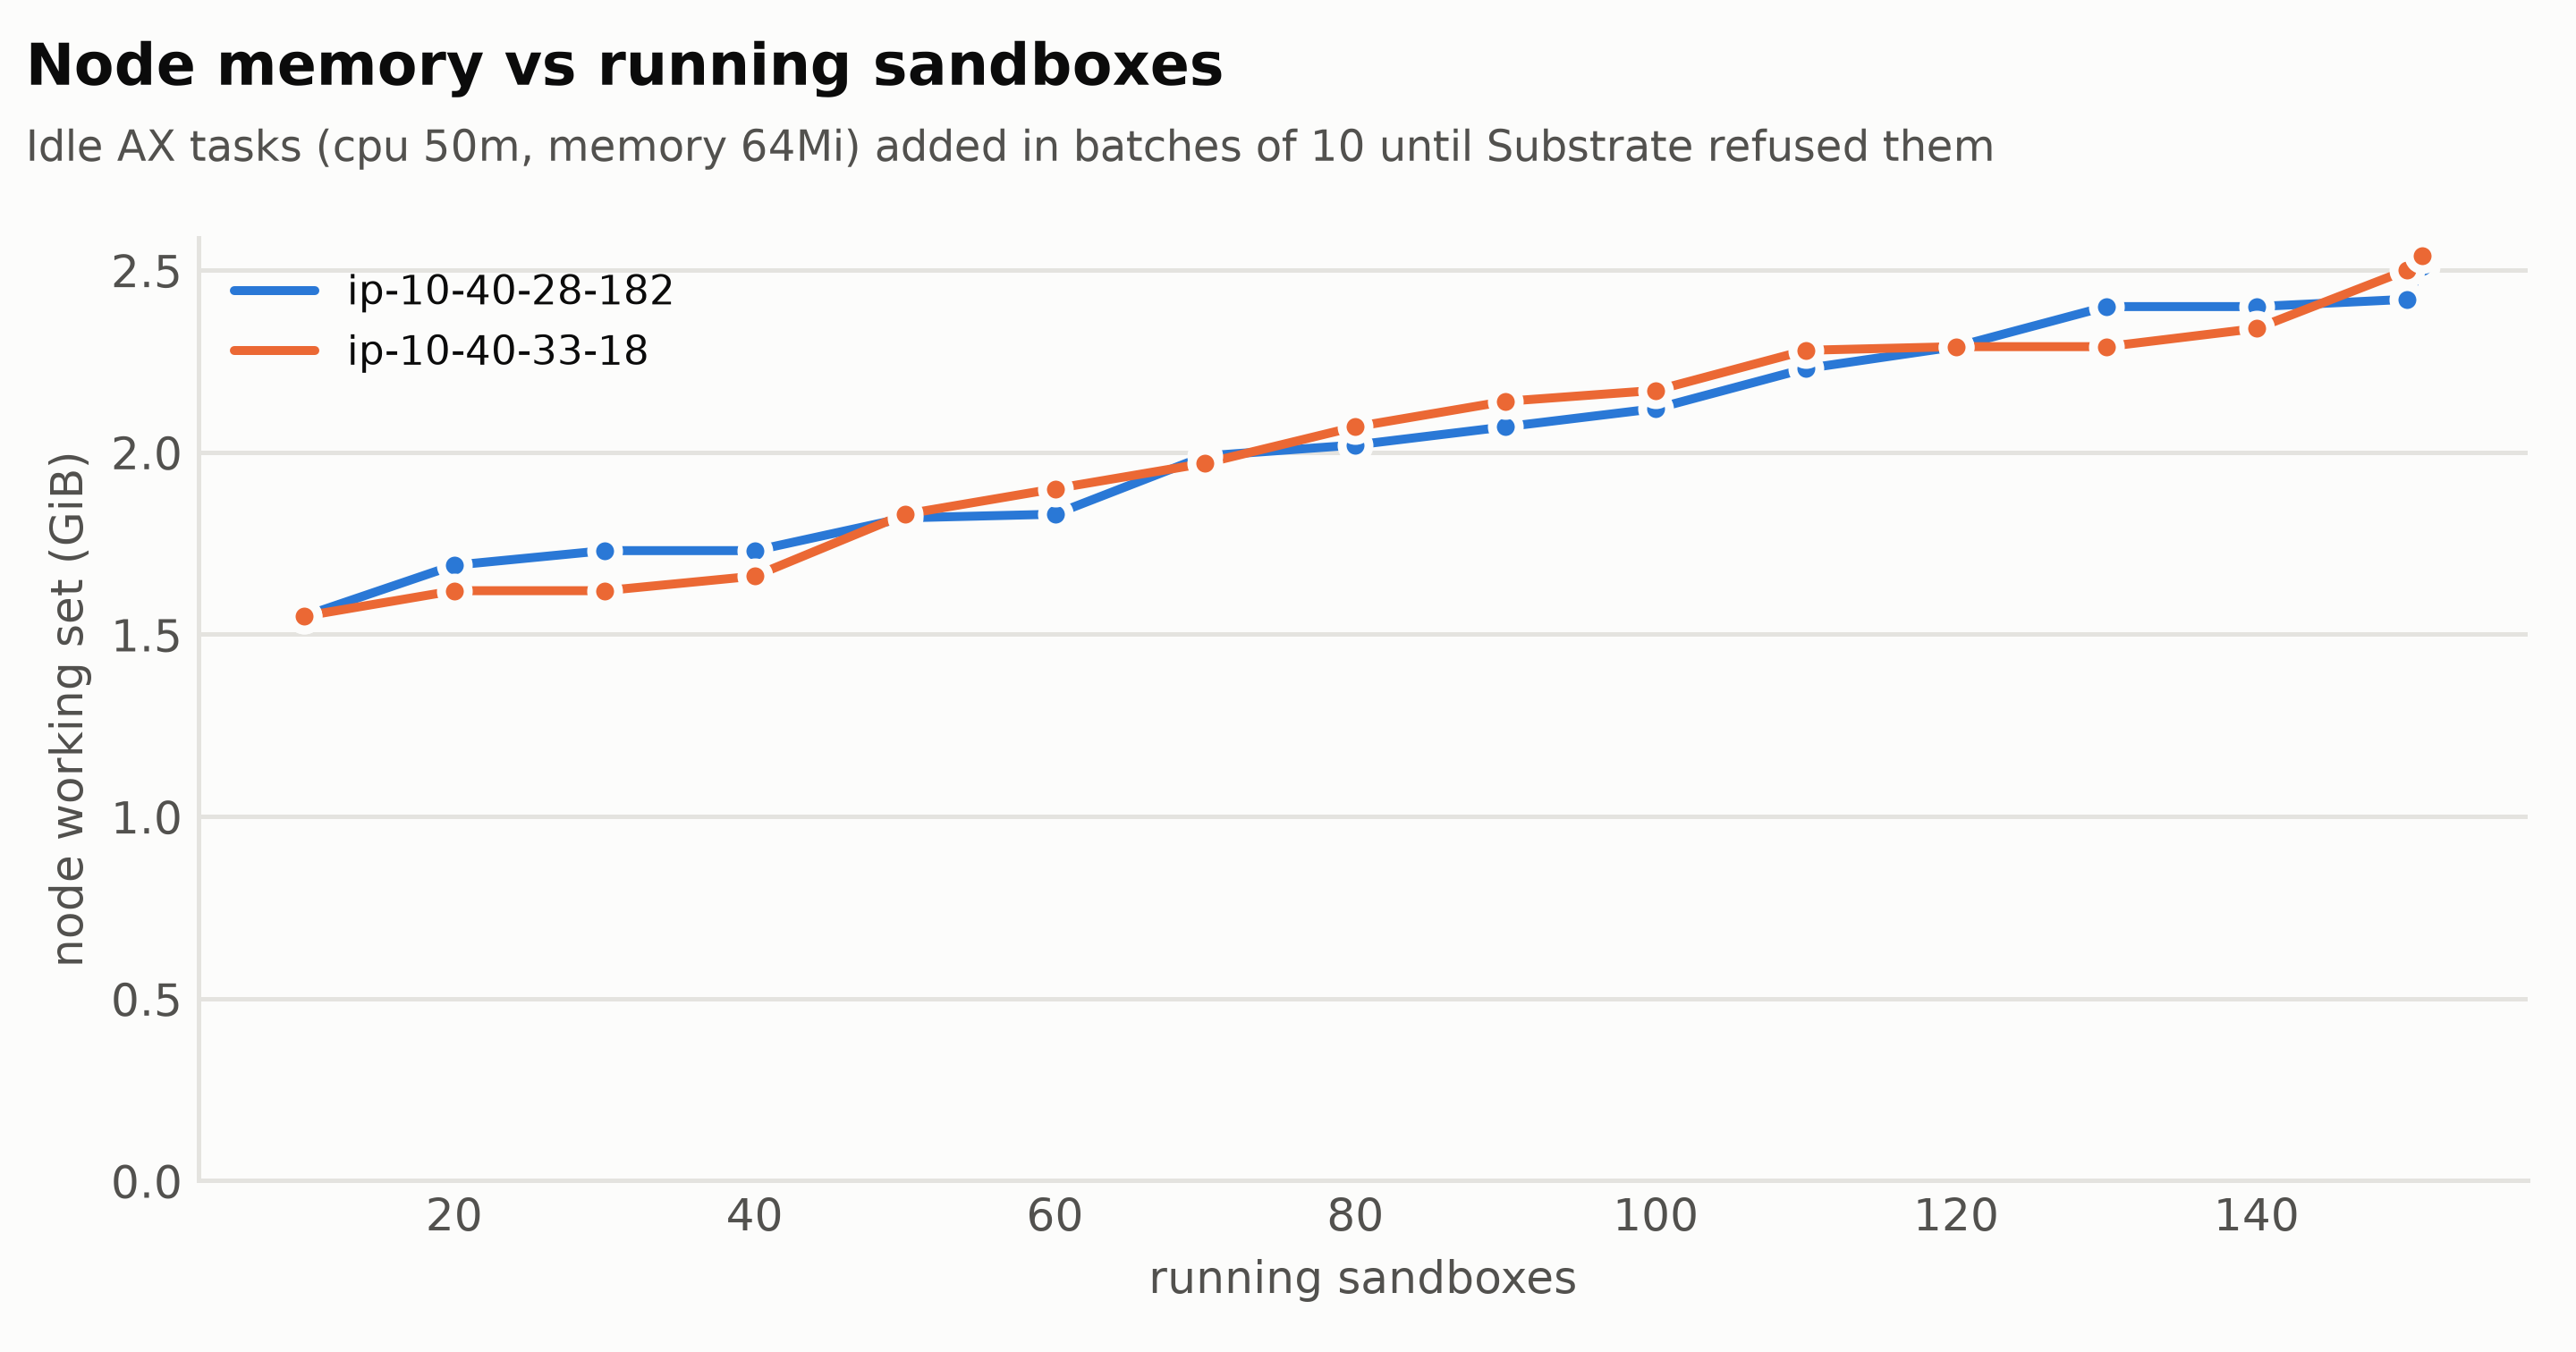
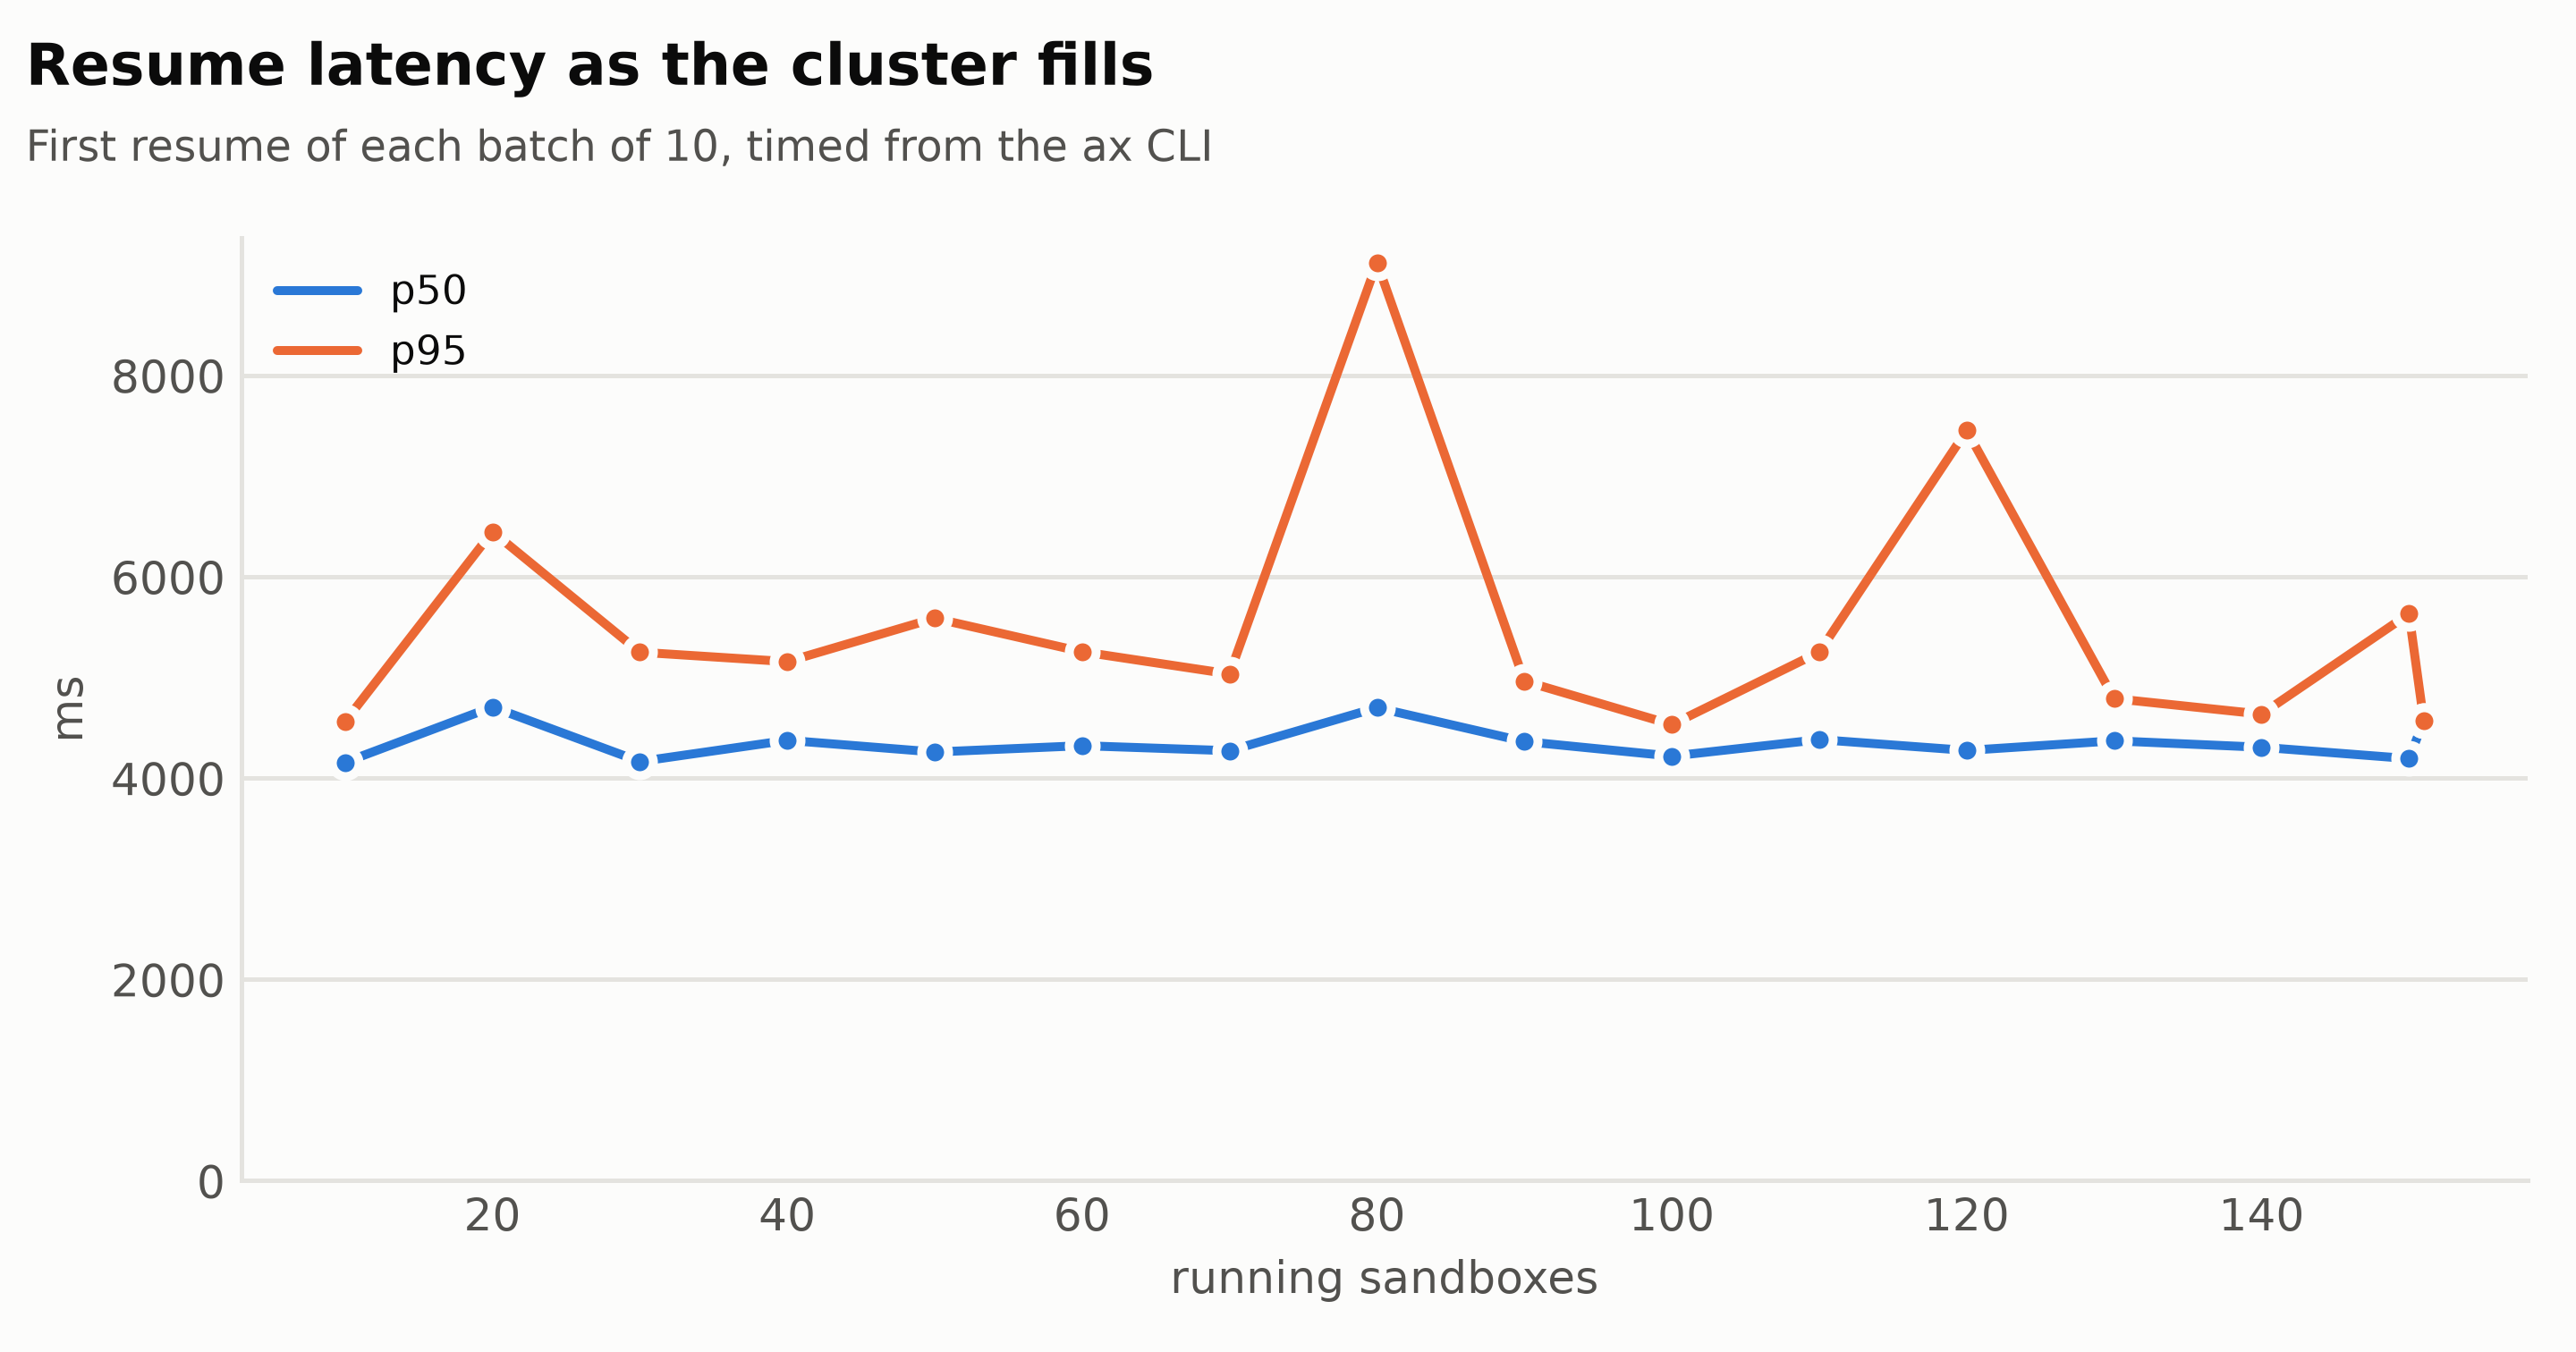
151 sandboxes, then refusals. The ceiling is CPU bookings: each worker books every task’s CPU limit against its node’s allocatable 3.92 CPU, which in theory fits 78 tasks at 50m per worker; in practice the 152nd was refused. Memory barely moved: 151 idle sandboxes added about a gigabyte per node, roughly 13 MiB each. Resume latency stayed flat as the cluster filled, but it was slow, around 4.3 s, and Test 3 shows why: a 50m sandbox boots slowly. For idle agents that rarely run, two small nodes hold a lot. Google’s “1,000 dormant agents per host” counts dormant agents, which hold no sandbox at all; in AX, a suspended task books nothing either.
Test 2: Latency under concurrency
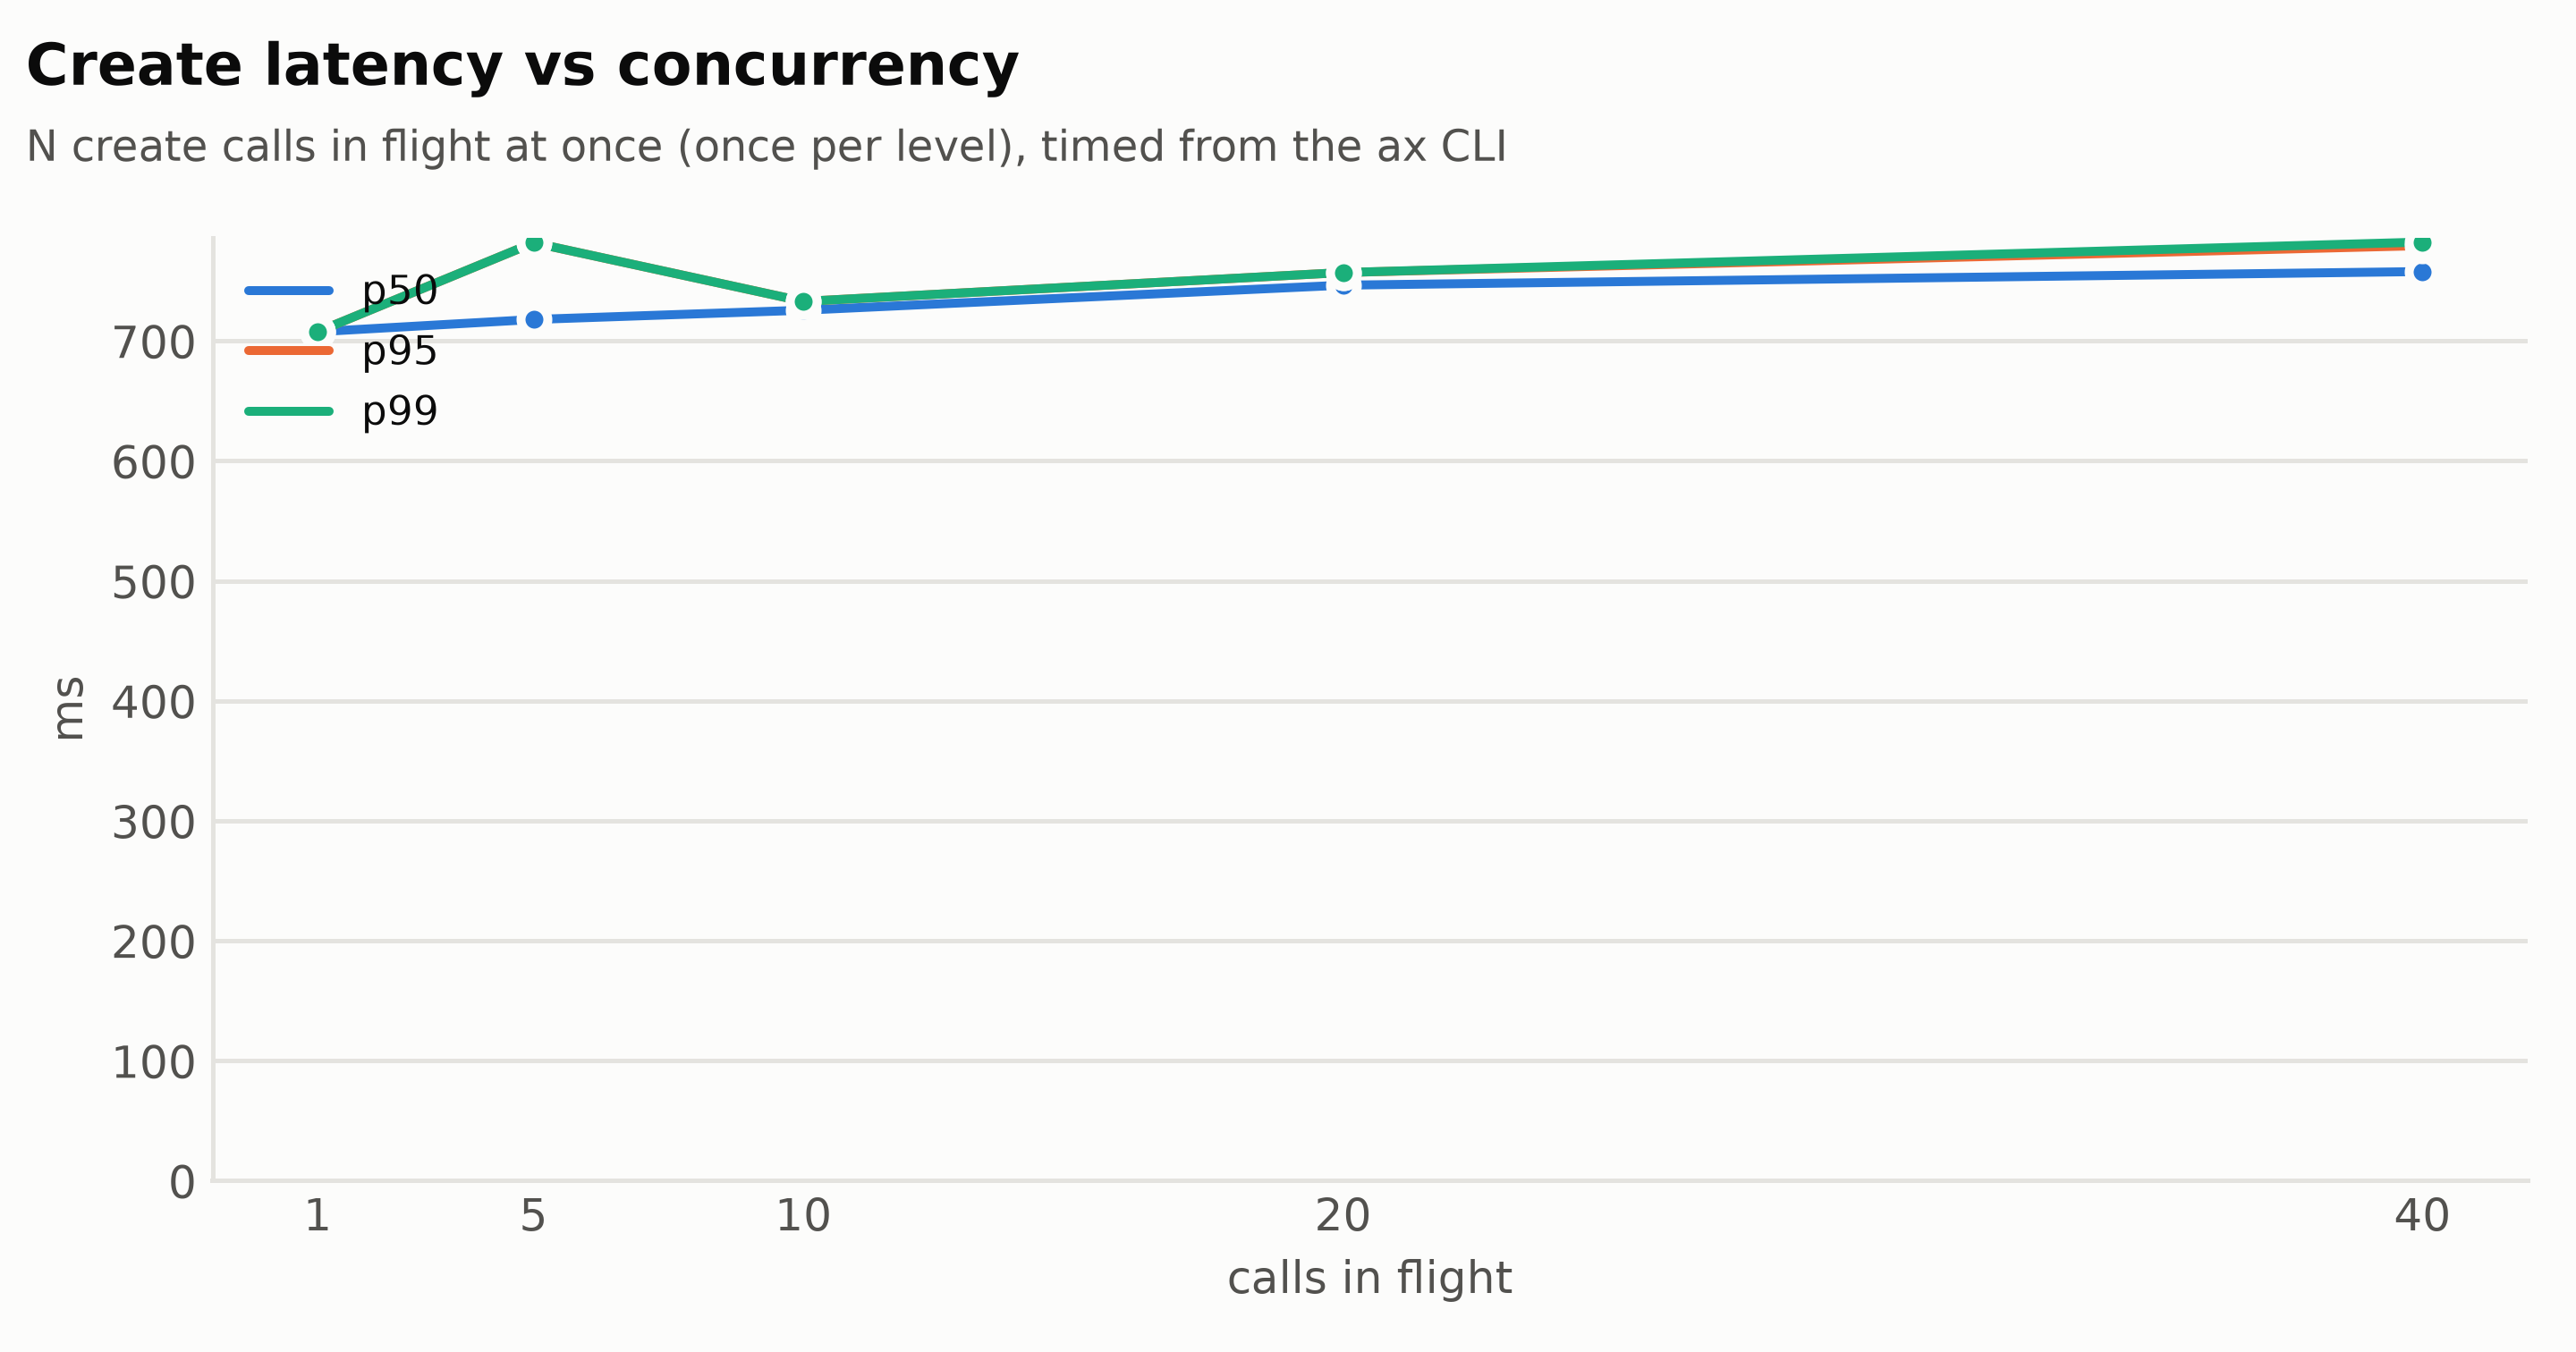
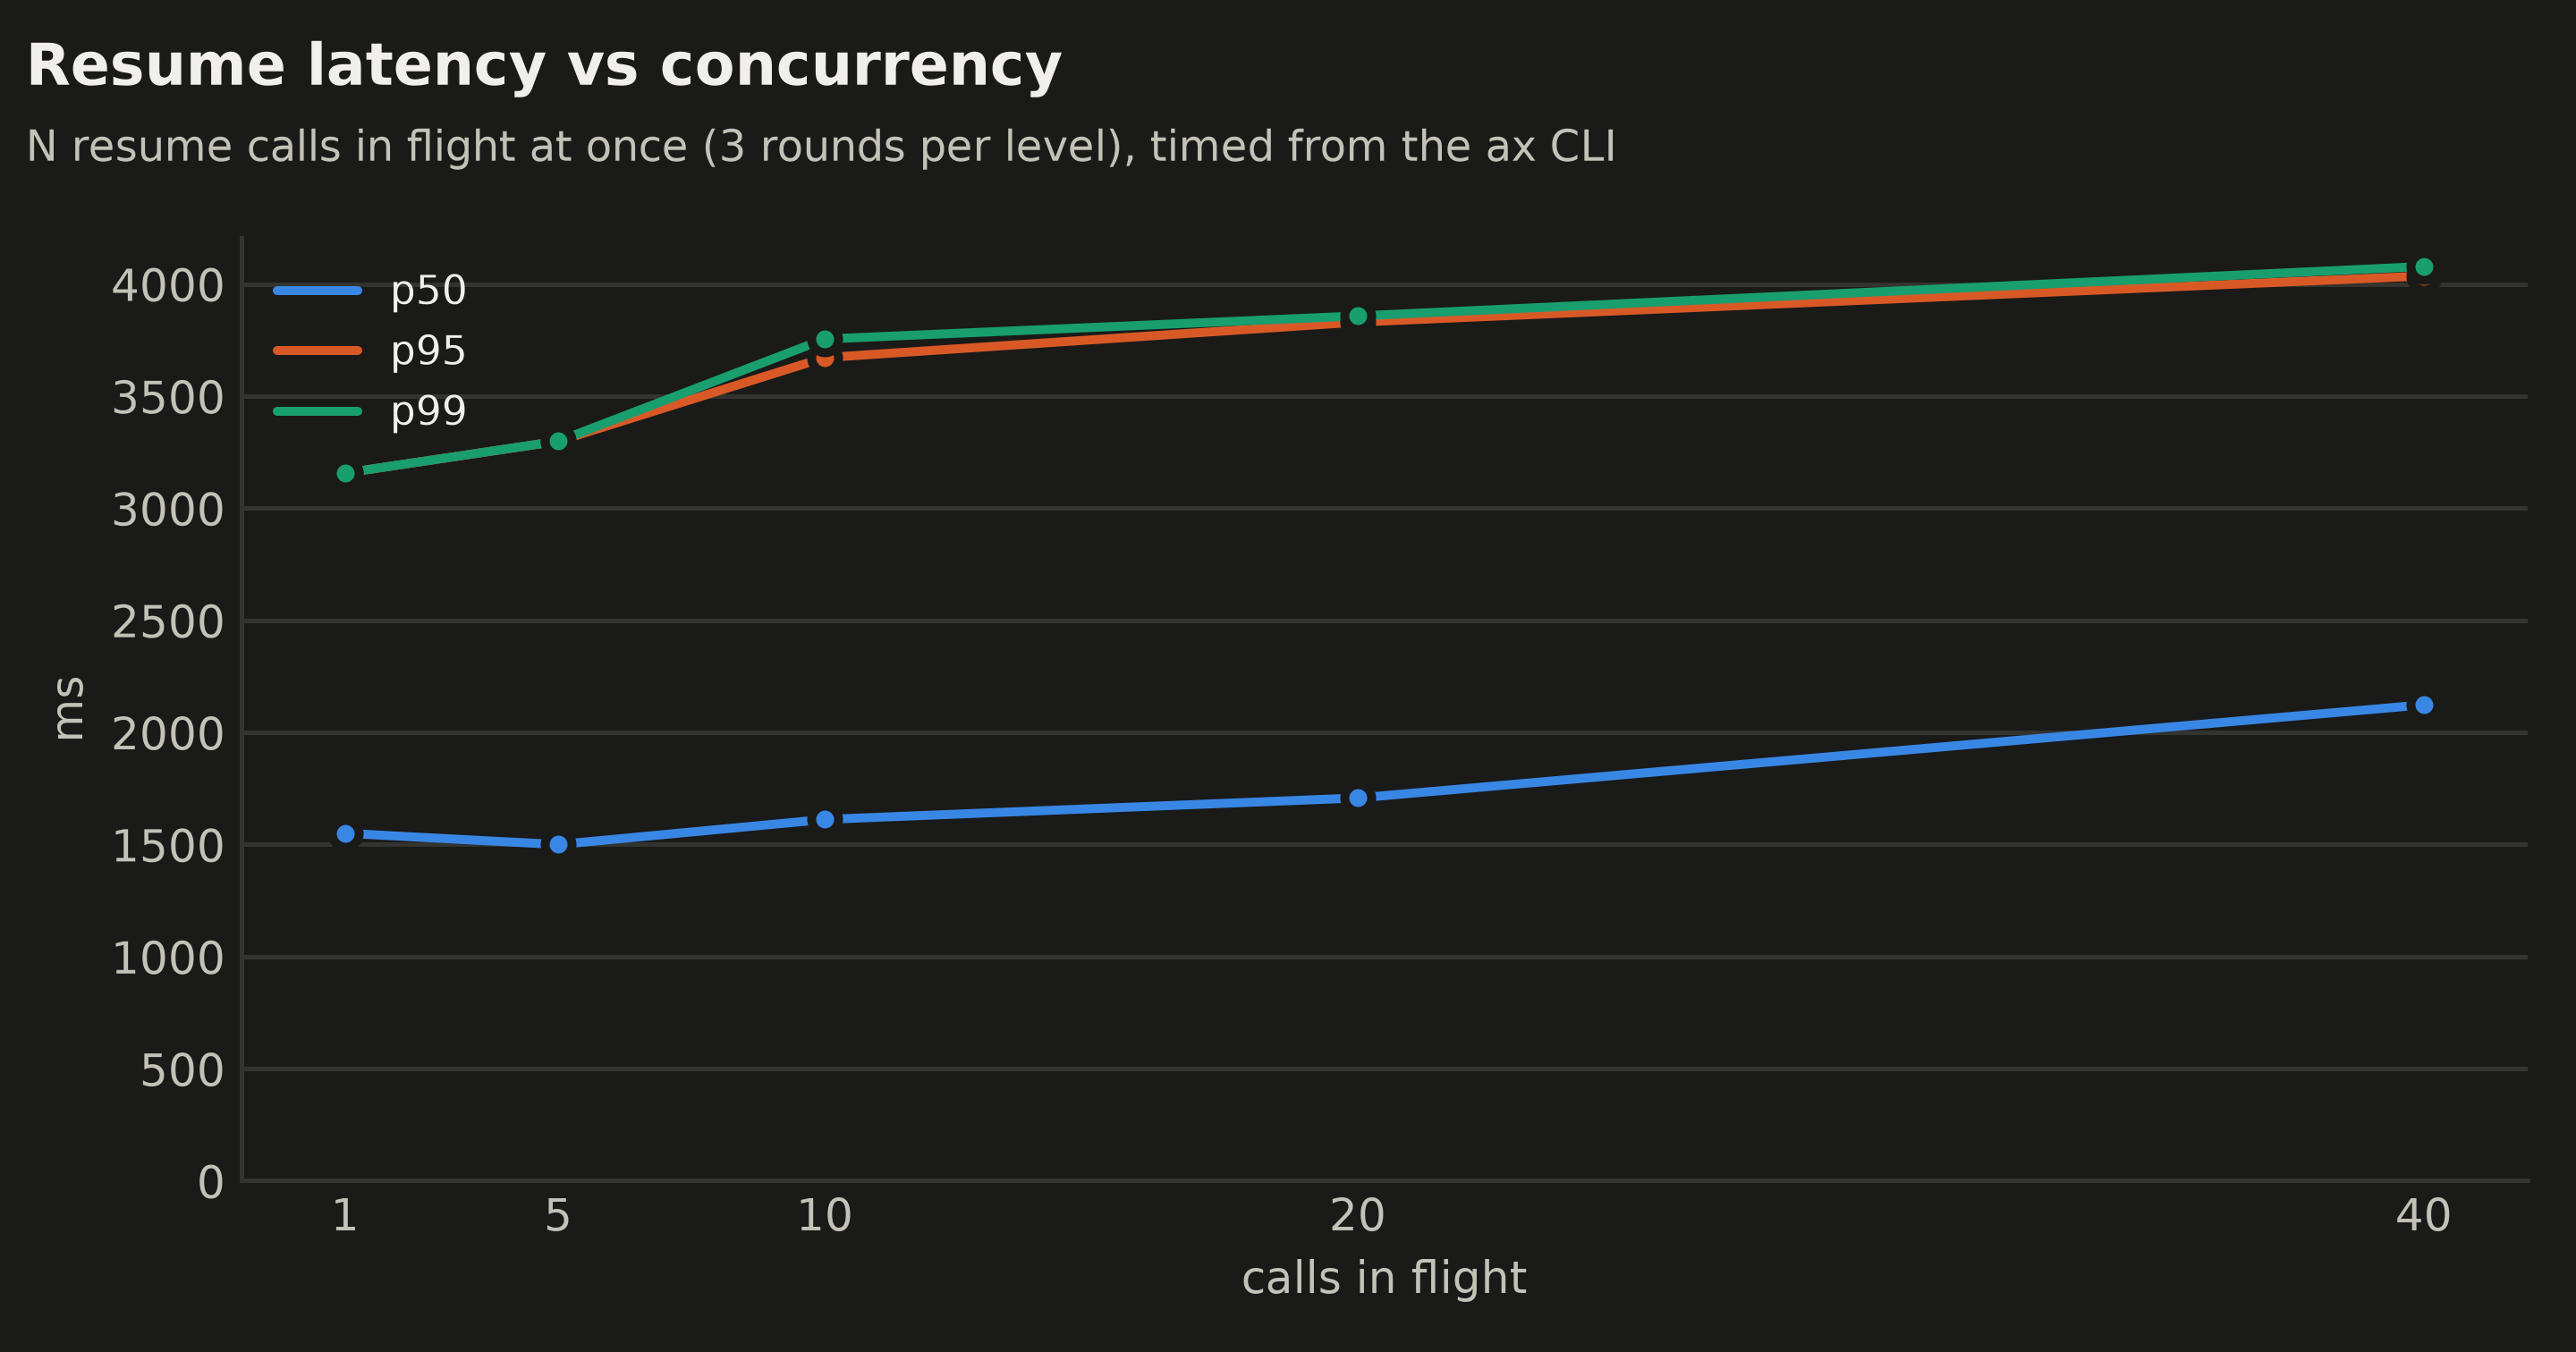
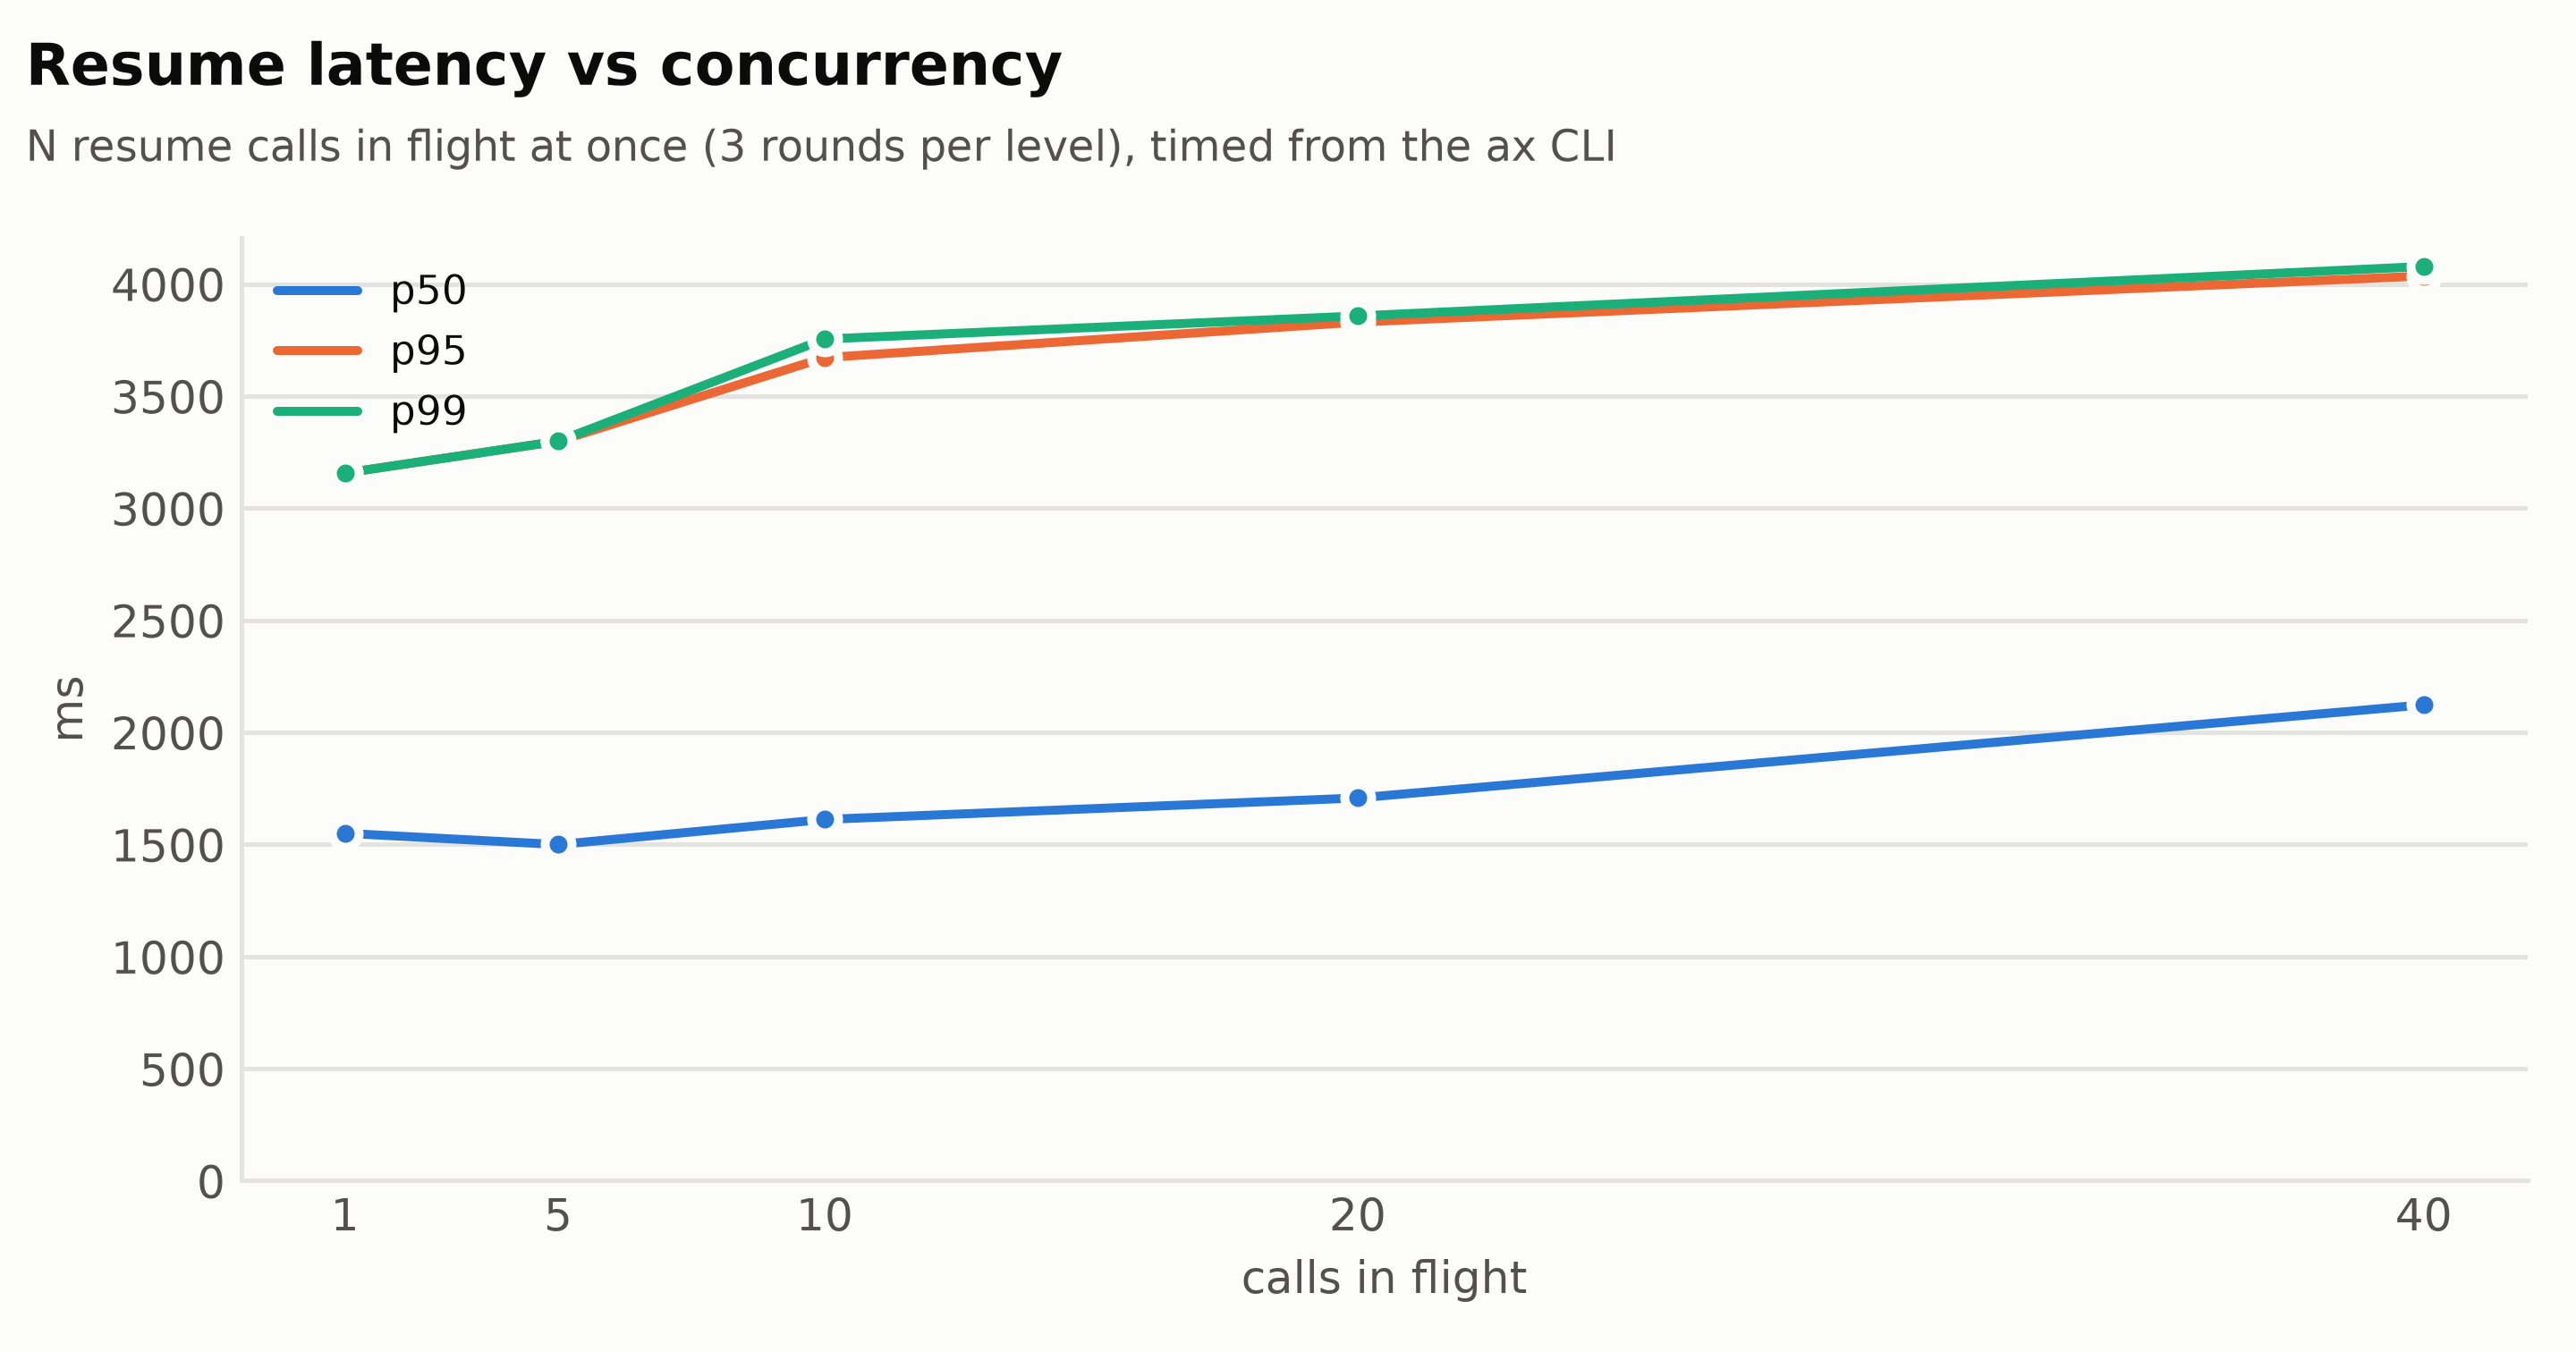
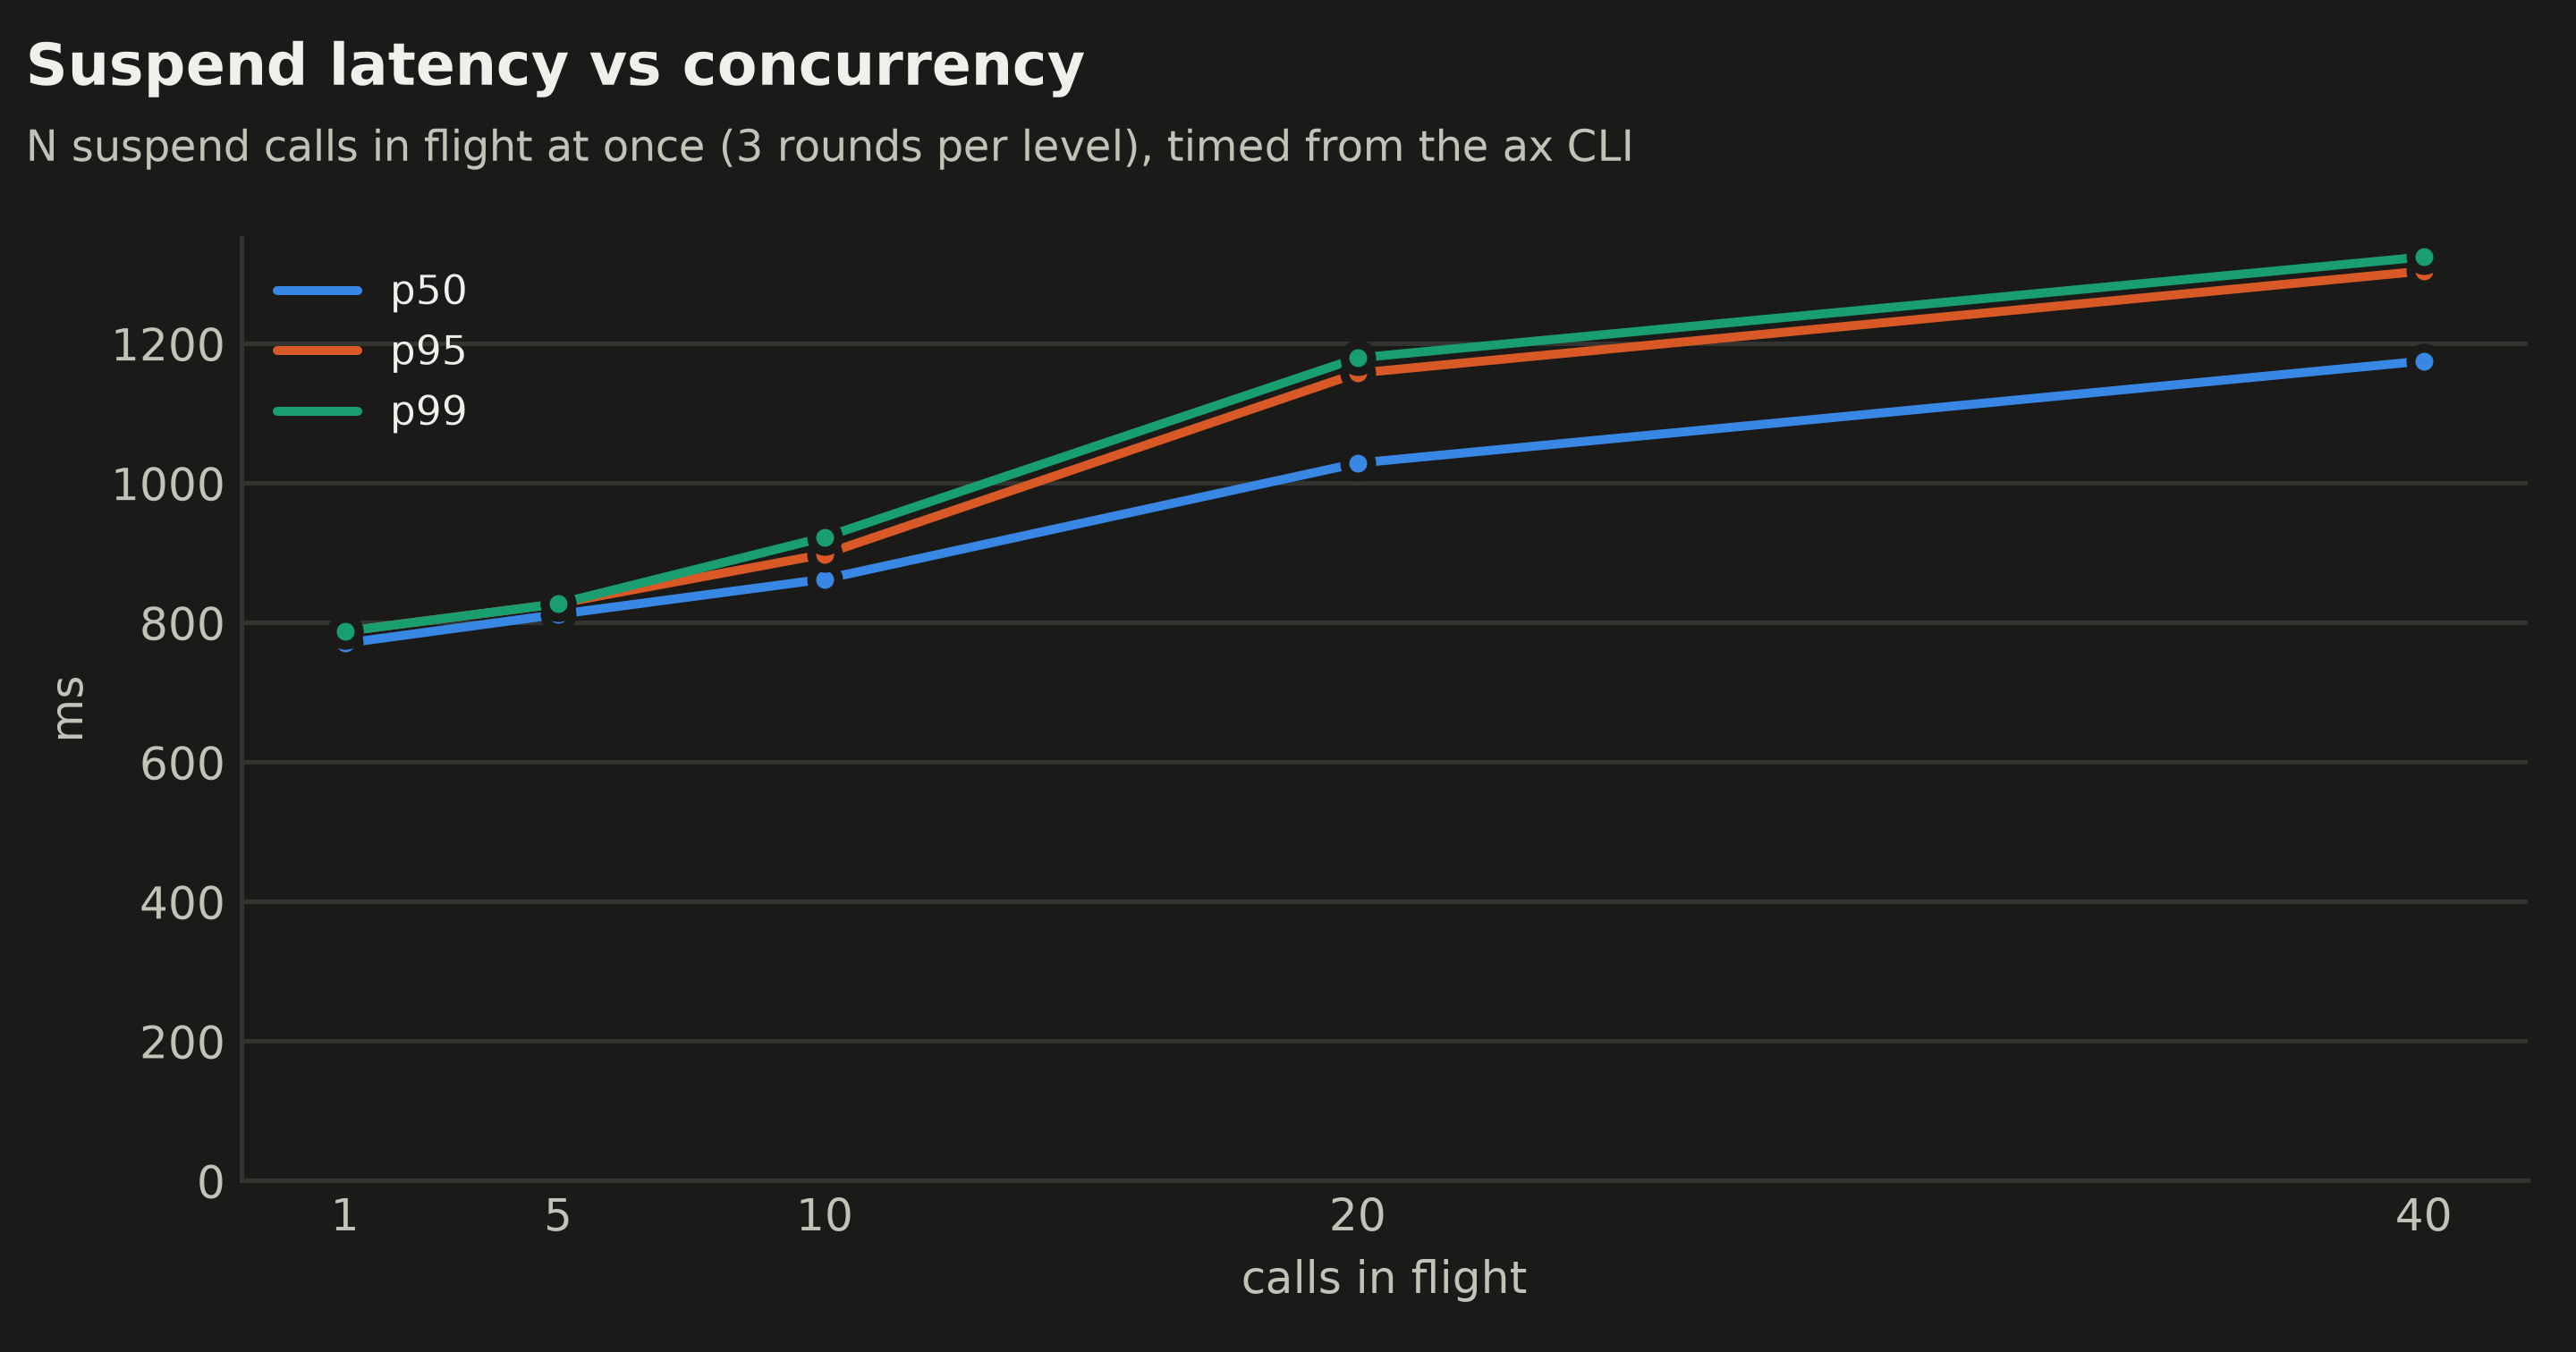
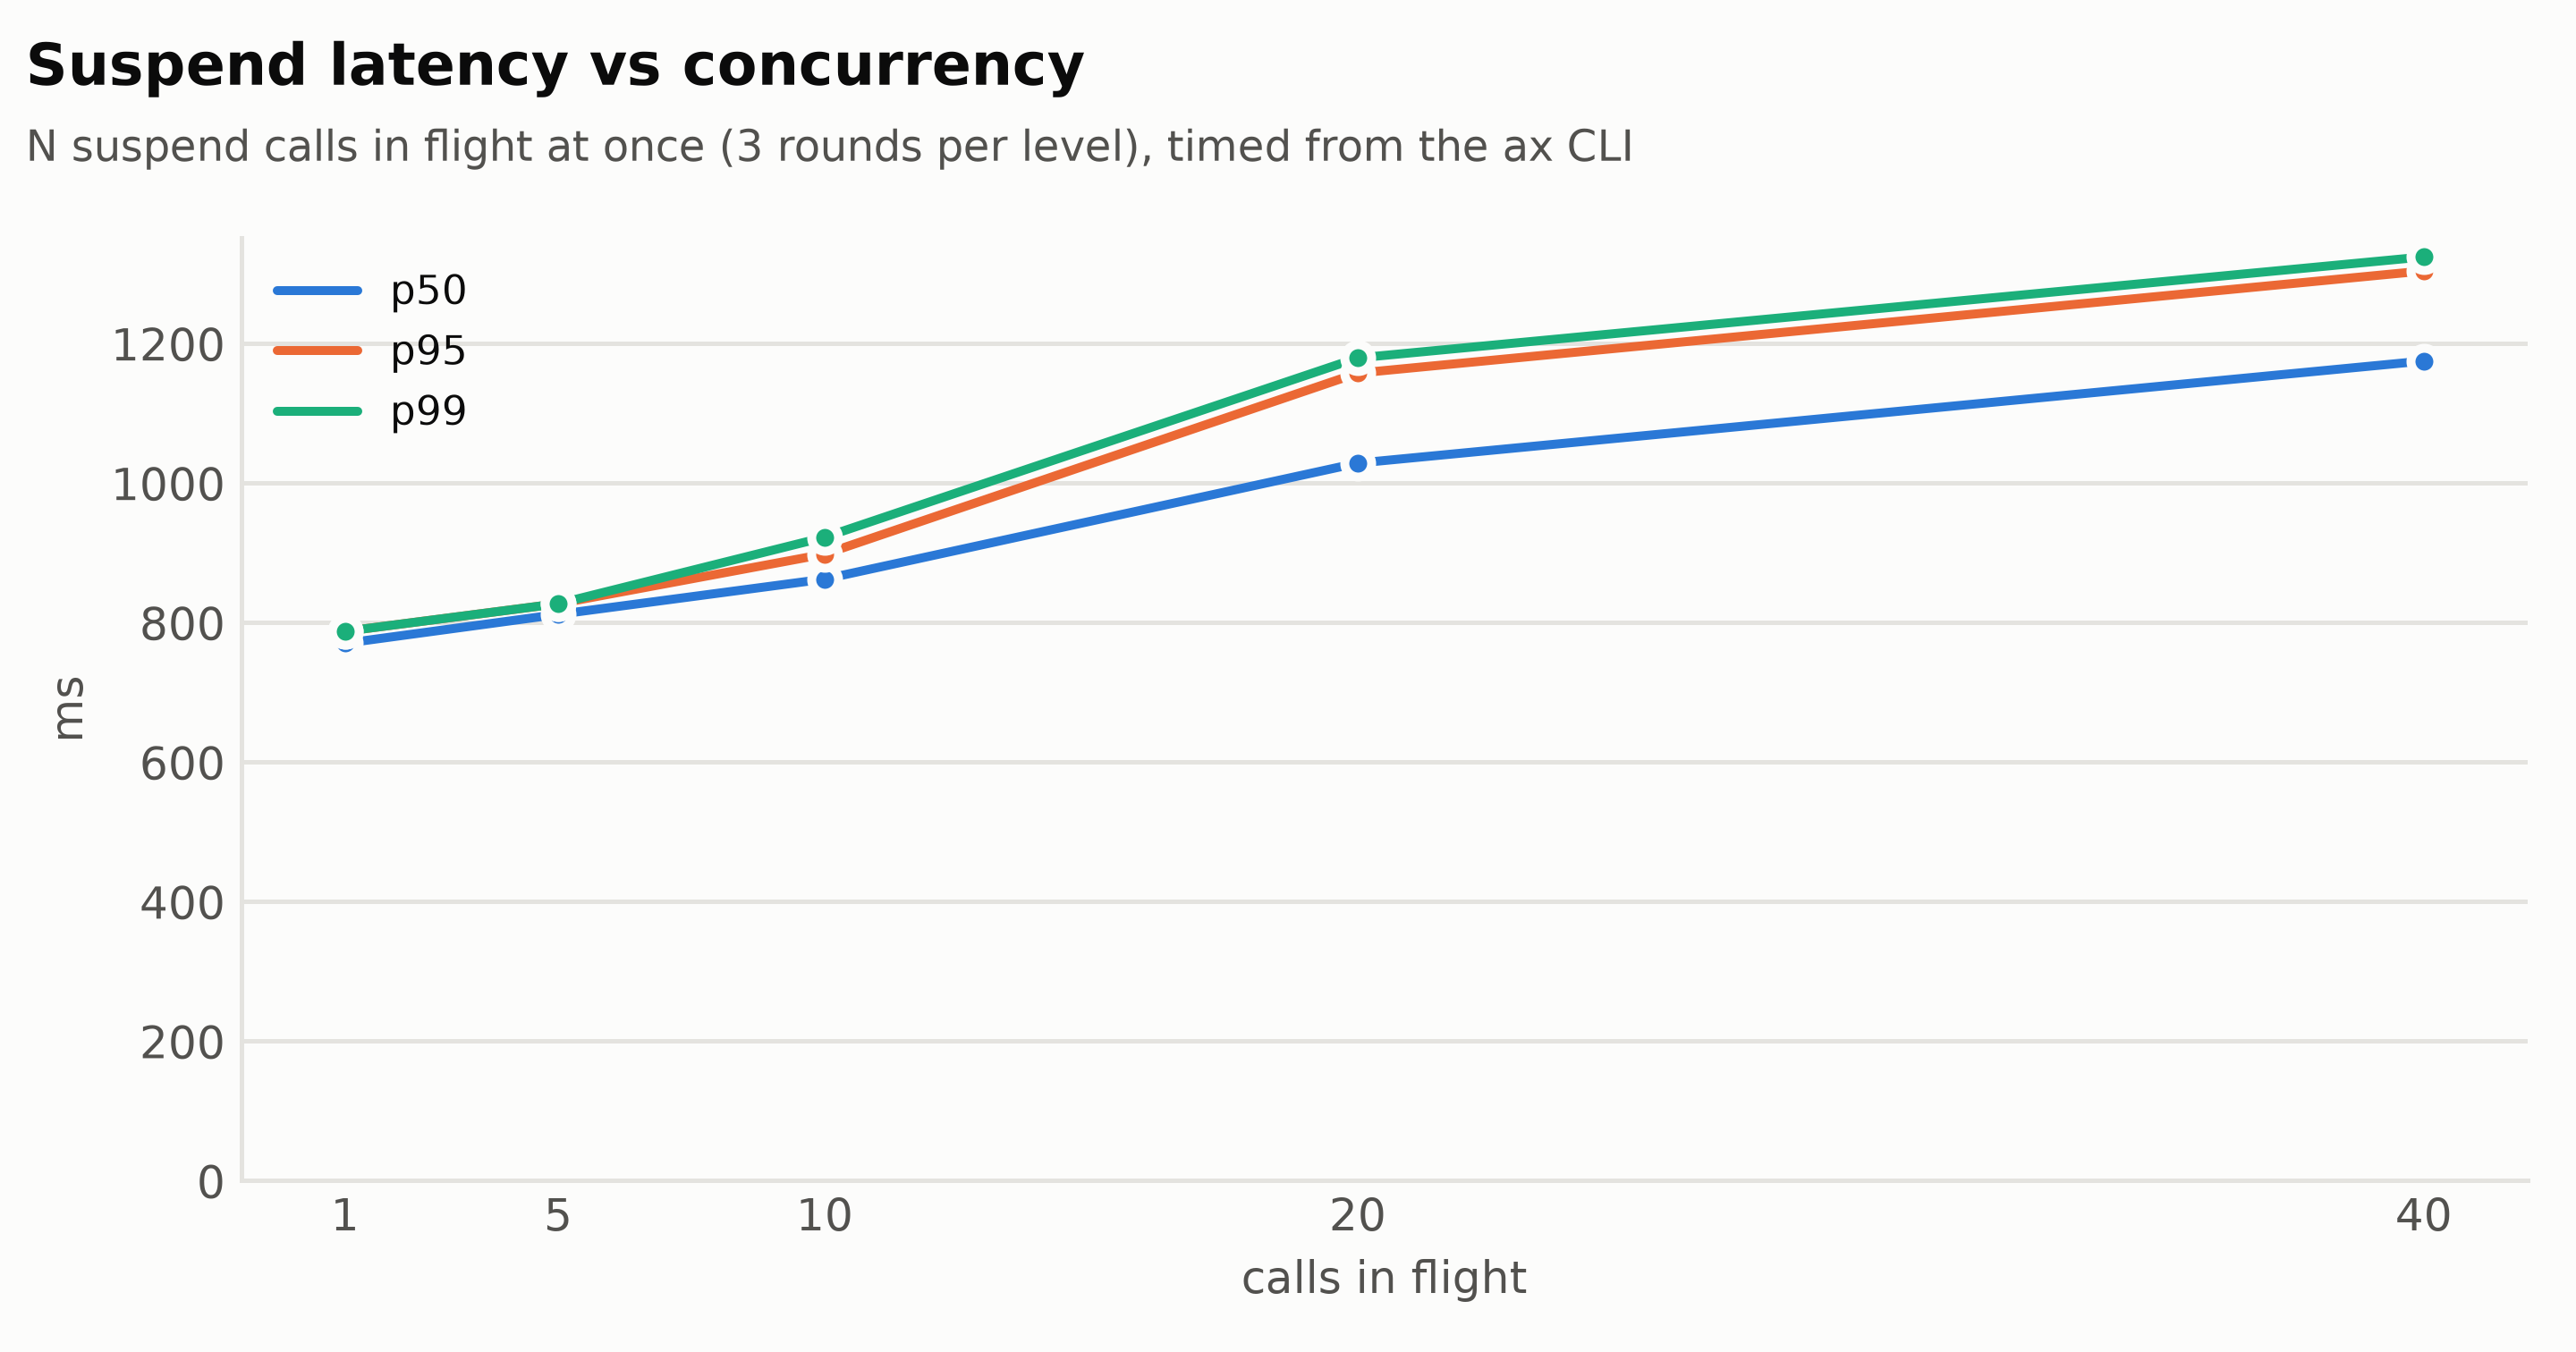
03_latency.py creates N tasks at once (cpu 100m, memory 128Mi), then resumes and suspends all N at once, three rounds, for N from 1 to 40:
for n in (1, 5, 10, 20, 40):
    out = parallel(create_one, names, n)
    for _ in range(3):
        for verb in ("resume", "suspend"):
            out = parallel(op(verb), names, n)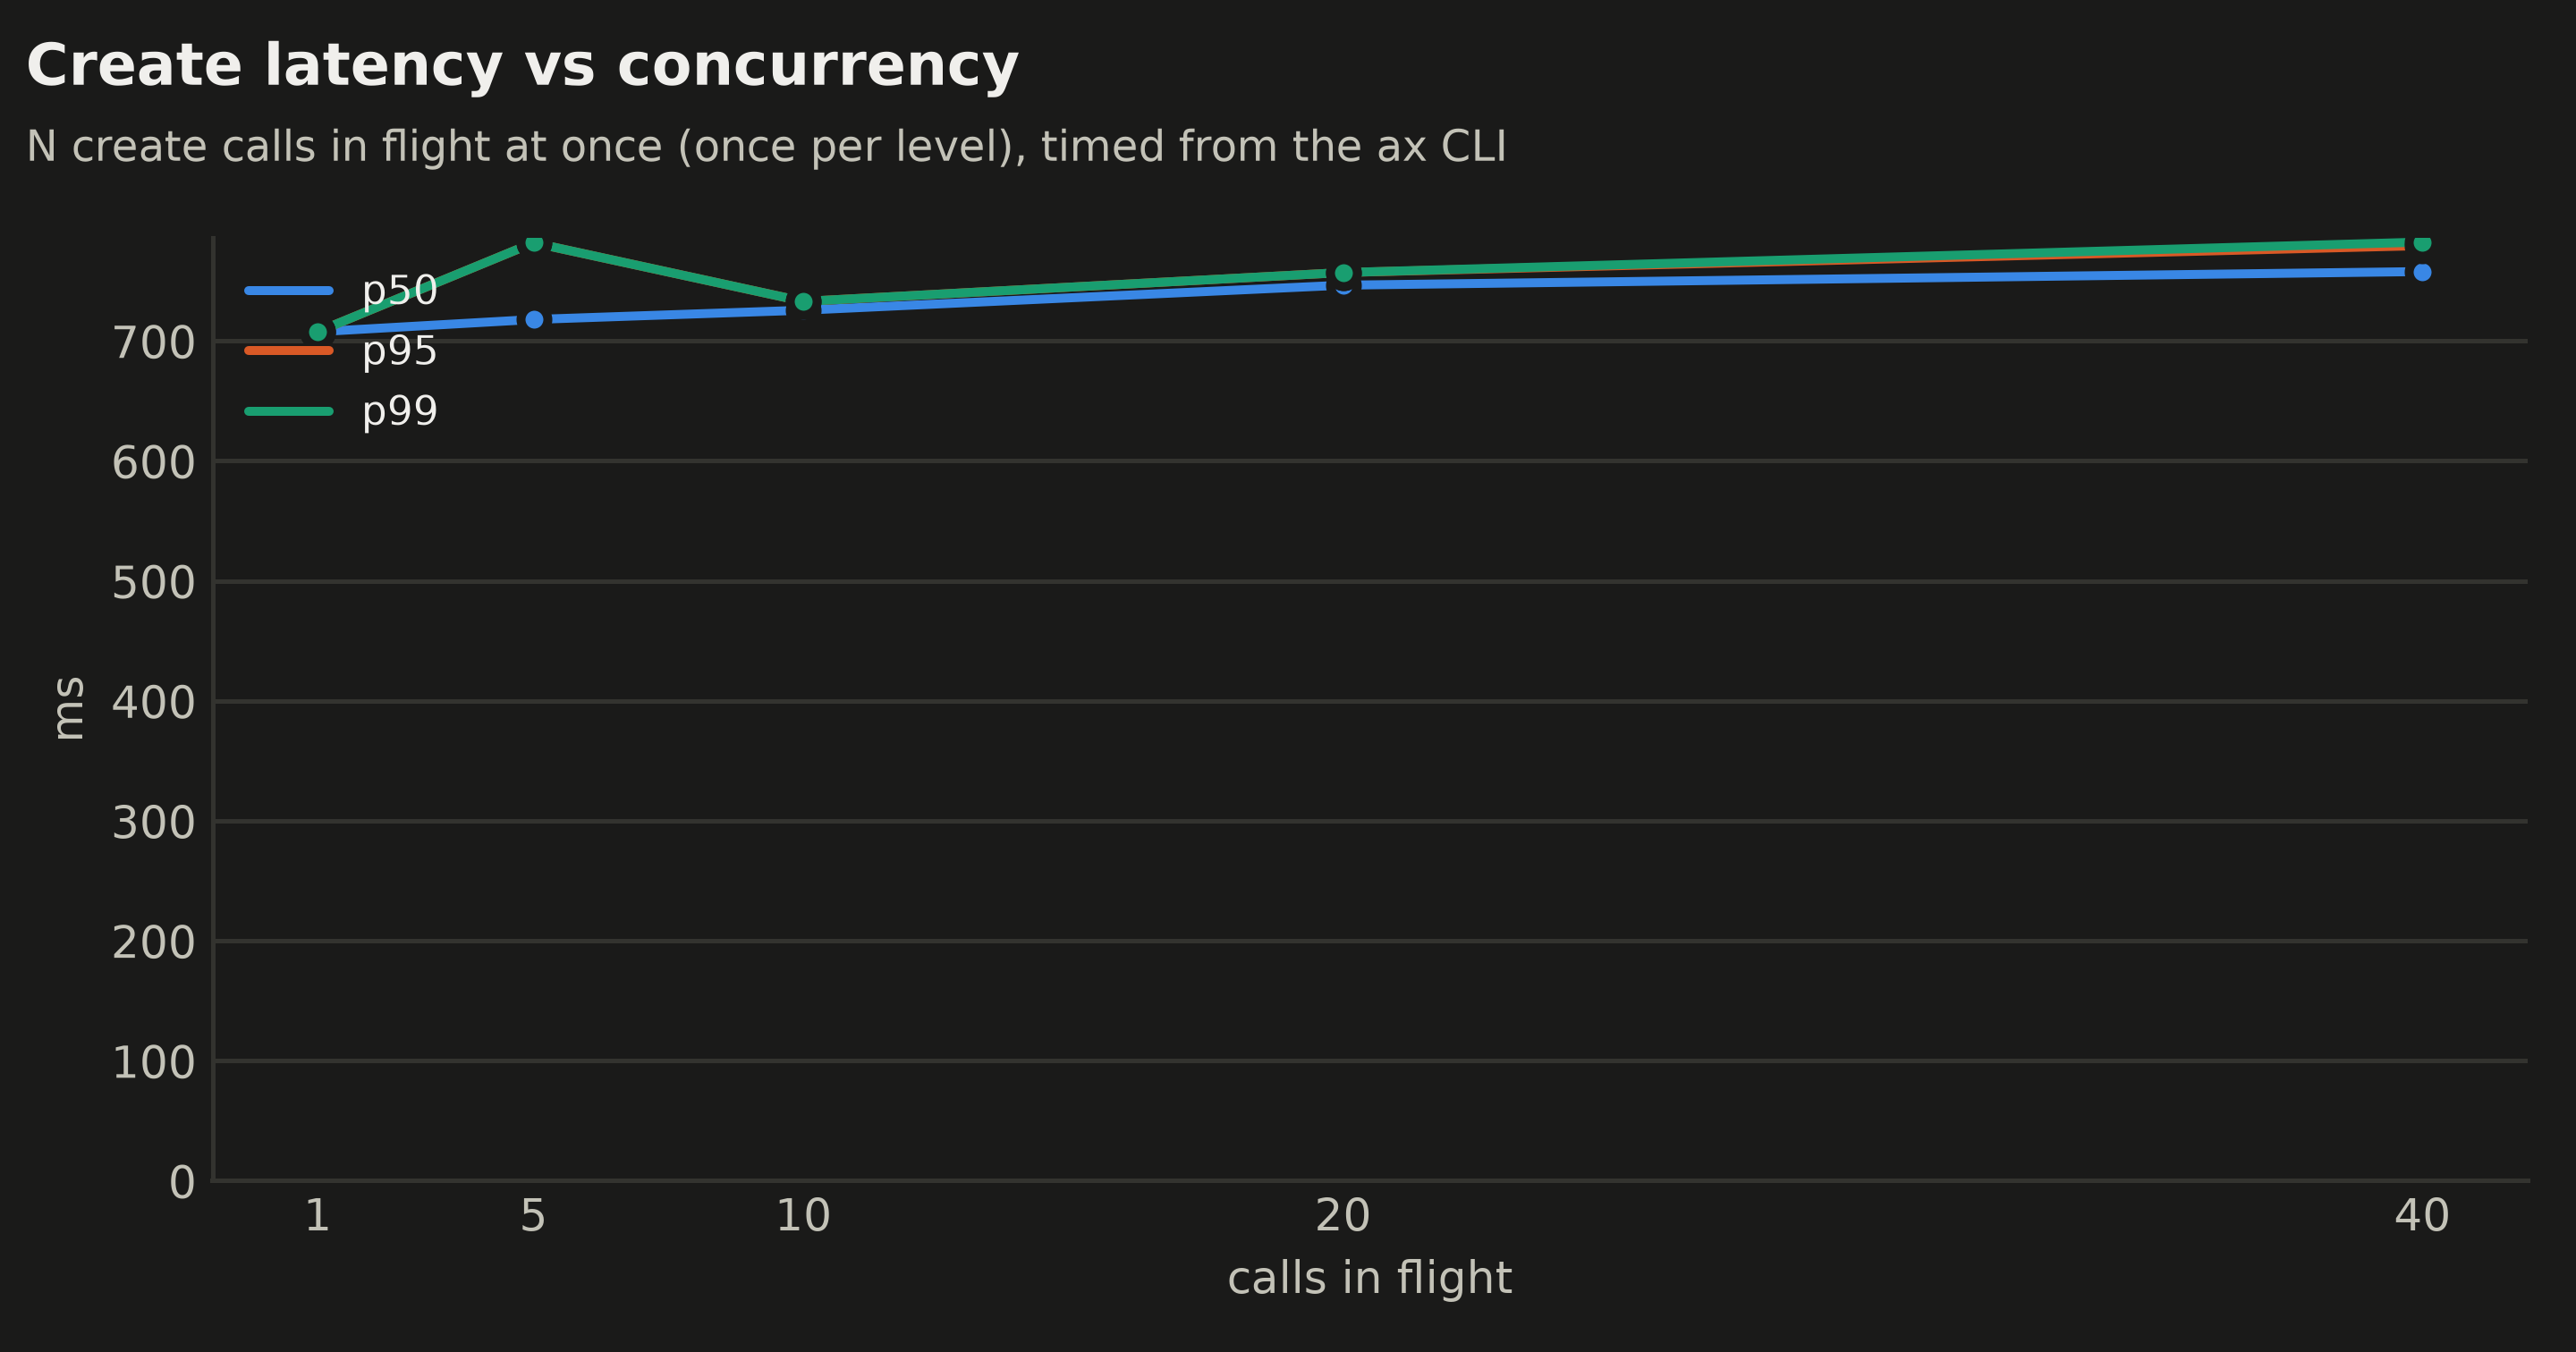
| Calls in flight | Create p50 | Resume p50 / p95 | Suspend p50 / p95 |
|---|---|---|---|
| 1 | 708 ms | 1,550 / 3,157 ms | 770 / 788 ms |
| 5 | 718 ms | 1,500 / 3,298 ms | 812 / 827 ms |
| 10 | 726 ms | 1,612 / 3,671 ms | 862 / 898 ms |
| 20 | 746 ms | 1,707 / 3,830 ms | 1,029 / 1,158 ms |
| 40 | 758 ms | 2,123 / 4,035 ms | 1,175 / 1,304 ms |
Nothing failed at any level, and latency degraded gracefully: from 1 to 40 calls in flight, the median resume rose 37% and the median suspend 53%. The resume p95 is the first resume of each task, a boot from the template’s golden snapshot at about 3 to 4 seconds; later resumes restore the task’s own snapshot and pull the median down. Create barely noticed the load: it records the task and creates its Substrate actor, without booting anything.
Test 3: Wake on request, and why CPU limits matter
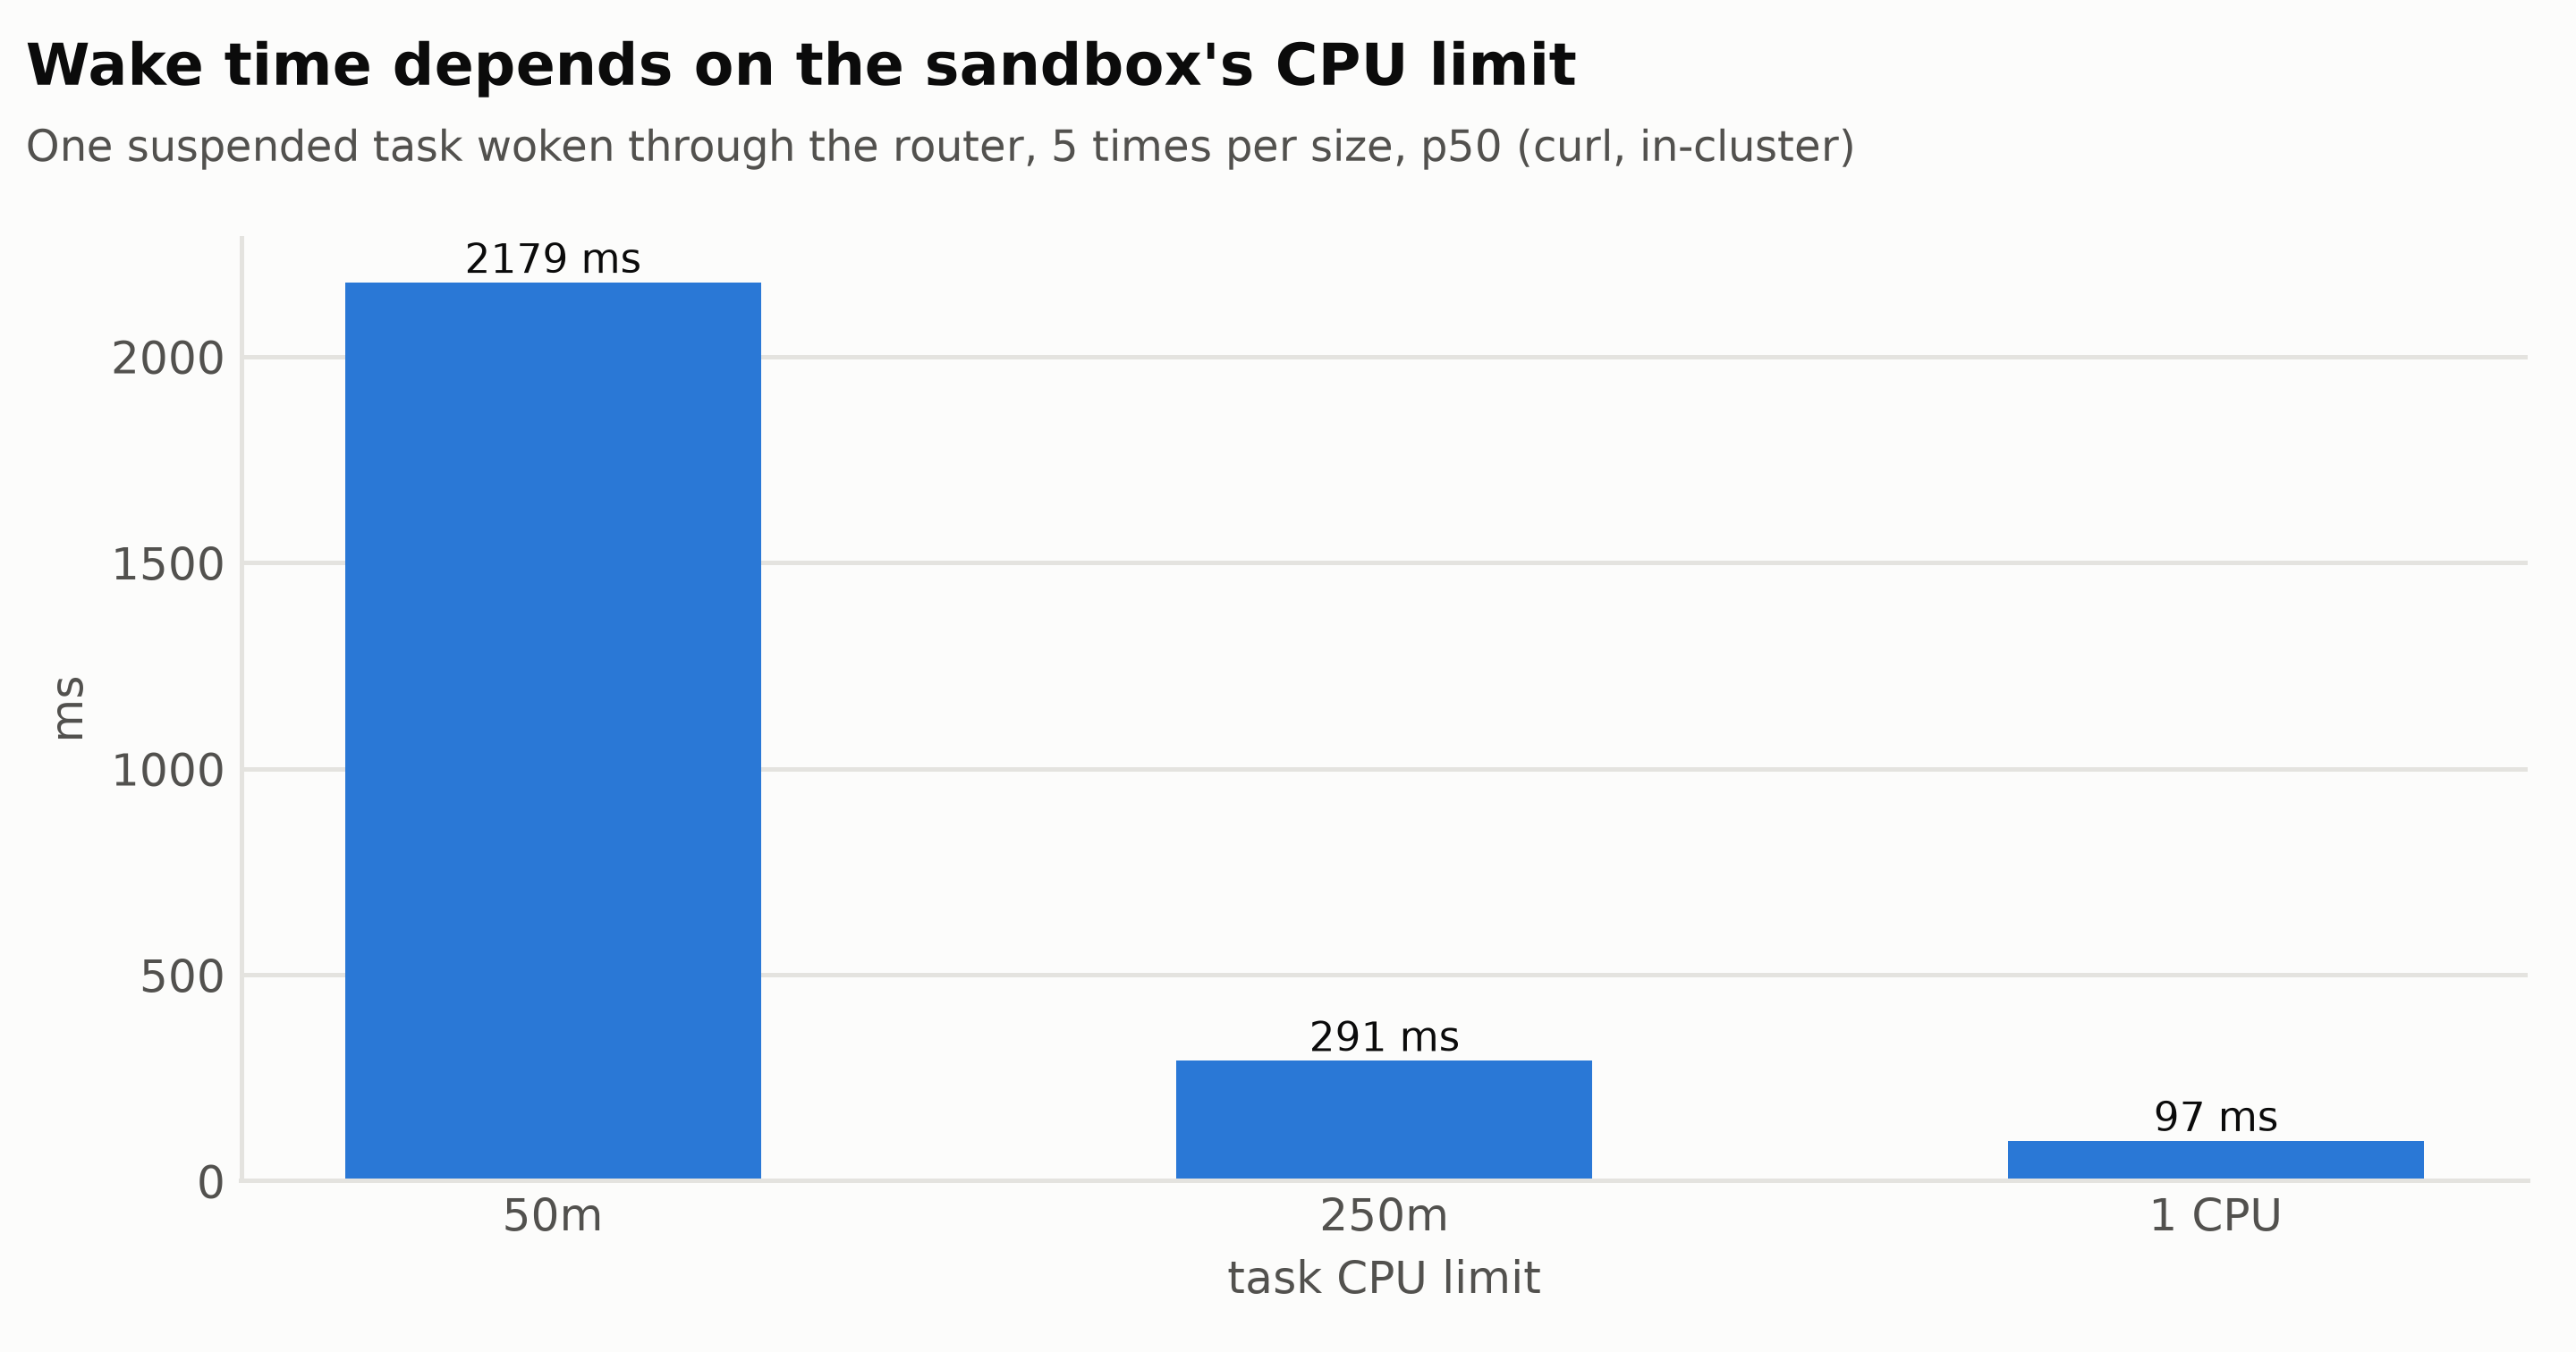
04_wake_burst.py wakes suspended tasks with HTTPS requests through Substrate’s router, from a pod that runs with ax-server’s identity (the router only accepts mTLS from it; see part 2). First one task at three CPU sizes, then bursts:
for cpu in ("50m", "250m", "1"):
    create(nm, cpu=cpu, memory="256Mi"); ax("resume", "task", nm)
    for _ in range(5):
        ax("suspend", "task", nm)
        ms += wake([nm])[0]          # curl time_total from inside the cluster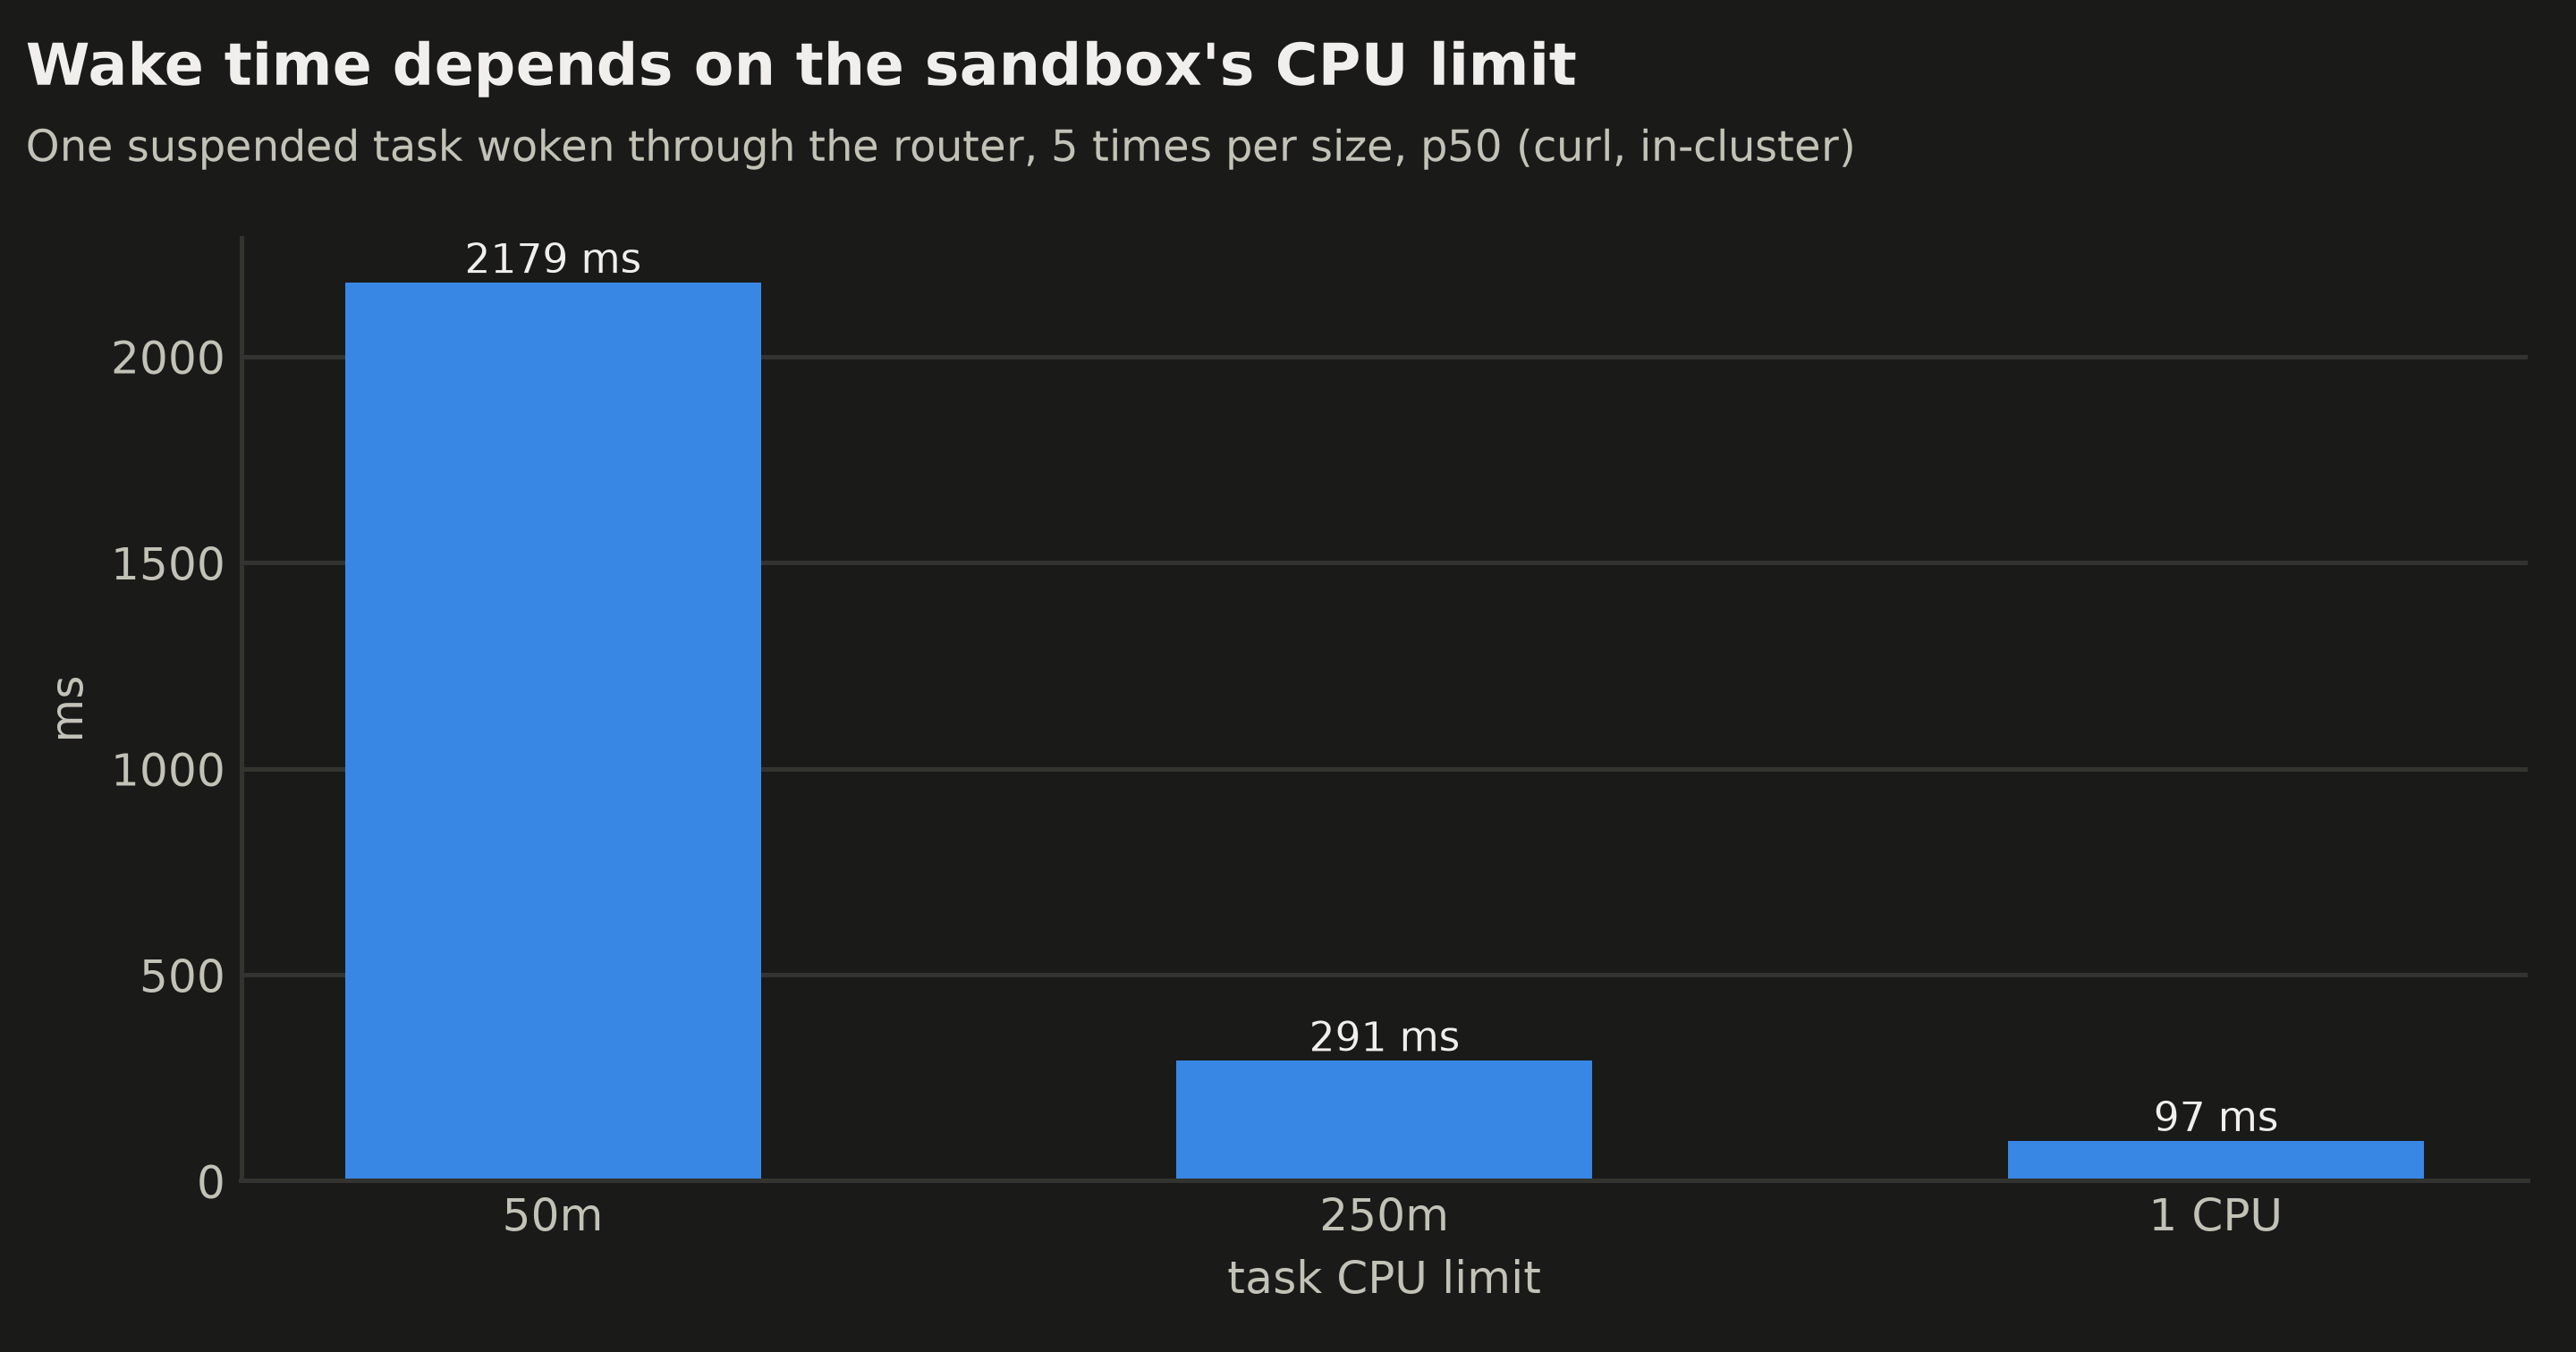
| Task CPU limit | Wake p50 (5 wakes) | p95 |
|---|---|---|
| 50m | 2,179 ms | 3,452 ms |
| 250m | 291 ms | 415 ms |
| 1 CPU | 97 ms | 111 ms |
This was the most useful result of the series. The wake time is mostly the sandbox booting AX’s runner, and a CPU limit throttles that boot. At a full CPU a suspended task answered its request in about 100 ms (median); at 50 millicores, in about two seconds. That’s the same trade the density test hides: you can pack 151 tasks at 50m, but each one wakes twenty times slower than a task at 1 CPU, which only six fit of. The field test’s 220 ms and Google’s sub-500 ms both sit inside this range; neither says what CPU the agent had.
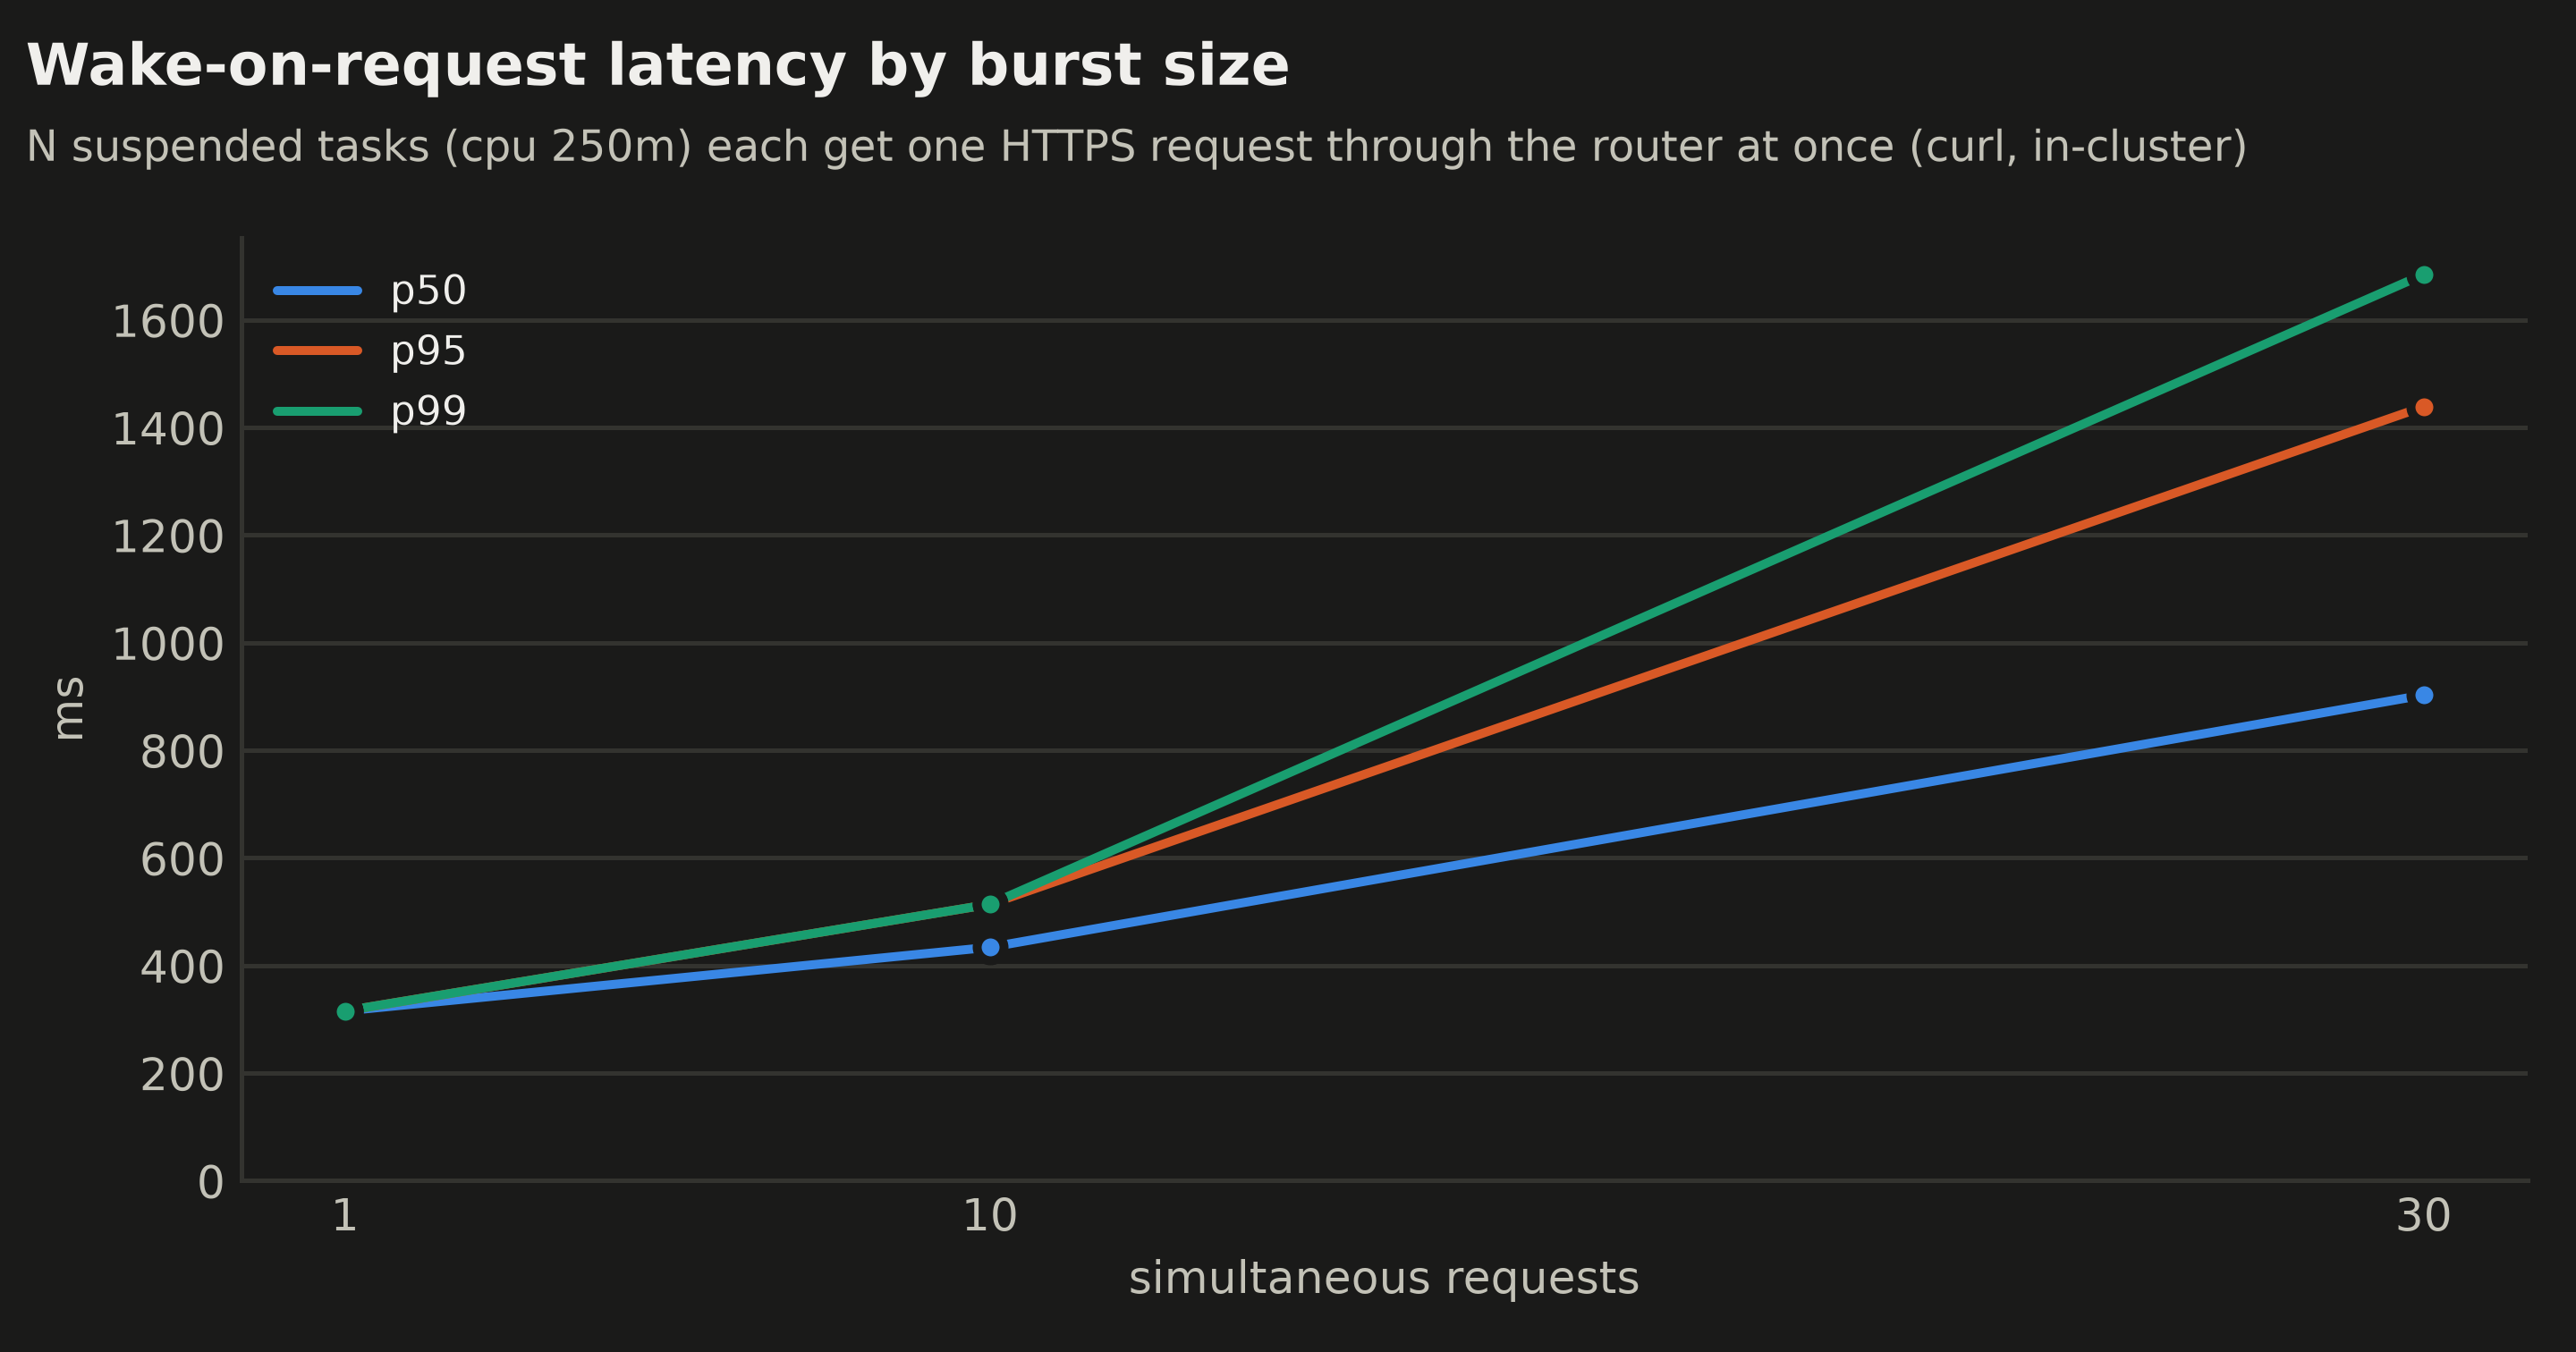
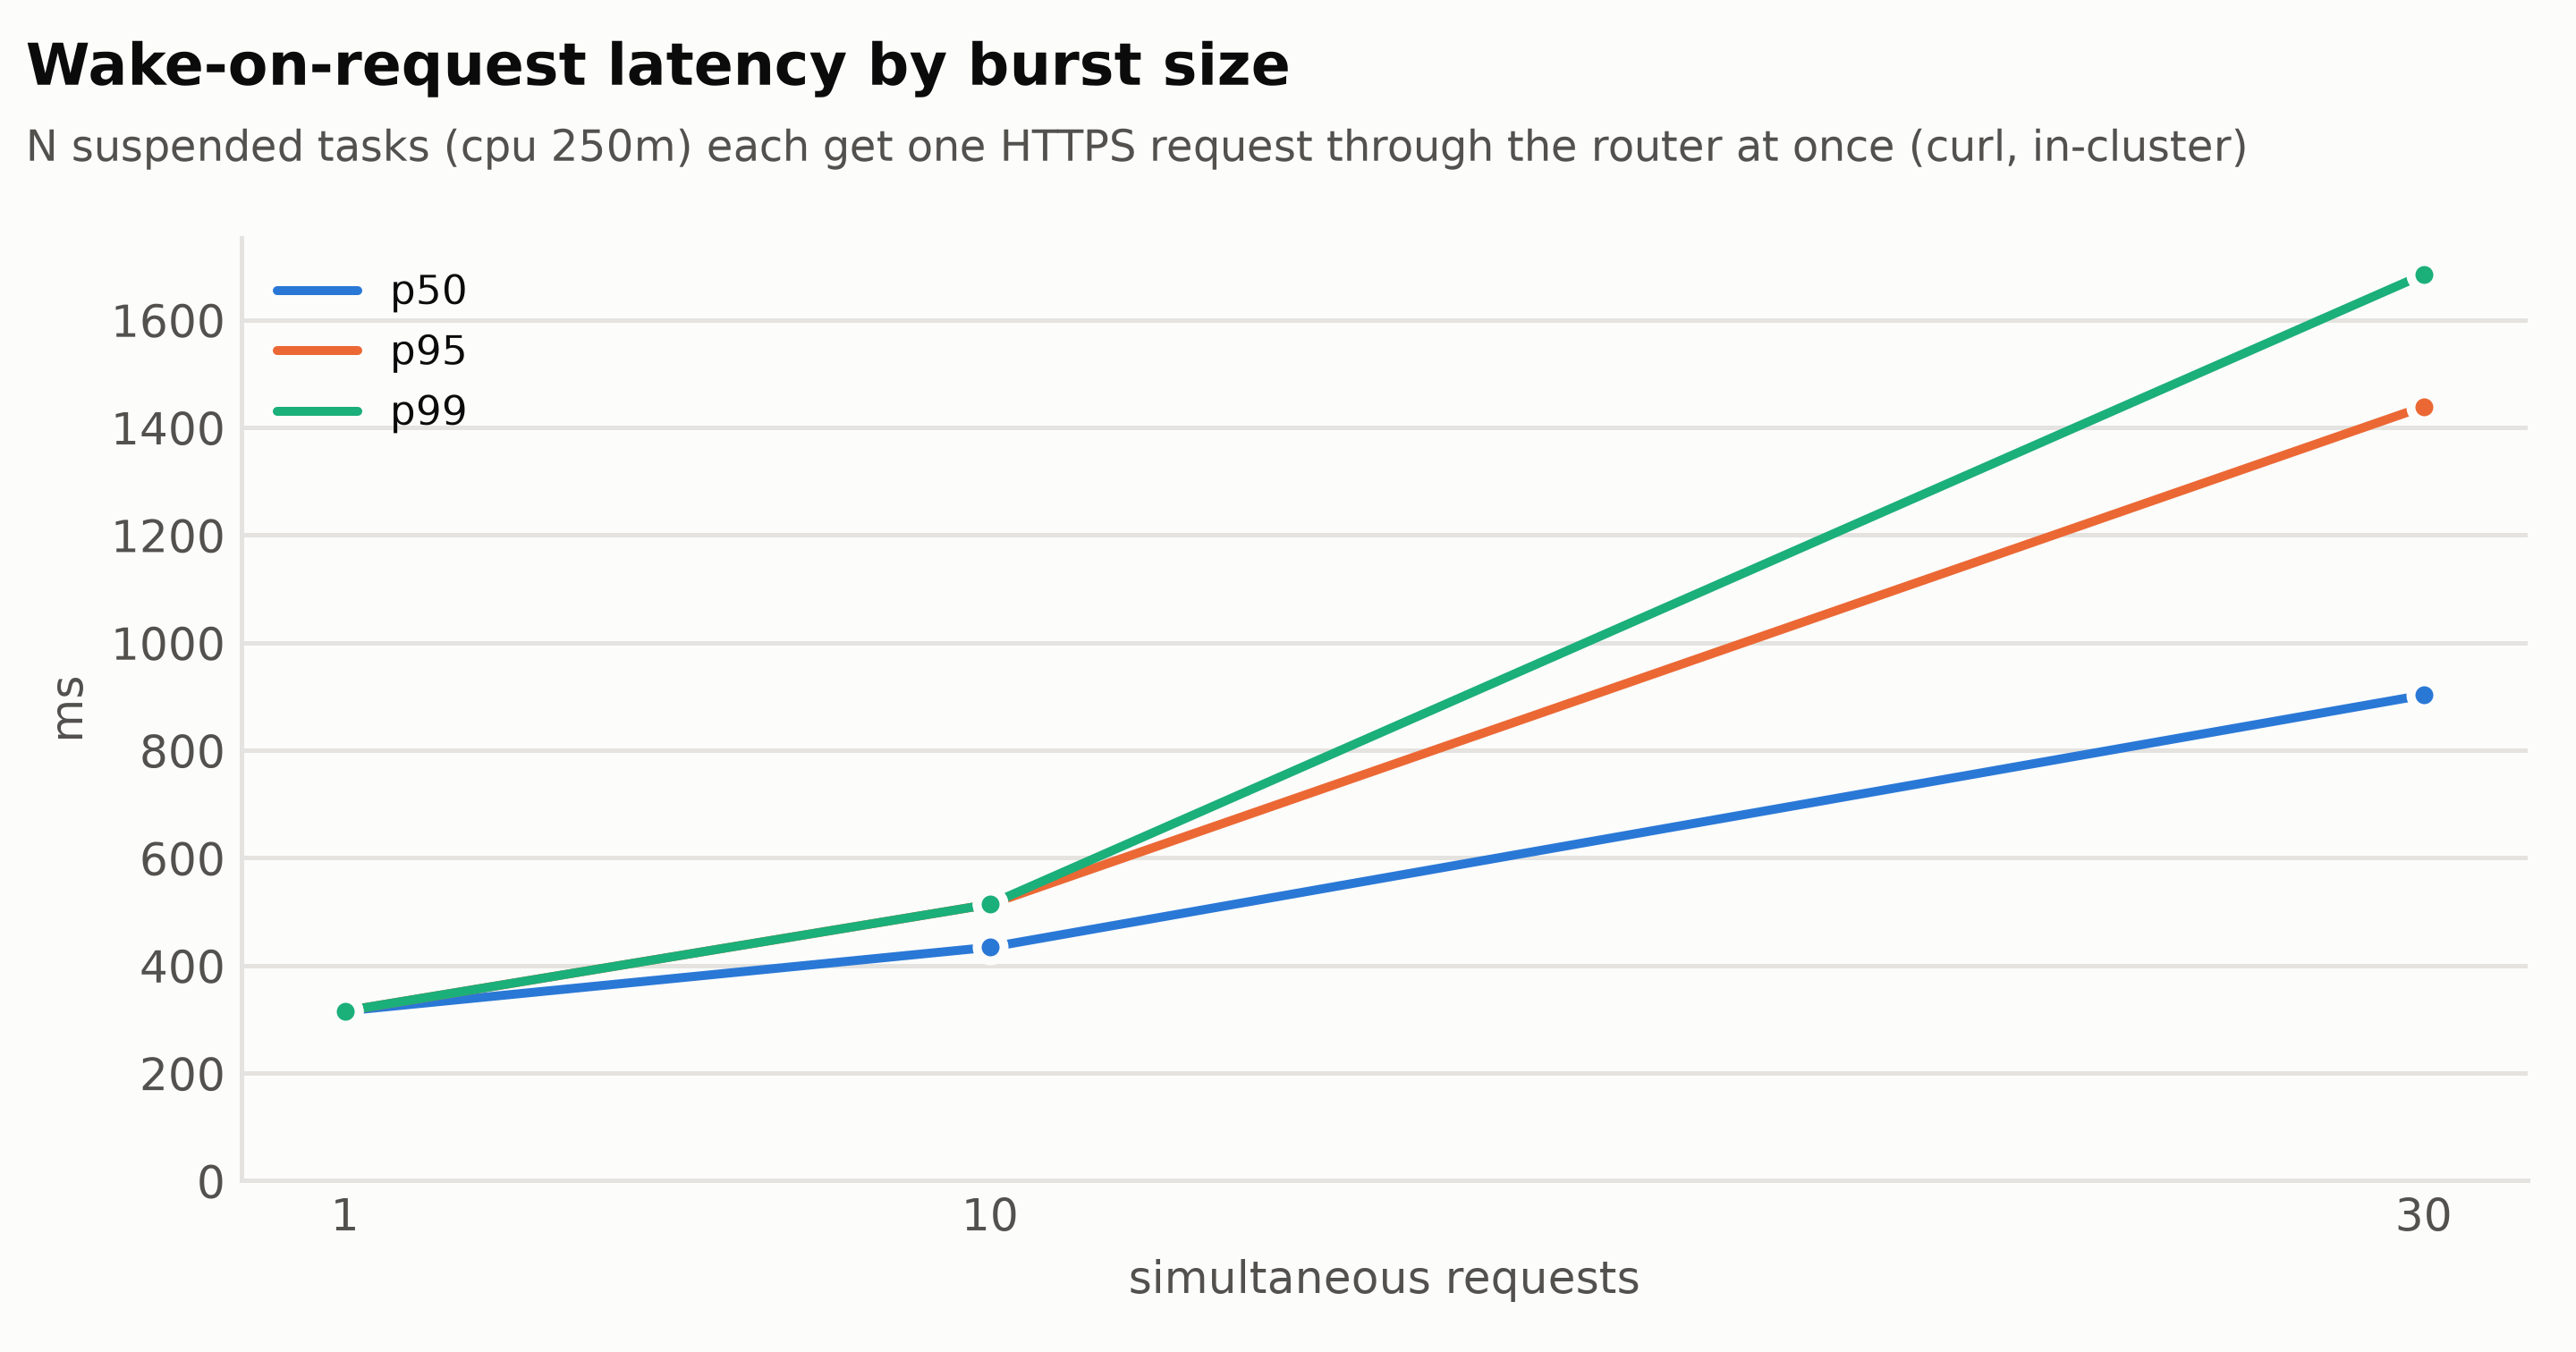
Bursts at 250m:
| Simultaneous requests | p50 | p95 | p99 | Errors |
|---|---|---|---|---|
| 1 | 316 ms | 316 ms | 316 ms | 0 |
| 10 | 434 ms | 514 ms | 514 ms | 0 |
| 30 | 903 ms | 1,439 ms | 1,684 ms | 0 |
Thirty simultaneous wakes all succeeded, with the slowest under 1.7 s. In an earlier run, contaminated by about a hundred leftover tasks, a burst of 60 got some 503s: with the cluster full, the router parks a request that hits “no worker has room” for up to 5 seconds and then gives up.
Test 4: Control-plane load
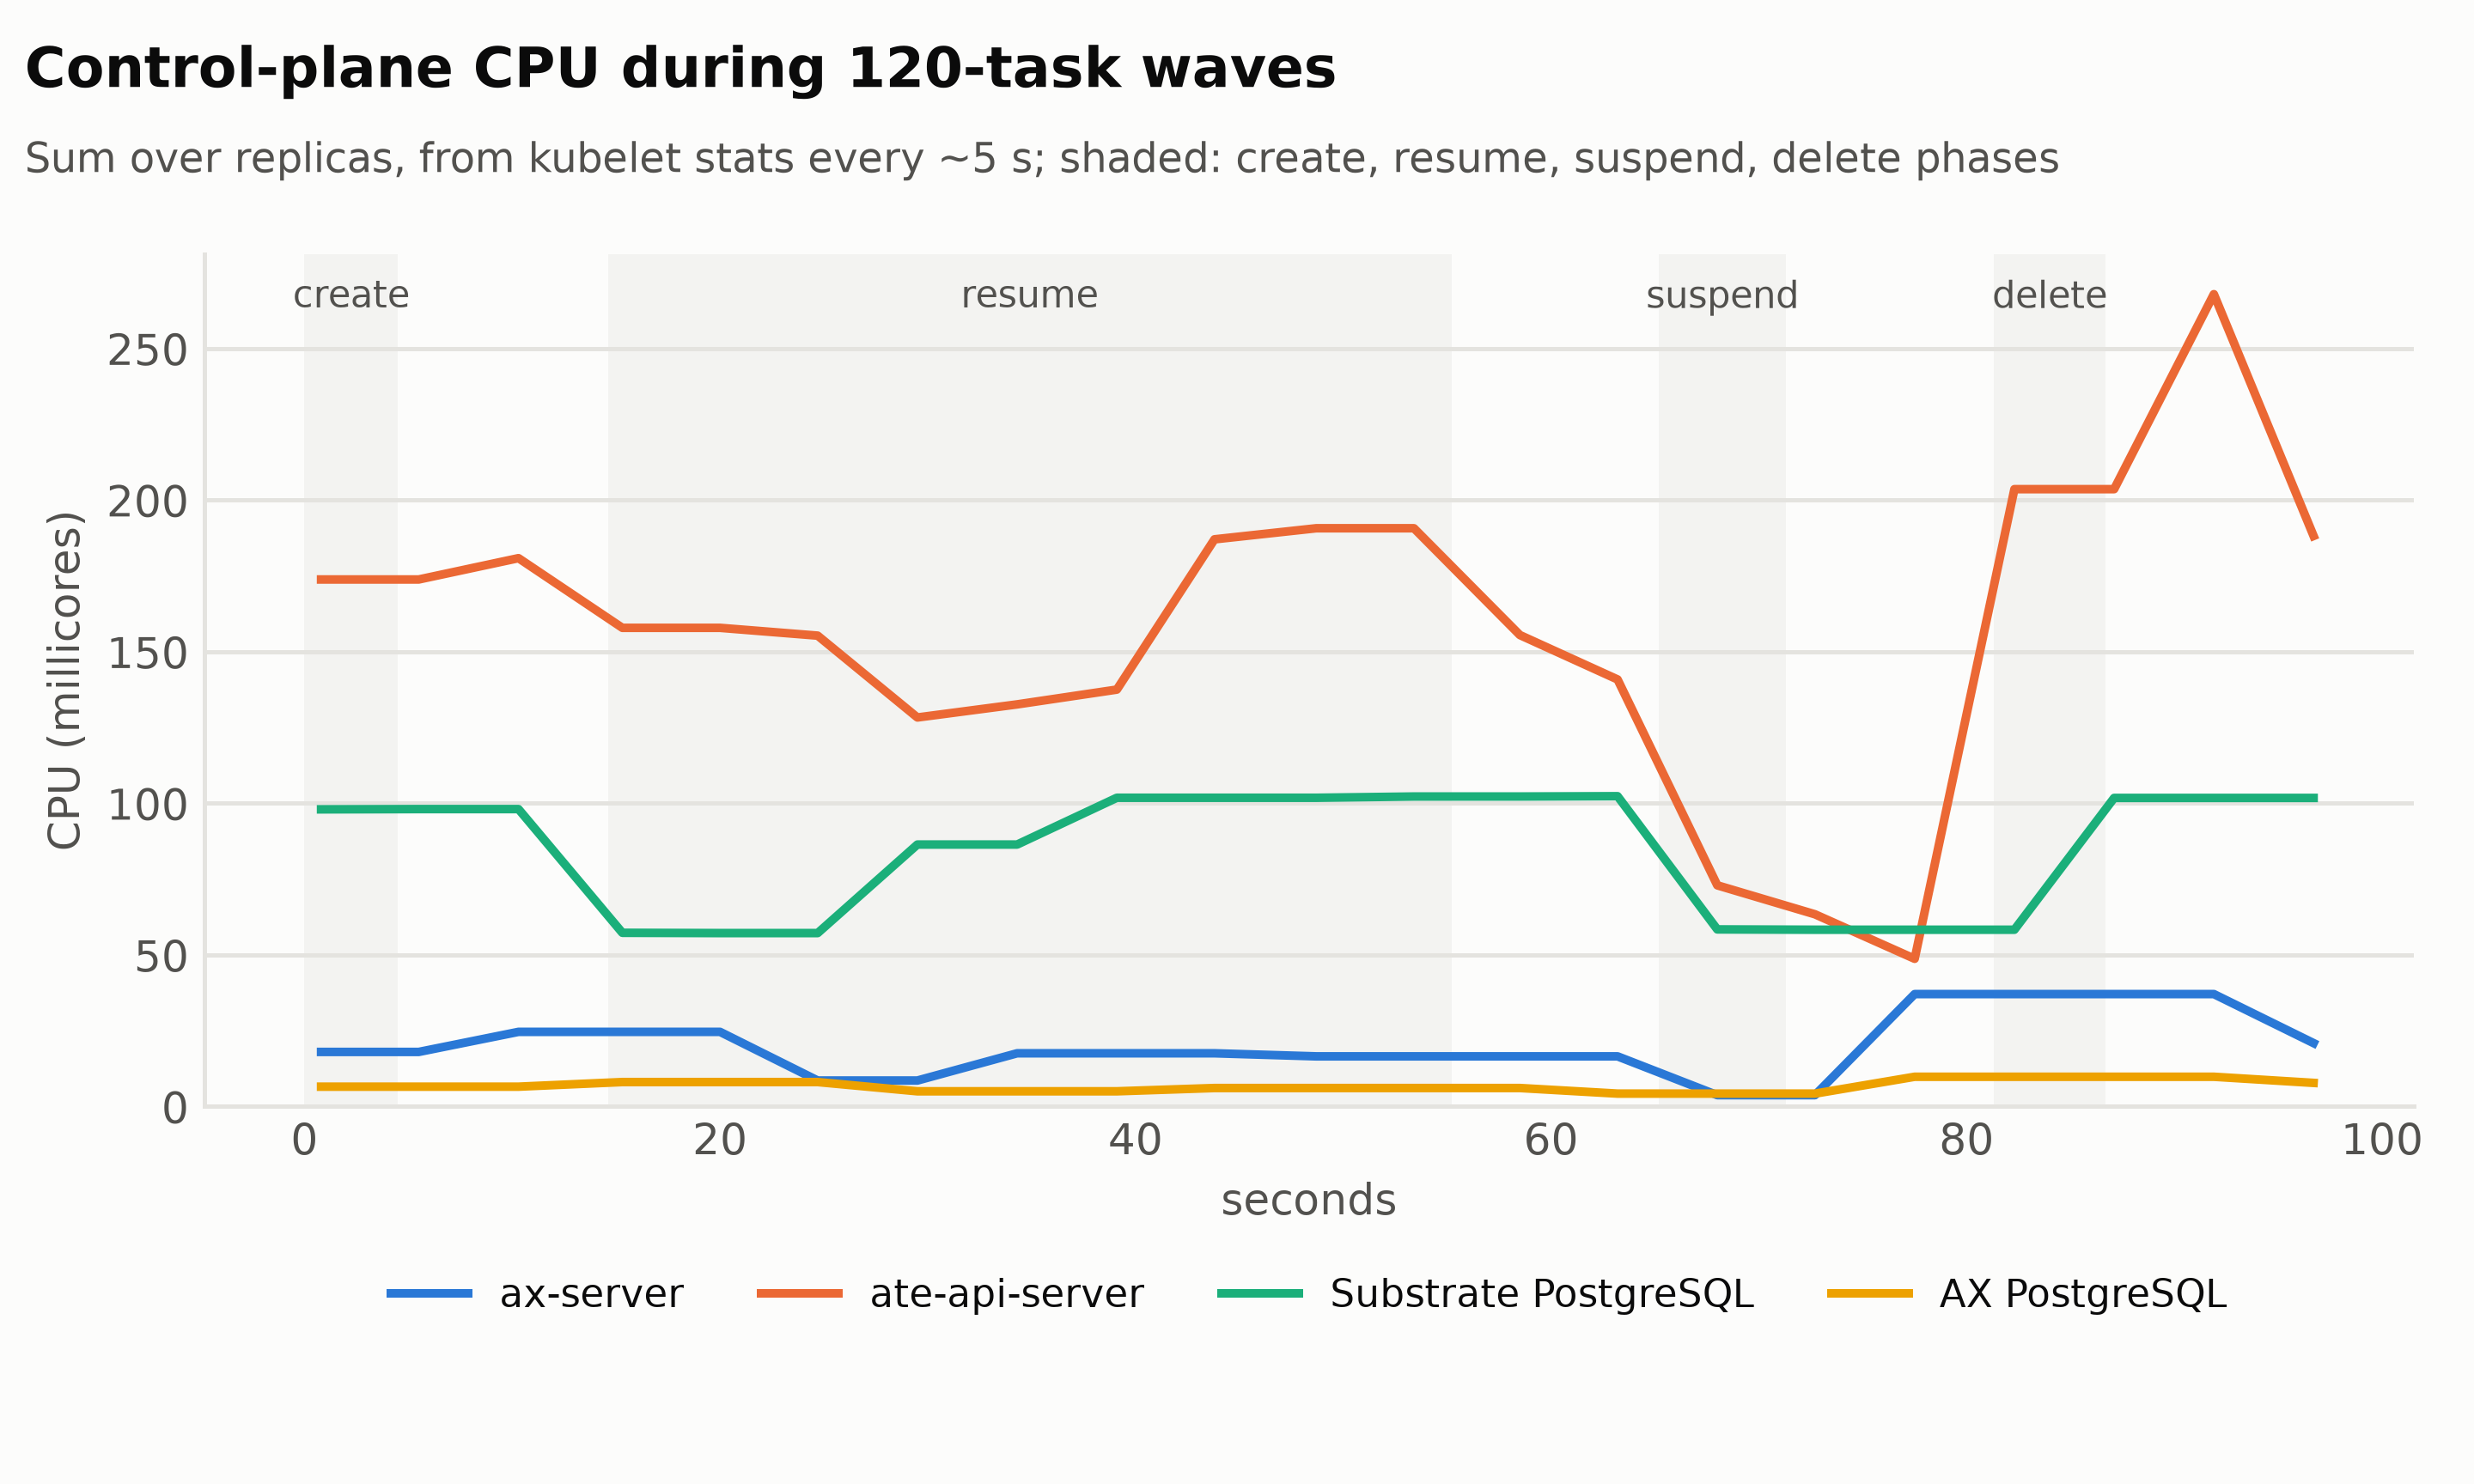
05_control_plane.py pushes 120 tiny tasks (cpu 25m) through create, resume, suspend and delete with 20 calls in flight, while the sampler records the control plane every few seconds:
== create 120 tasks, 20 at a time
  120 ok, 0 failed, 4.5 s wall, 26.4 creates/s
== resume 120 tasks, 20 at a time
  resume: n=120 p50 6305 ms, p95 7528, p99 7982
  120 ok, 0 failed, 40.7 s wall, 3.0 resumes/s
== suspend 120 tasks, 20 at a time
  120 ok, 0 failed, 6.1 s wall, 19.7 suspends/s
== delete 120 tasks, 20 at a time
  120 ok, 0 failed, 5.4 s wall, 22.4 deletes/s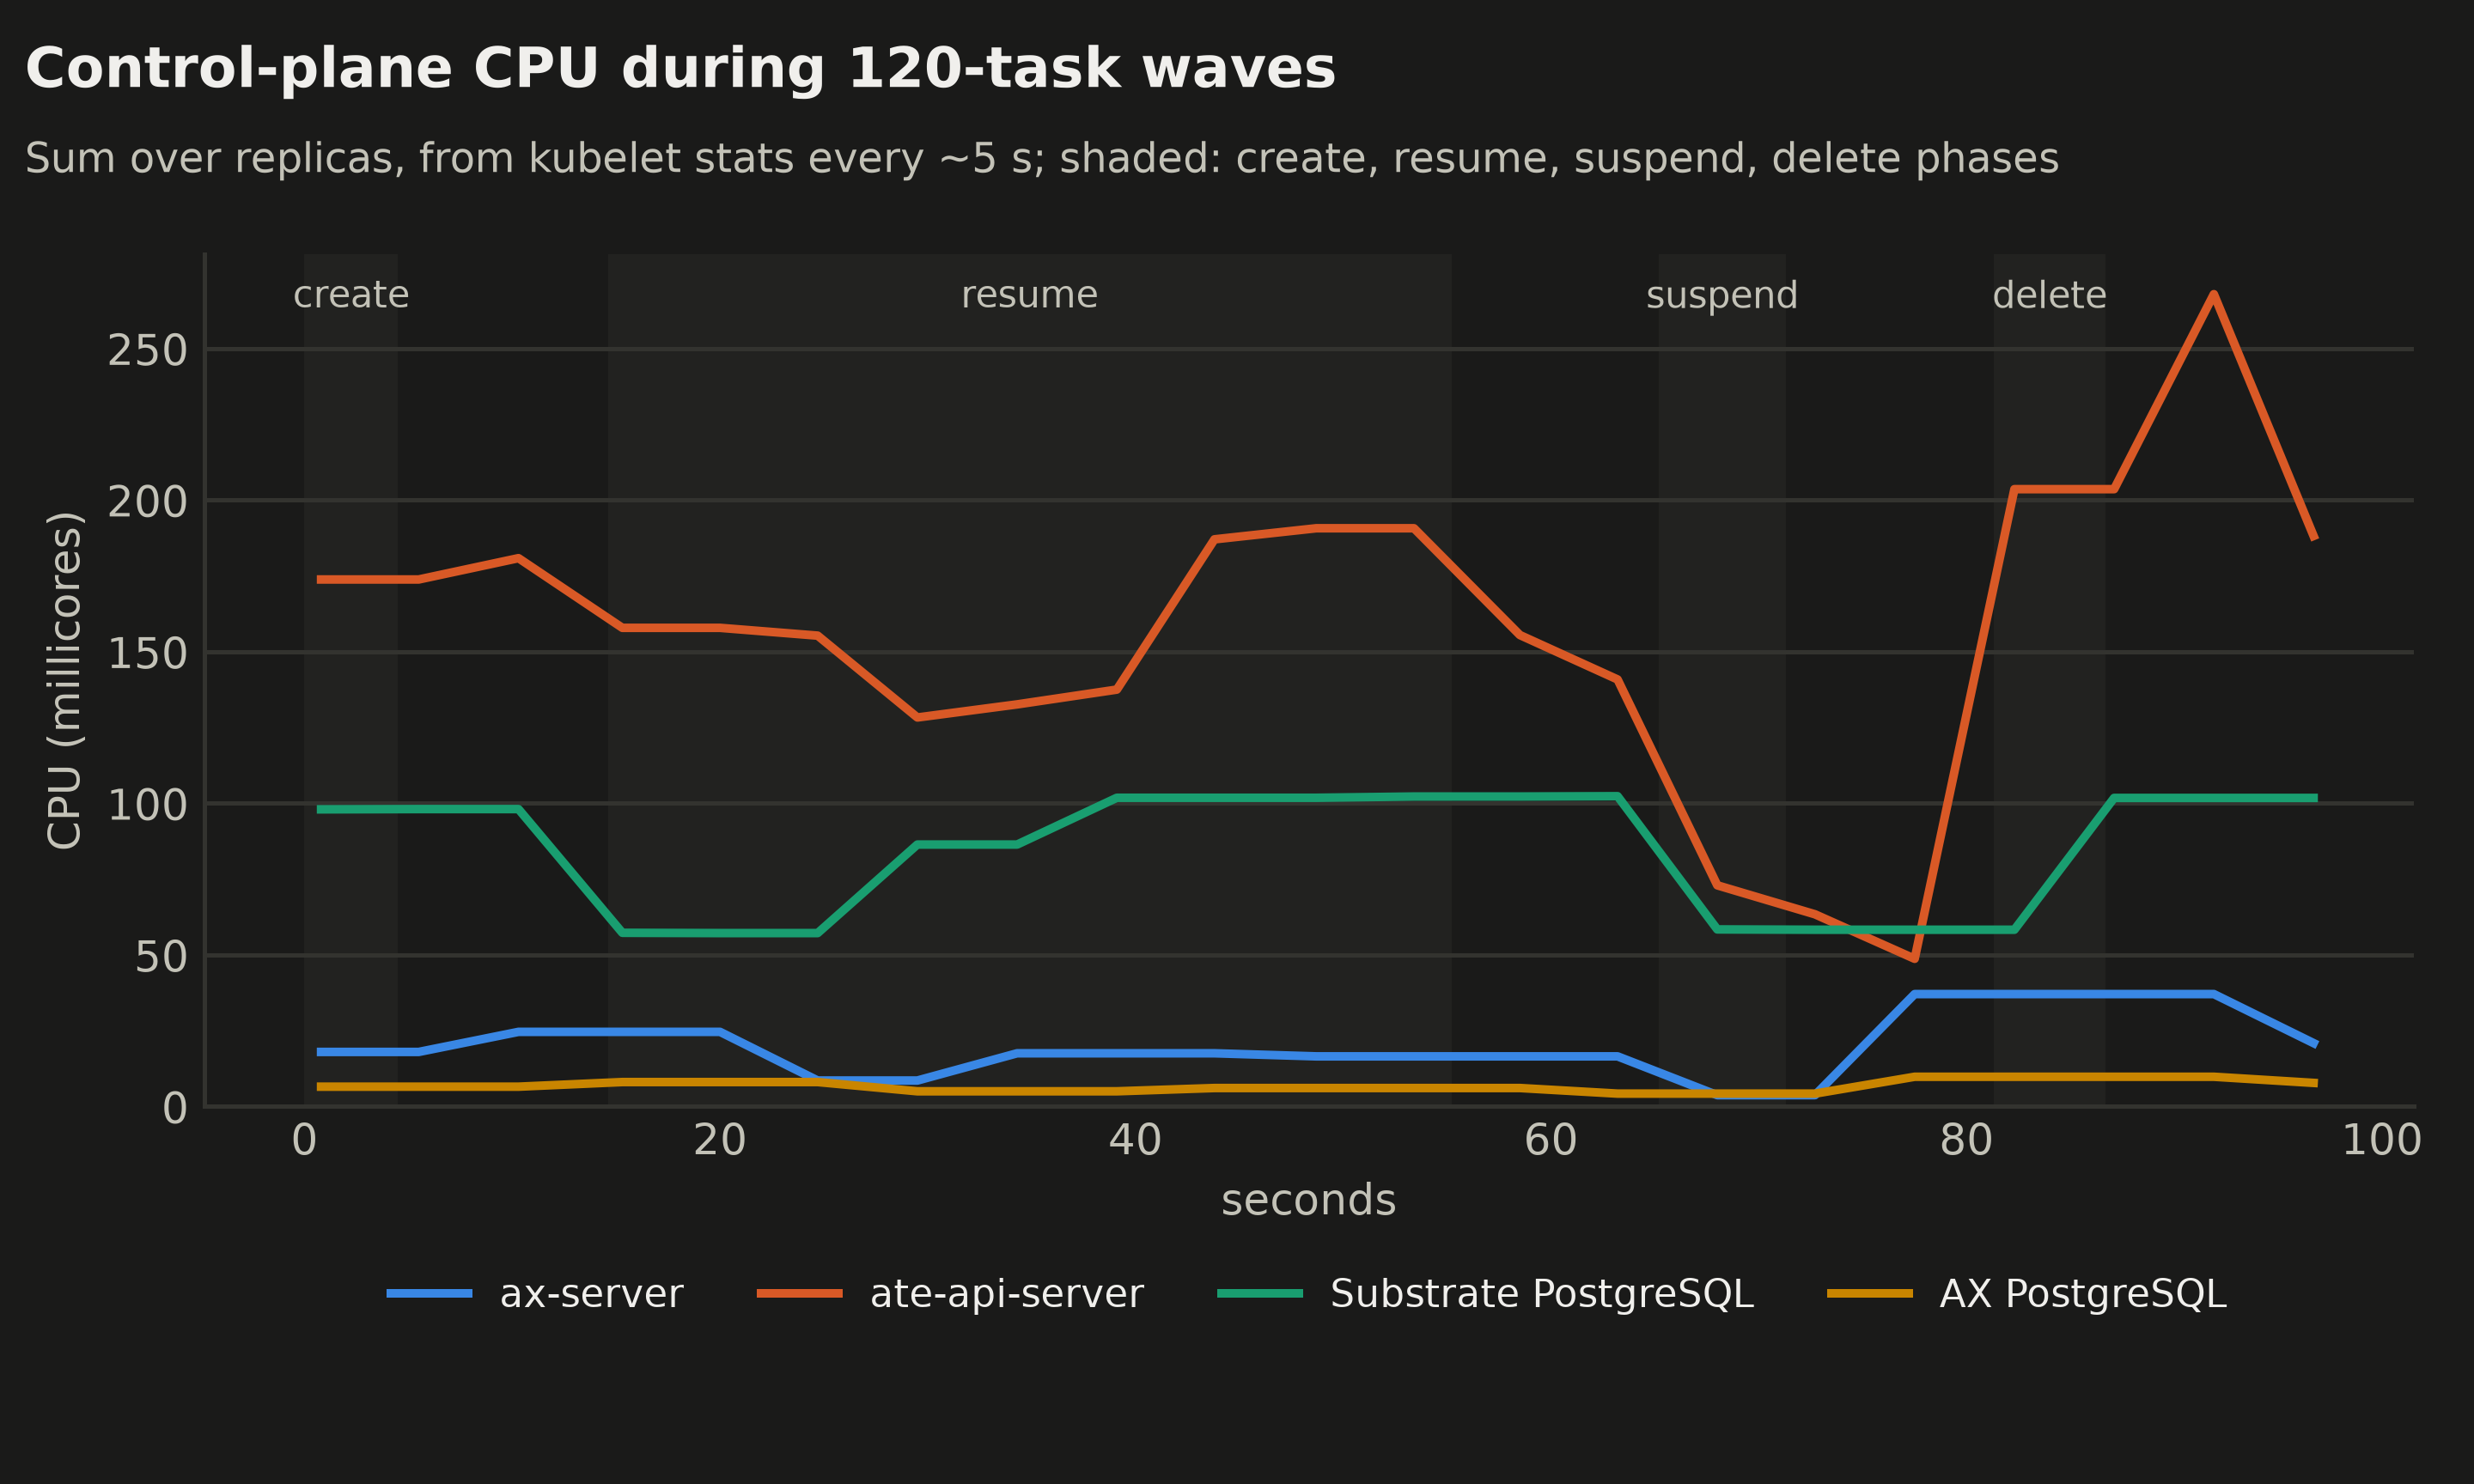
| Phase | Throughput | p50 | Peak control-plane CPU |
|---|---|---|---|
| Create | 26.4 /s | 728 ms | ate-api-server ~180m |
| Resume (first, 25m tasks) | 3.0 /s | 6,305 ms | ate-api-server ~190m, Substrate PostgreSQL ~100m |
| Suspend | 19.7 /s | 920 ms | ate-api-server ~75m |
| Delete | 22.4 /s | 848 ms | ate-api-server ~200m |
The control plane was never the bottleneck. ate-api-server peaked at about a third of a core, Substrate’s PostgreSQL at a tenth, ax-server under 40 millicores and AX’s own PostgreSQL around 10; all four together stayed around half a core. Resume throughput (3 per second) was set by the sandboxes: 120 first boots at 25 millicores each. So I can’t confirm or refute “over 500 activations per second”; on two nodes, through AX’s CLI, the sandboxes run out long before Substrate’s API does. Substrate’s README goes further, at 1,500 activations per second; the only benchmark scenario in the repo that reaches that rate replaces the data plane with a fake, which would measure exactly the part that wasn’t my limit.
Test 5: Noisy neighbors
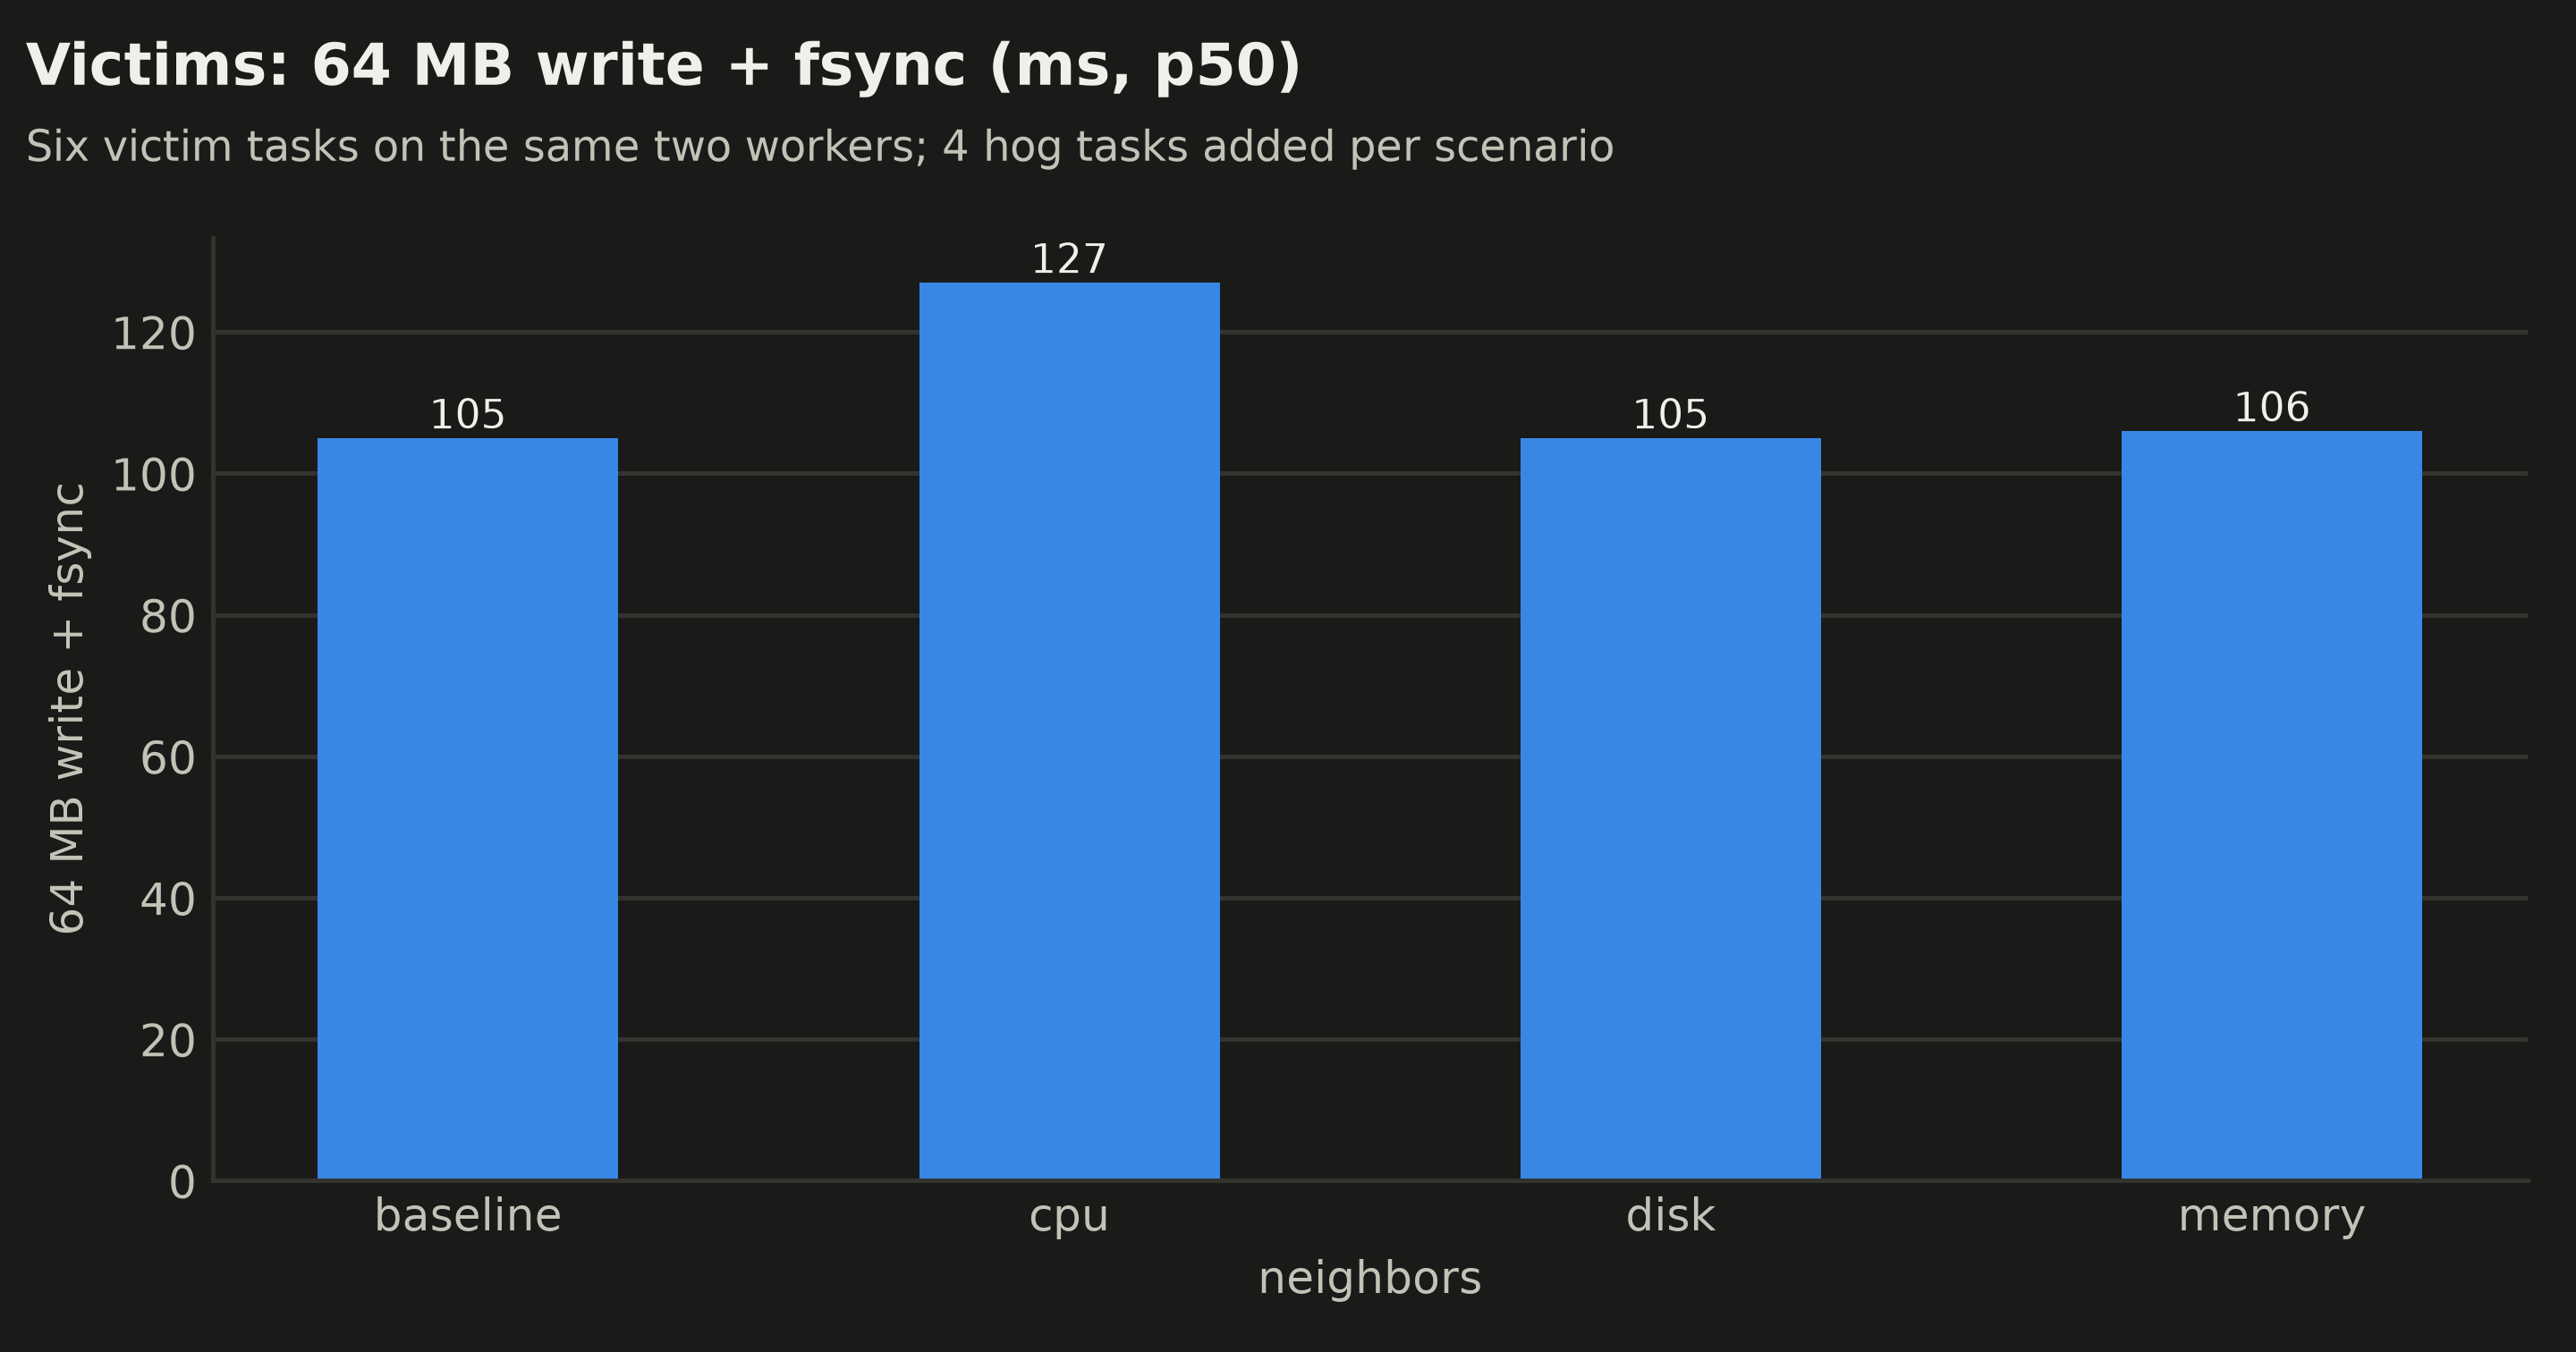
06_noisy.py starts six victim tasks (cpu 250m) that each run a fixed CPU benchmark and a 64 MB write with fsync, then adds four neighbors of each kind and measures again:
HOGS = {
    "cpu": (["sh", "-c", "for i in 1 2; do (while :; do :; done) & done; wait"], {"cpu": "1"}),
    "disk": (["sh", "-c", "while :; do dd if=/dev/zero of=/workspace/fill bs=1M count=512 conv=fsync; done"], {"cpu": "500m"}),
    "memory": (["python3", "-c", "b=[]\nwhile True: b.append(bytearray(64*2**20))"], {"memory": "512Mi"}),
}  # abbreviated: each hog also sets cpu, see 06_noisy.py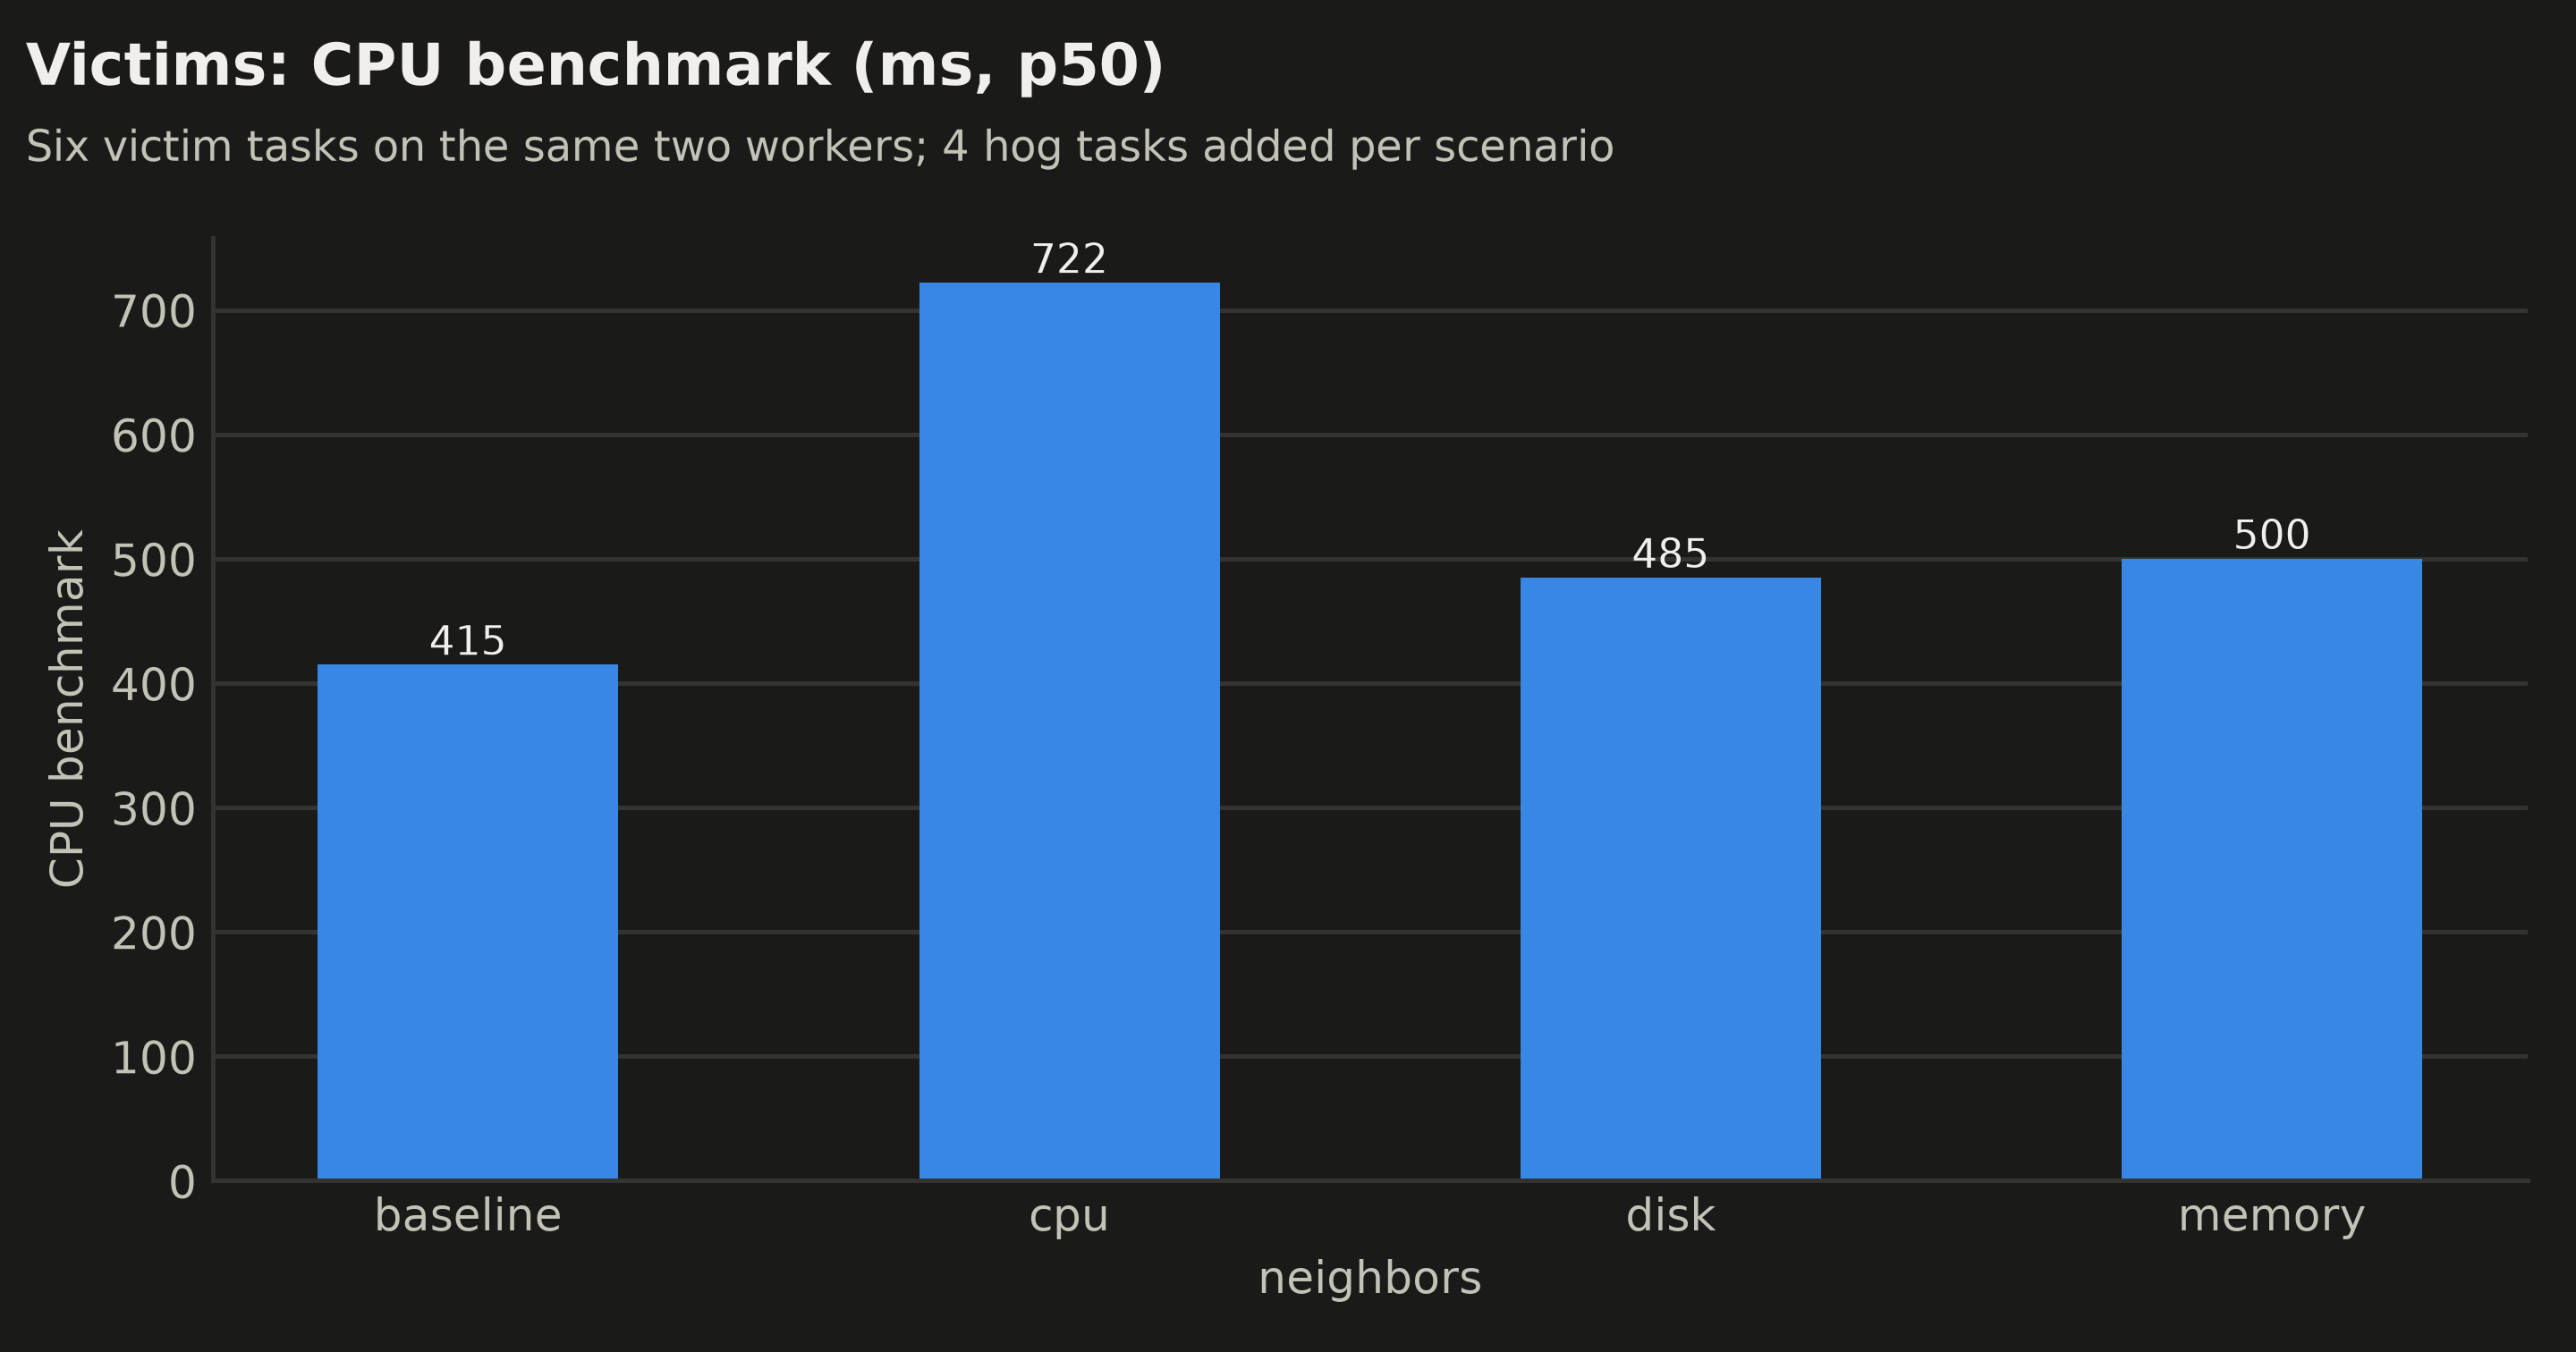
| Neighbors | CPU benchmark p50 | Write + fsync p50 / p95 | Suspend p50 / p95 |
|---|---|---|---|
| None | 415 ms | 105 / 192 ms | 1,805 / 1,836 ms |
| 4 CPU hogs (1 CPU each) | 722 ms | 127 / 180 ms | 1,329 / 1,753 ms |
| 4 disk hogs | 485 ms | 105 / 1,097 ms | 1,295 / 3,543 ms |
| 4 memory hogs (512Mi, allocating forever) | 500 ms | 106 / 191 ms | 1,654 / 1,825 ms |
CPU limits are a cap, not a guarantee. Each victim was limited to 250 millicores, yet with four CPU-burning neighbors its fixed benchmark took 74% longer. The limits Substrate applies stop a sandbox from taking more than its share; they don’t reserve that share for it when the node is busy. Disk hogs left the median write alone but blew out the tail: p95 writes went from 192 ms to 1.1 s, and a victim’s p95 suspend, which copies its workspace, to 3.5 s. Memory hogs did little to their neighbors; the sandbox’s memory limit held, and AX kept reporting the hogs as Running.
Test 6: Snapshot storm
07_snapshot_storm.py has 20 tasks write 100 MB of random data each, suspends them all at once, and watches Substrate’s record until every snapshot is durable in S3:
== suspend all 20 at once
  suspend: n=20 p50 1124 ms, p95 1879, p99 1879, max 1879
== wait for every snapshot to be durable in S3
  +   5s   0/20 durable
  ...
  + 300s   0/20 durable
  + 325s  20/20 durable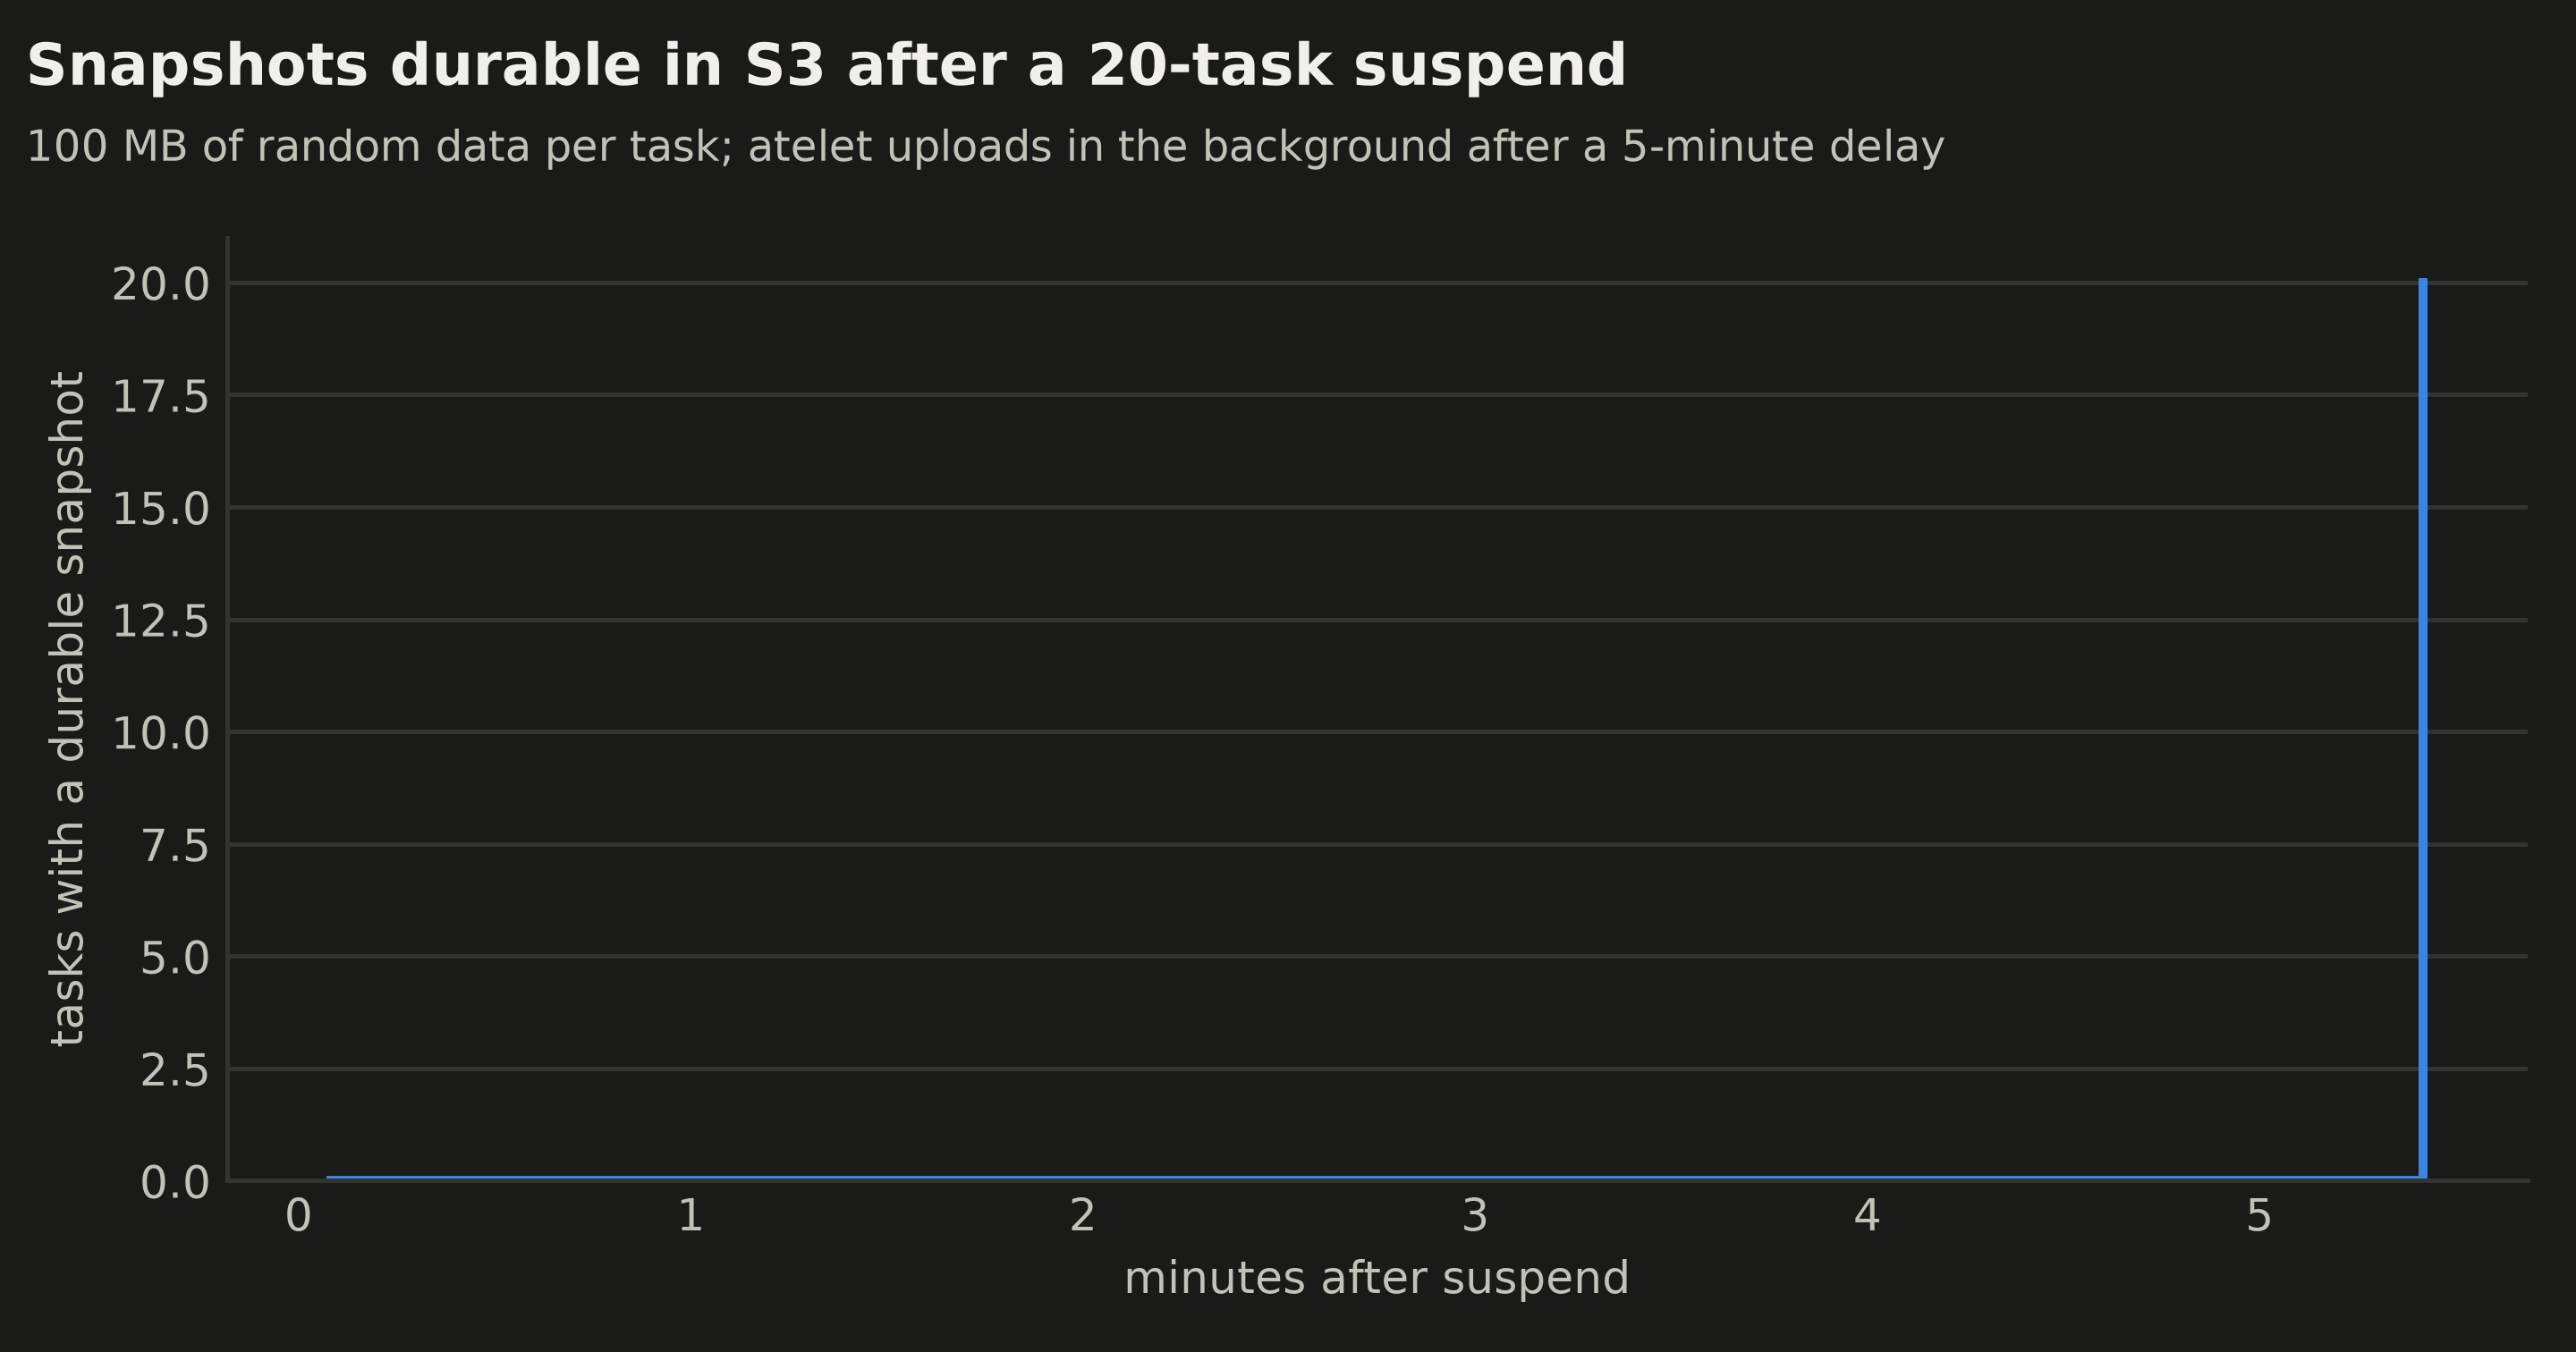
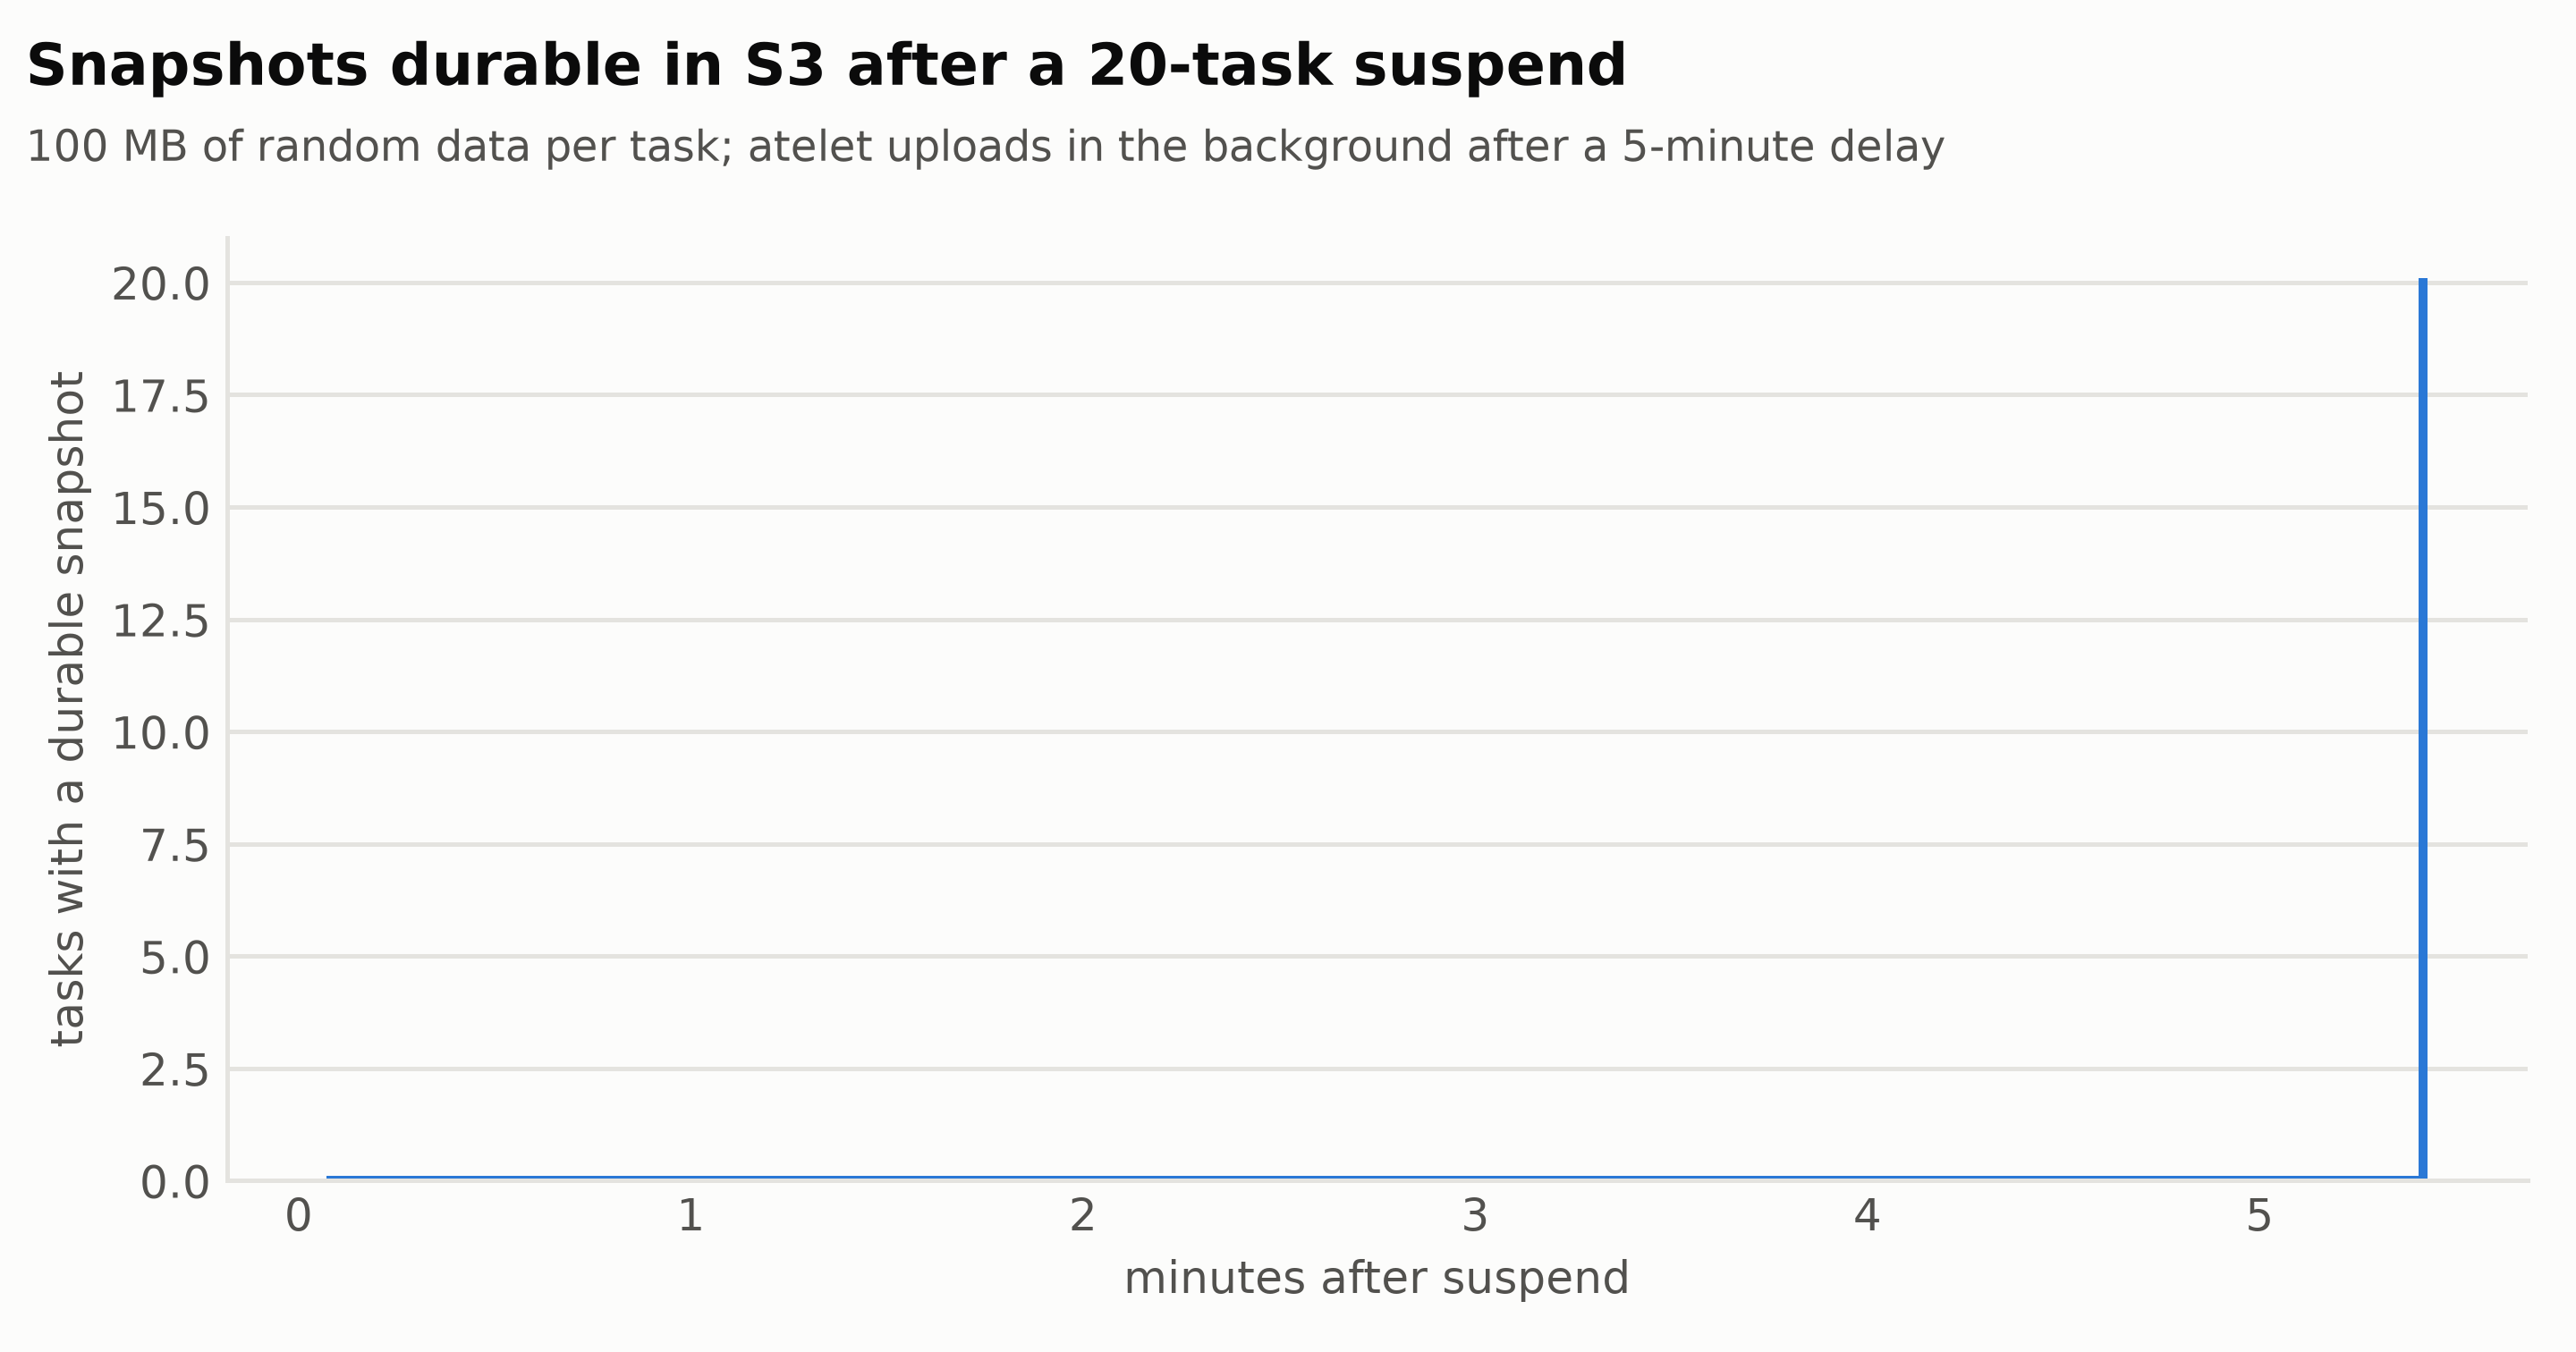
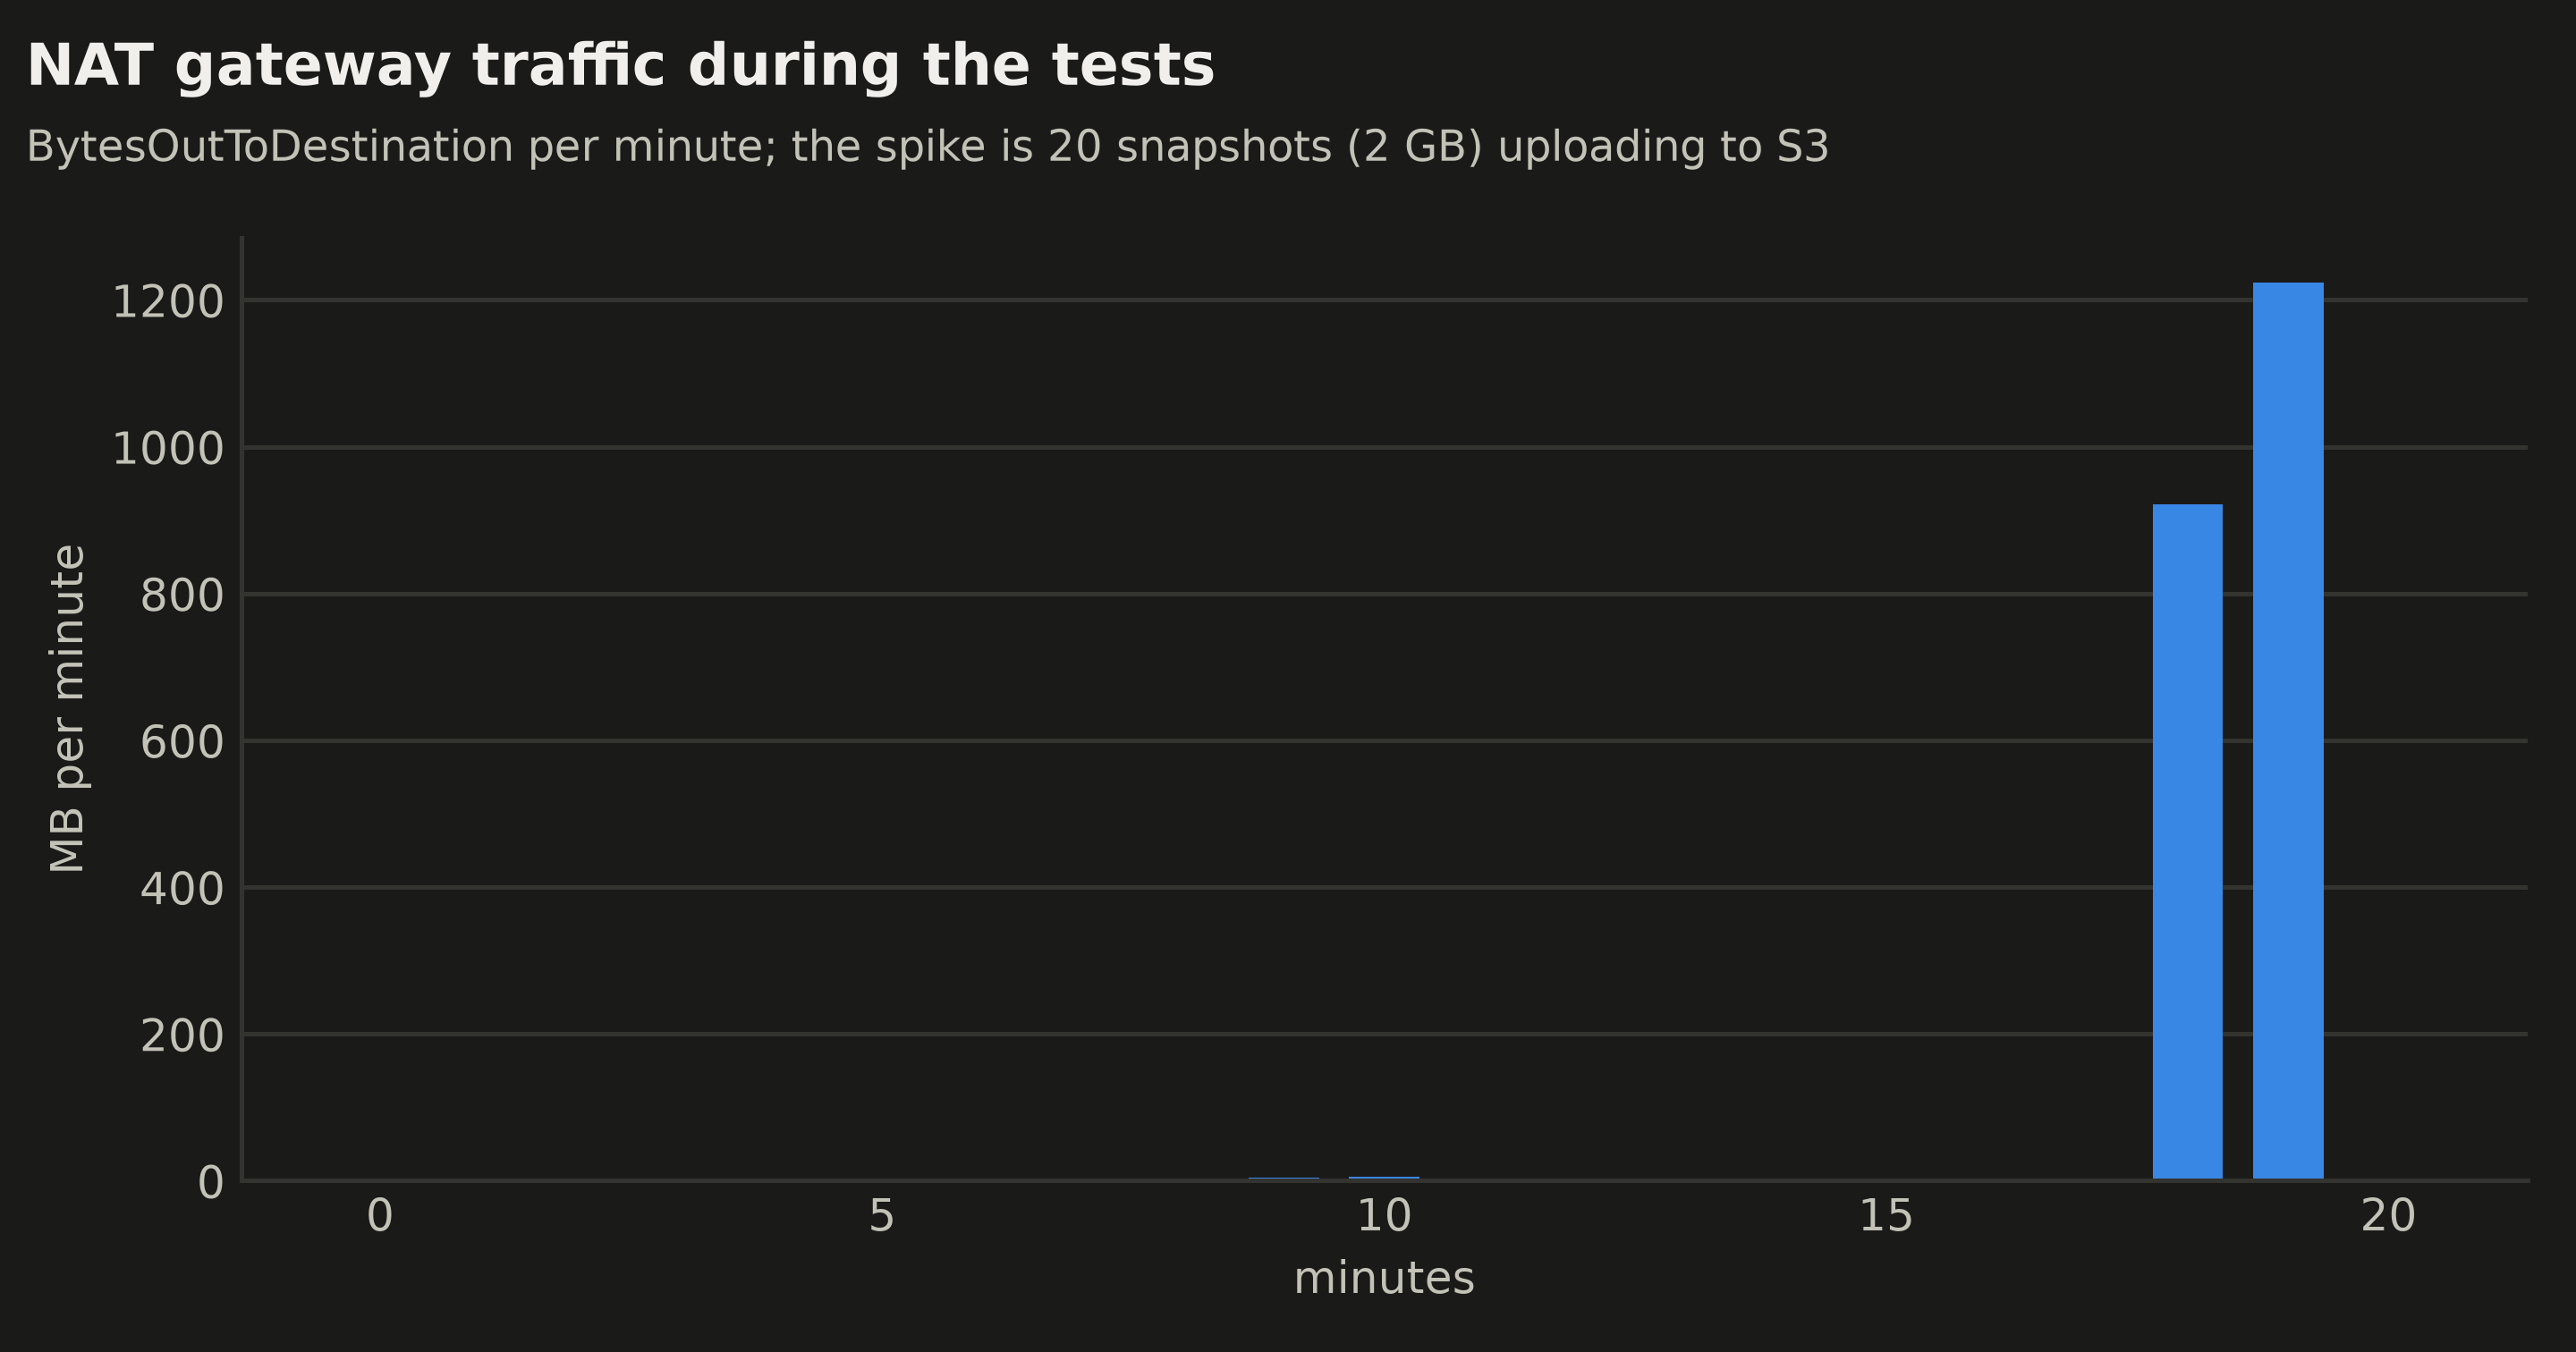
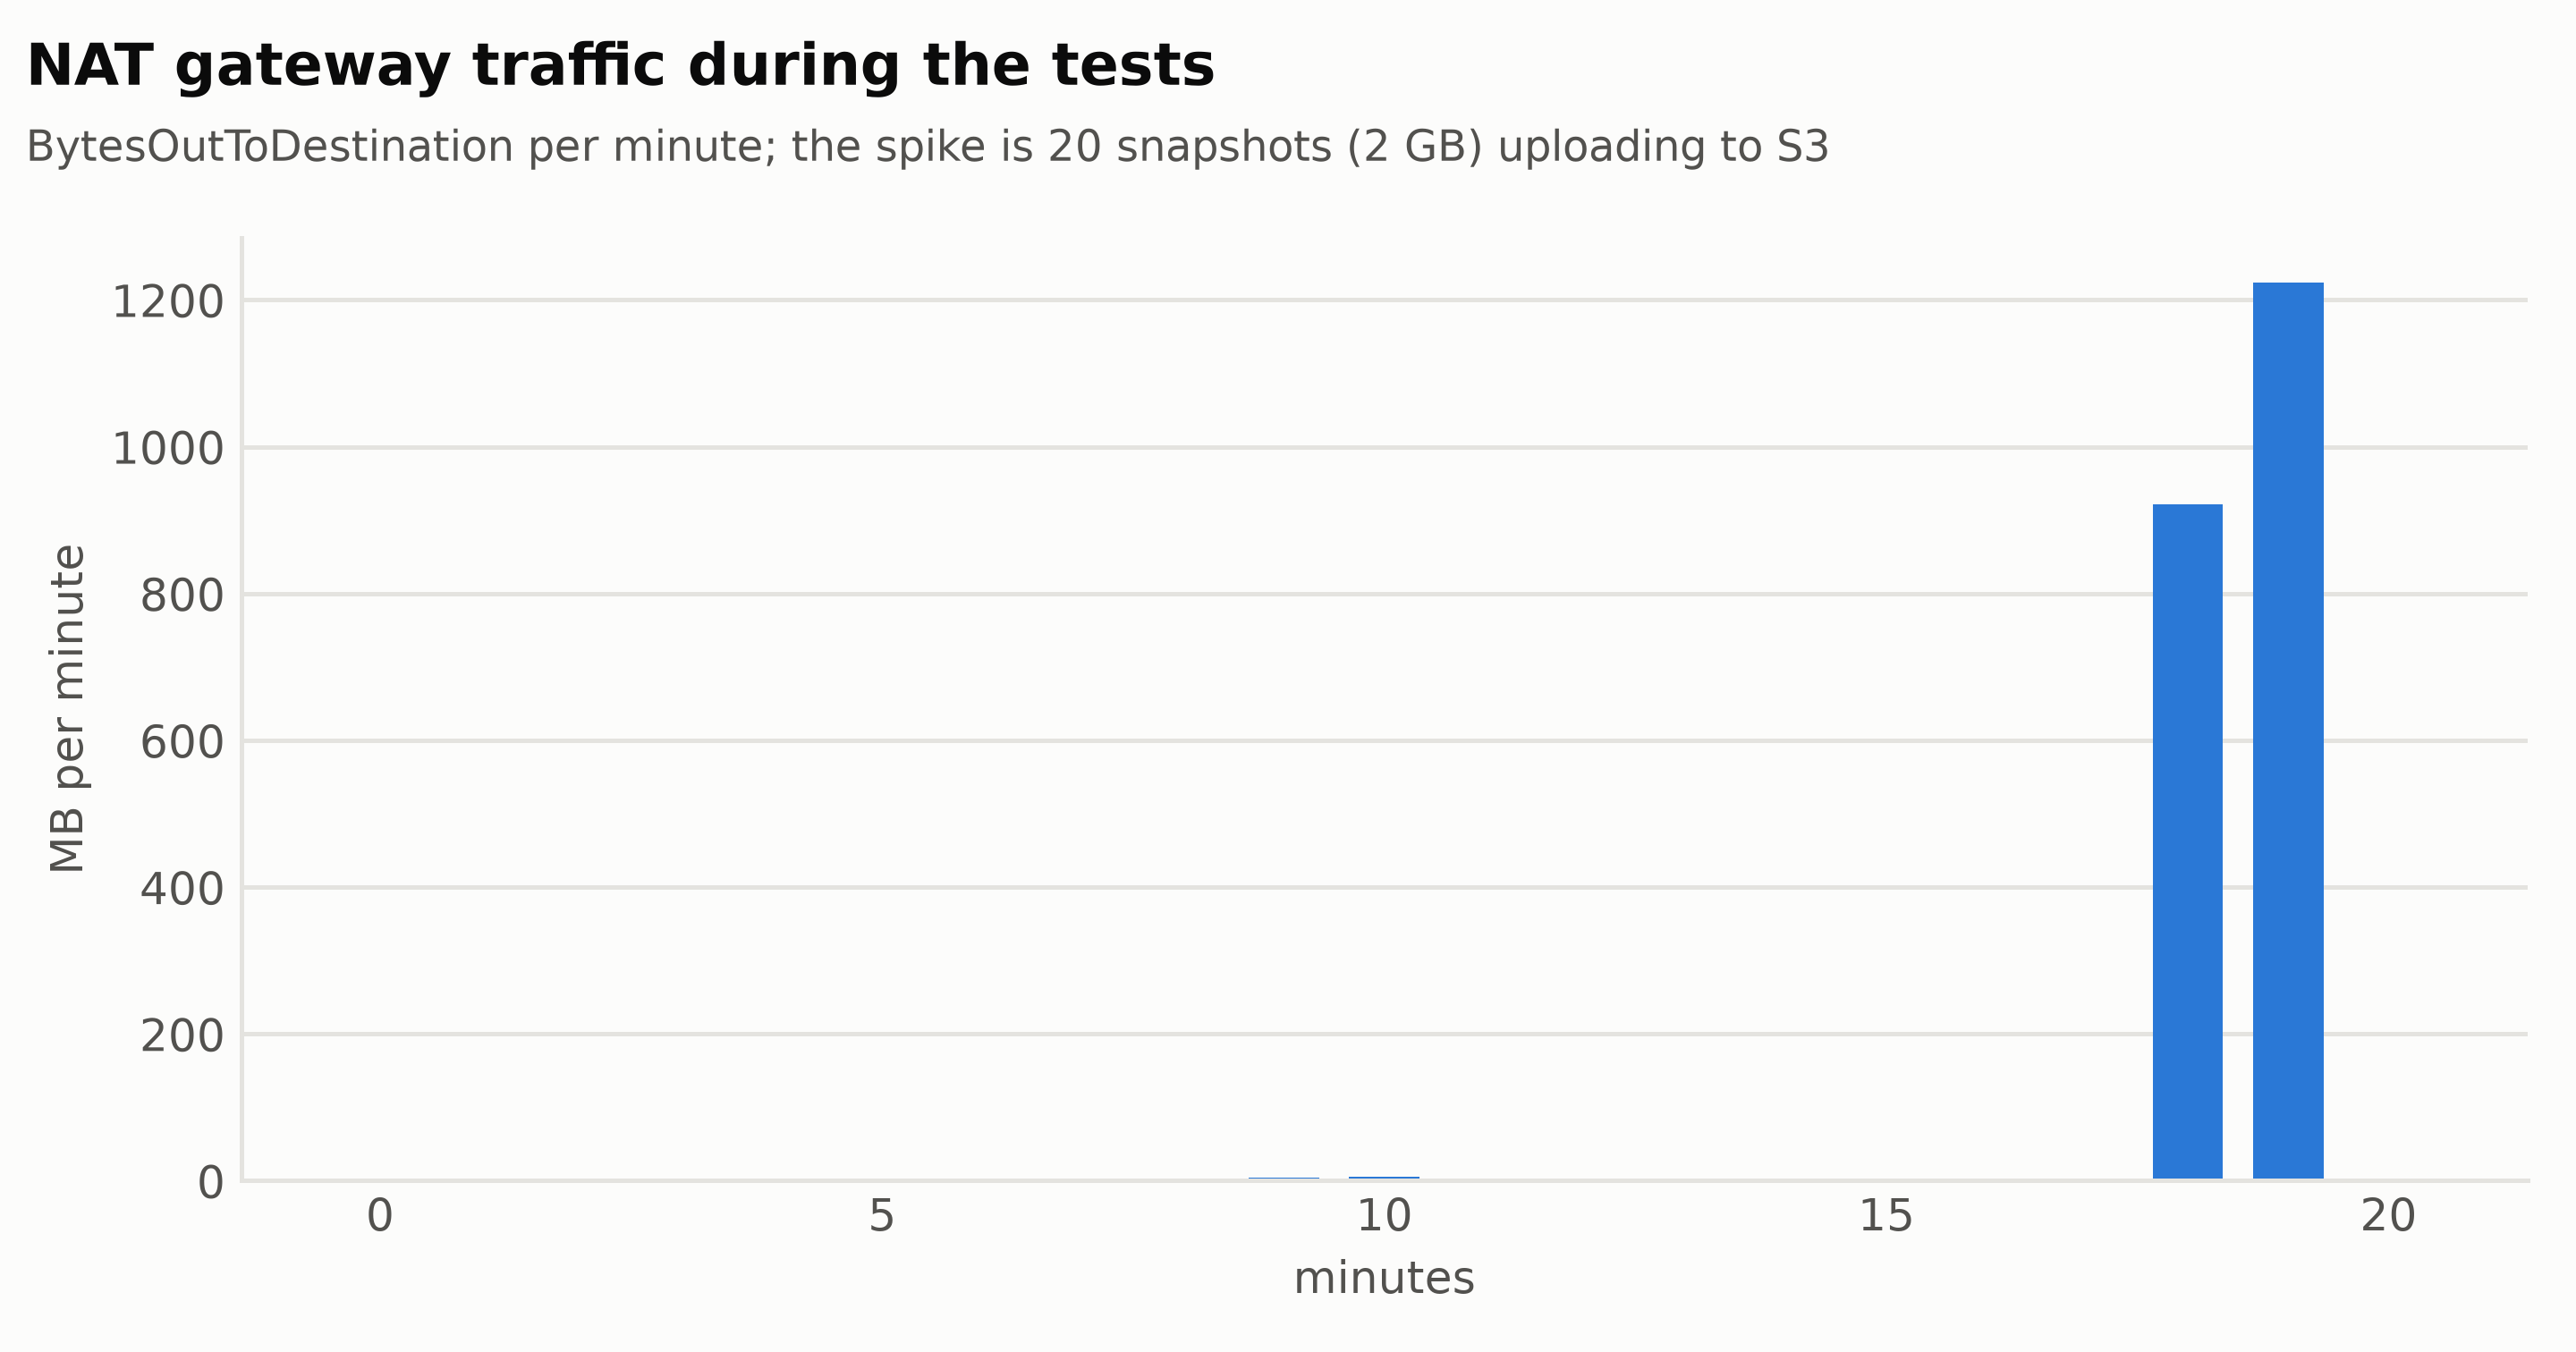
The suspends themselves took about a second each, all 20 at once. Then nothing for five minutes, Substrate’s default upload delay, and all 20 snapshots, 2 GB, became durable together. The NAT gateway chart shows where those bytes went: out through the NAT gateway, about 2.1 GB in two minutes. The VPC from the install post has no S3 endpoint, so every snapshot upload pays NAT data processing ($0.045 per GB in us-east-1). That’s small here and real at scale, and a gateway VPC endpoint for S3 is free. Add one before snapshots start flowing:
module "vpc" {
  # ...
}

resource "aws_vpc_endpoint" "s3" {
  vpc_id            = module.vpc.vpc_id
  service_name      = "com.amazonaws.${var.region}.s3"
  vpc_endpoint_type = "Gateway"
  route_table_ids   = module.vpc.private_route_table_ids
}
Upstream’s #2806 reports suspends of up to two minutes under co-located load, caused by serialized uploads. My data can’t rule that bottleneck out, but here it didn’t touch the suspends: they returned in about a second and the uploads happened afterwards, within two minutes.
What CloudWatch saw
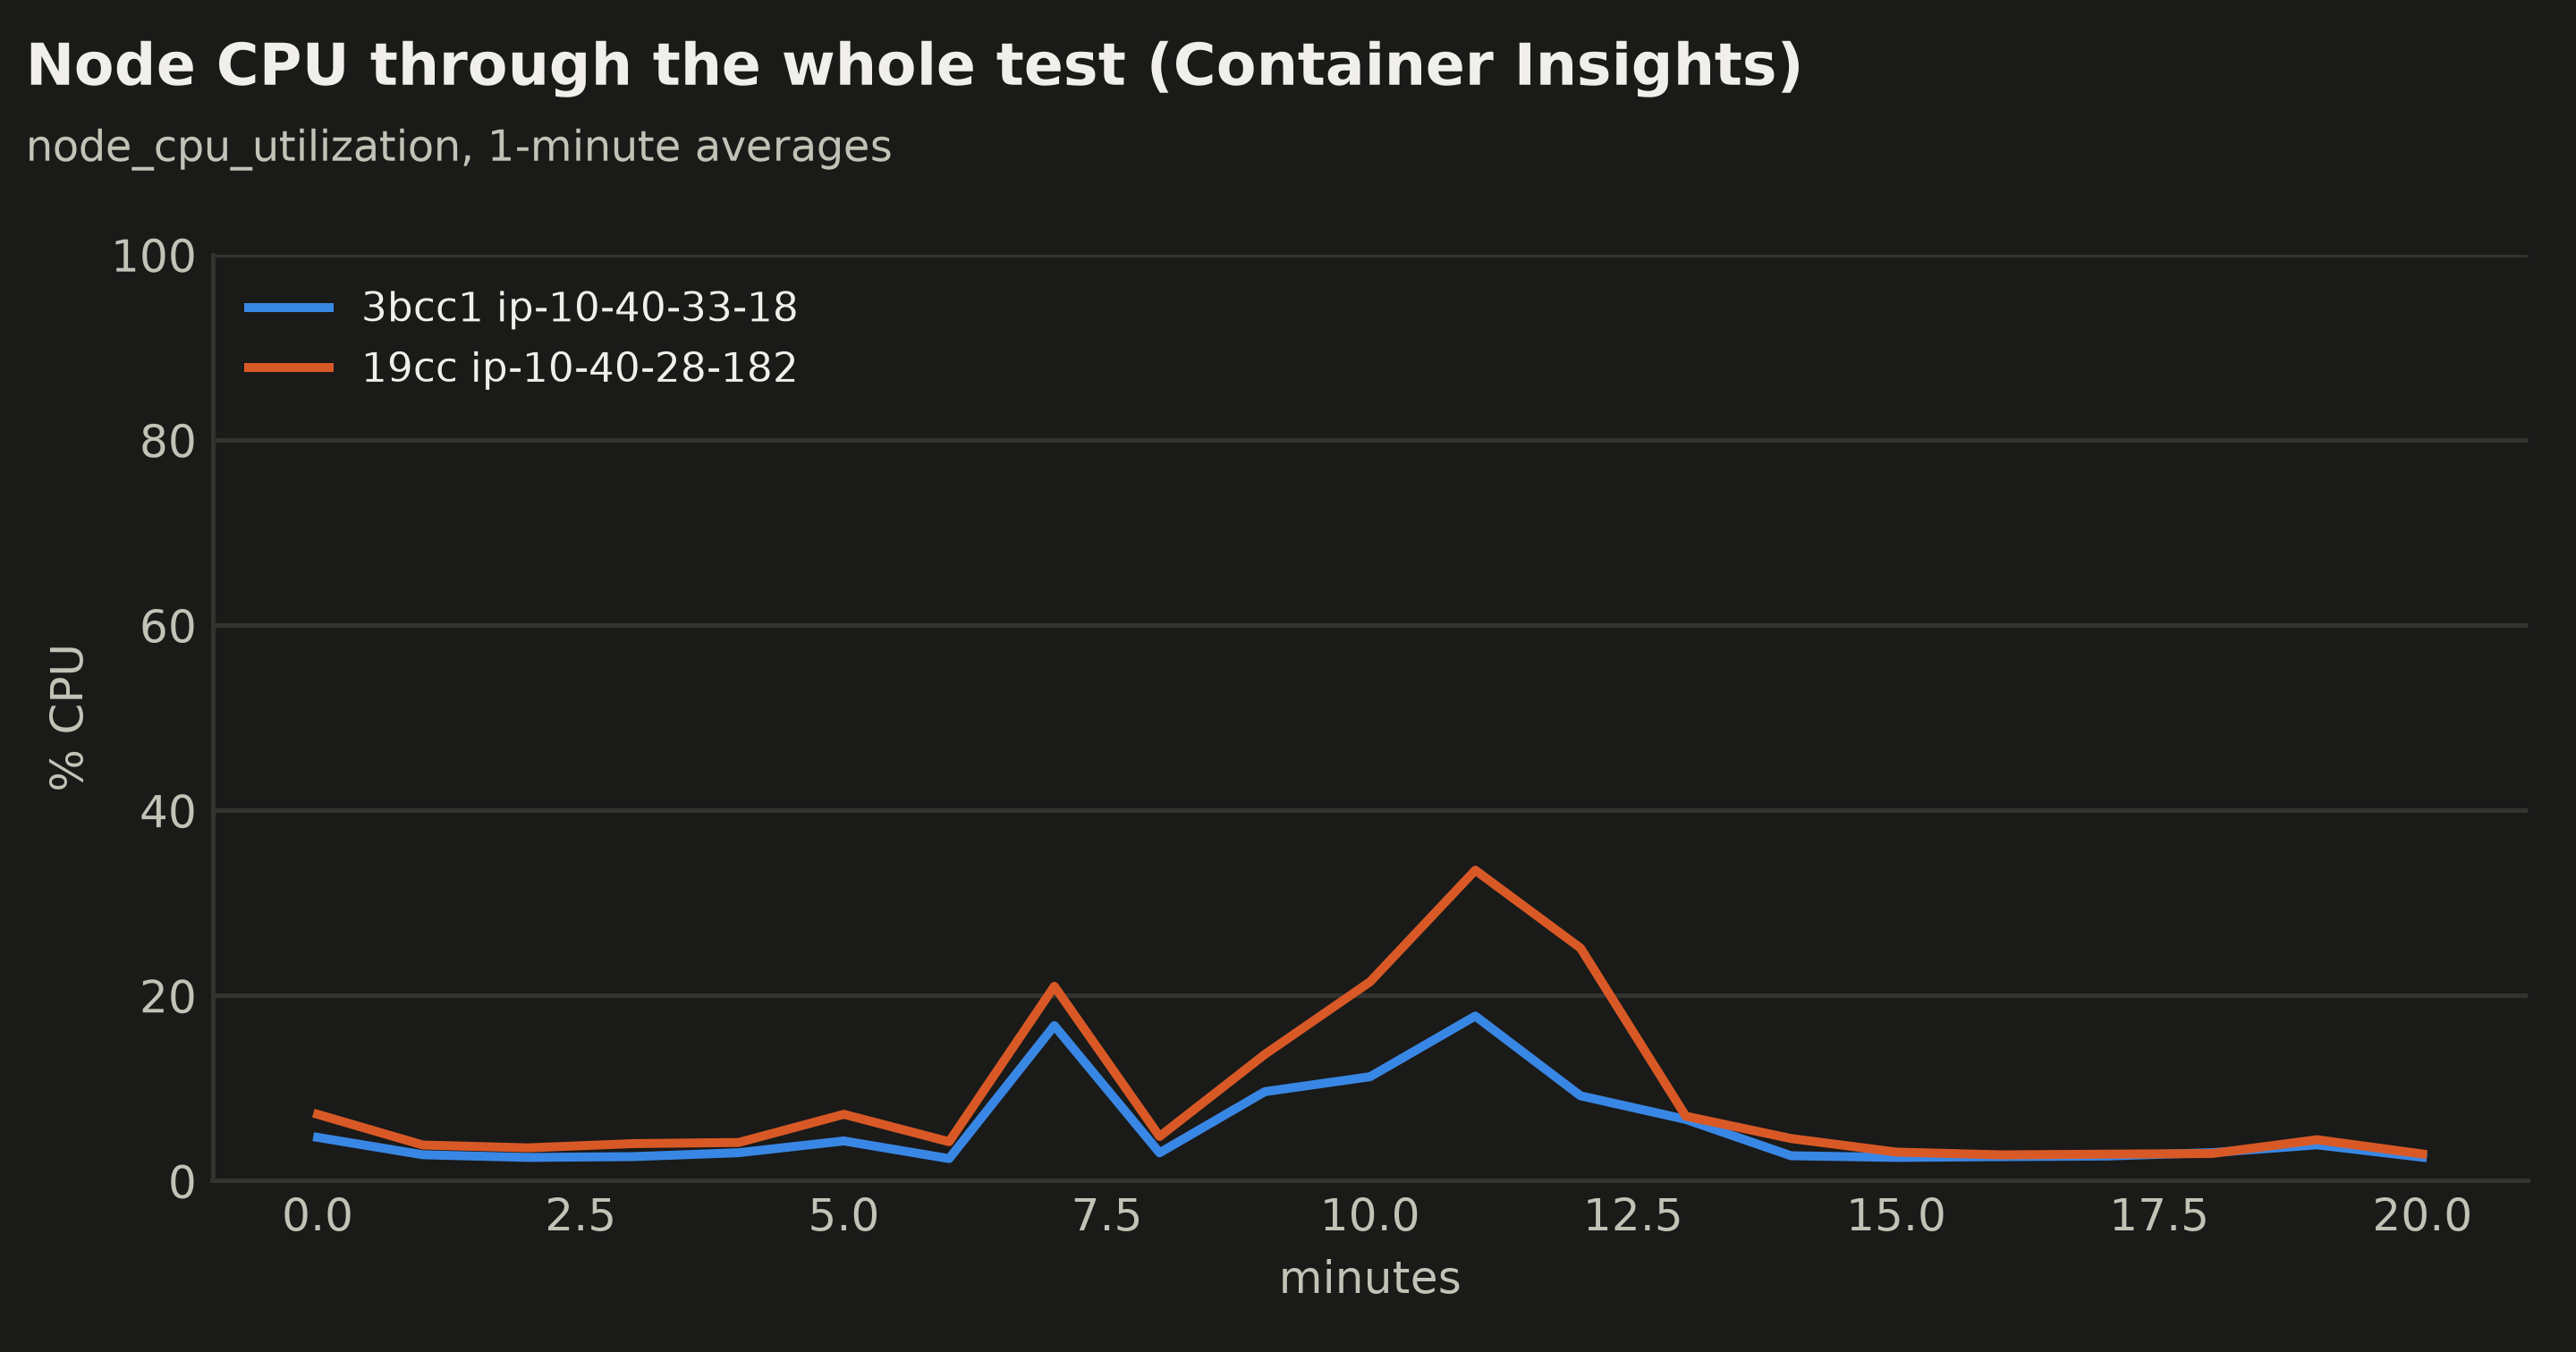
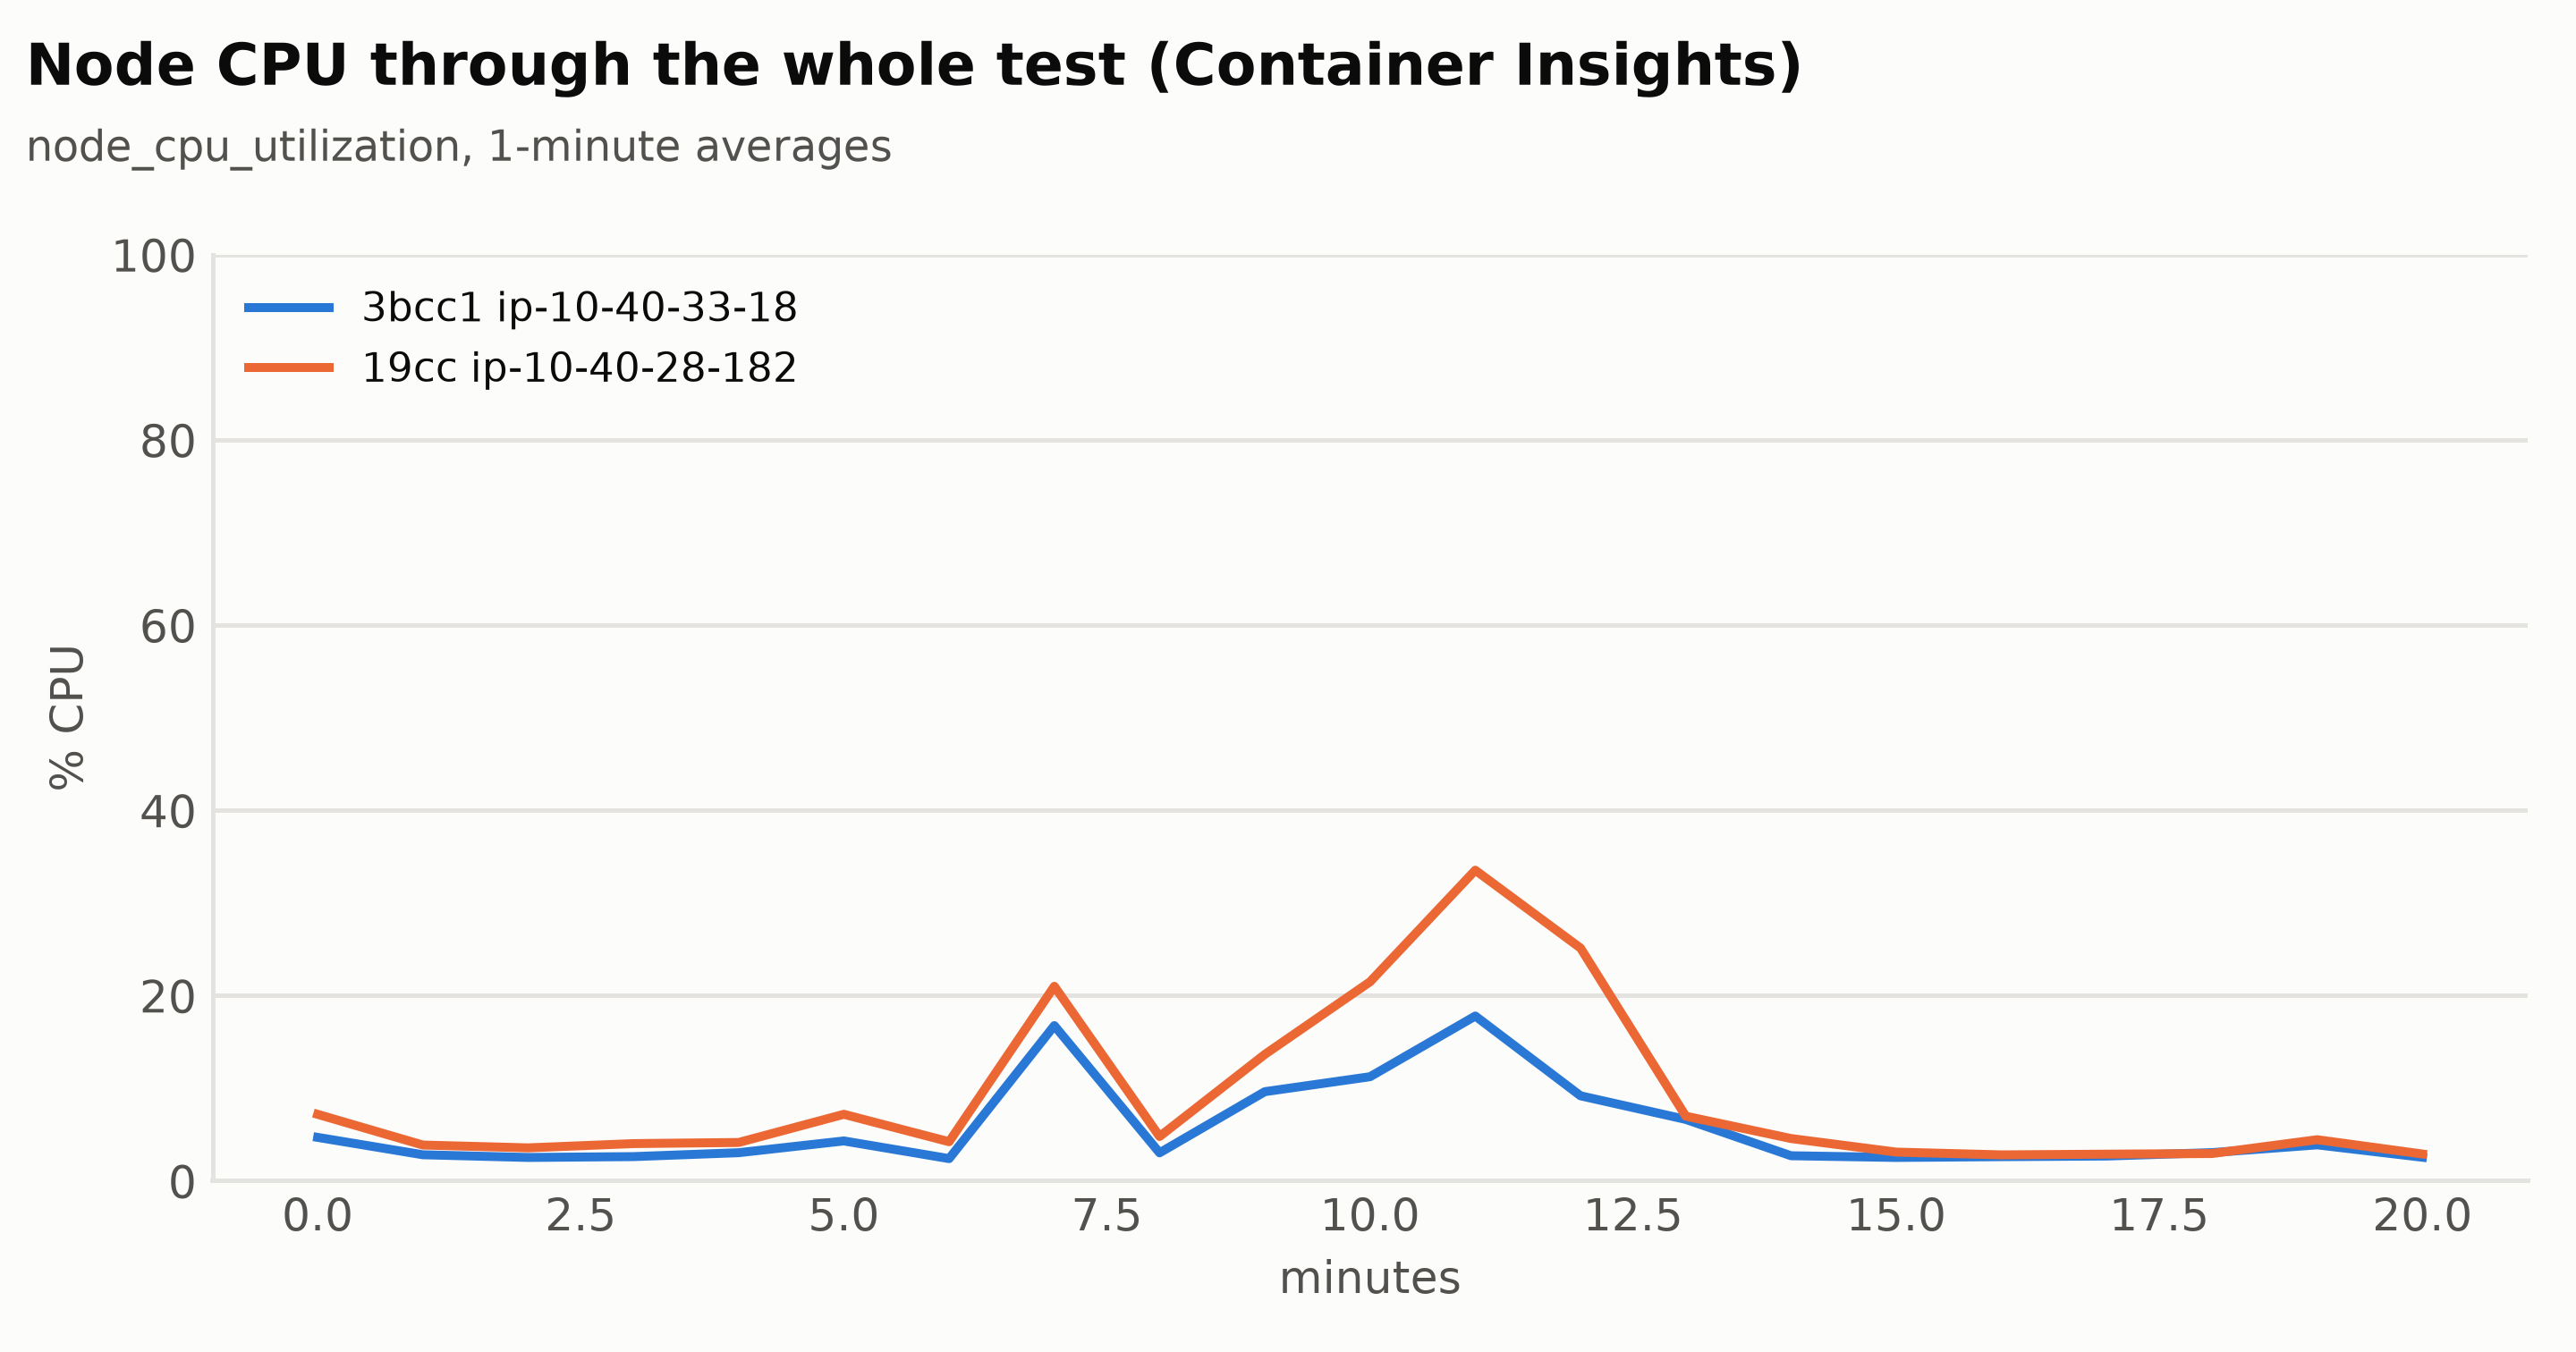
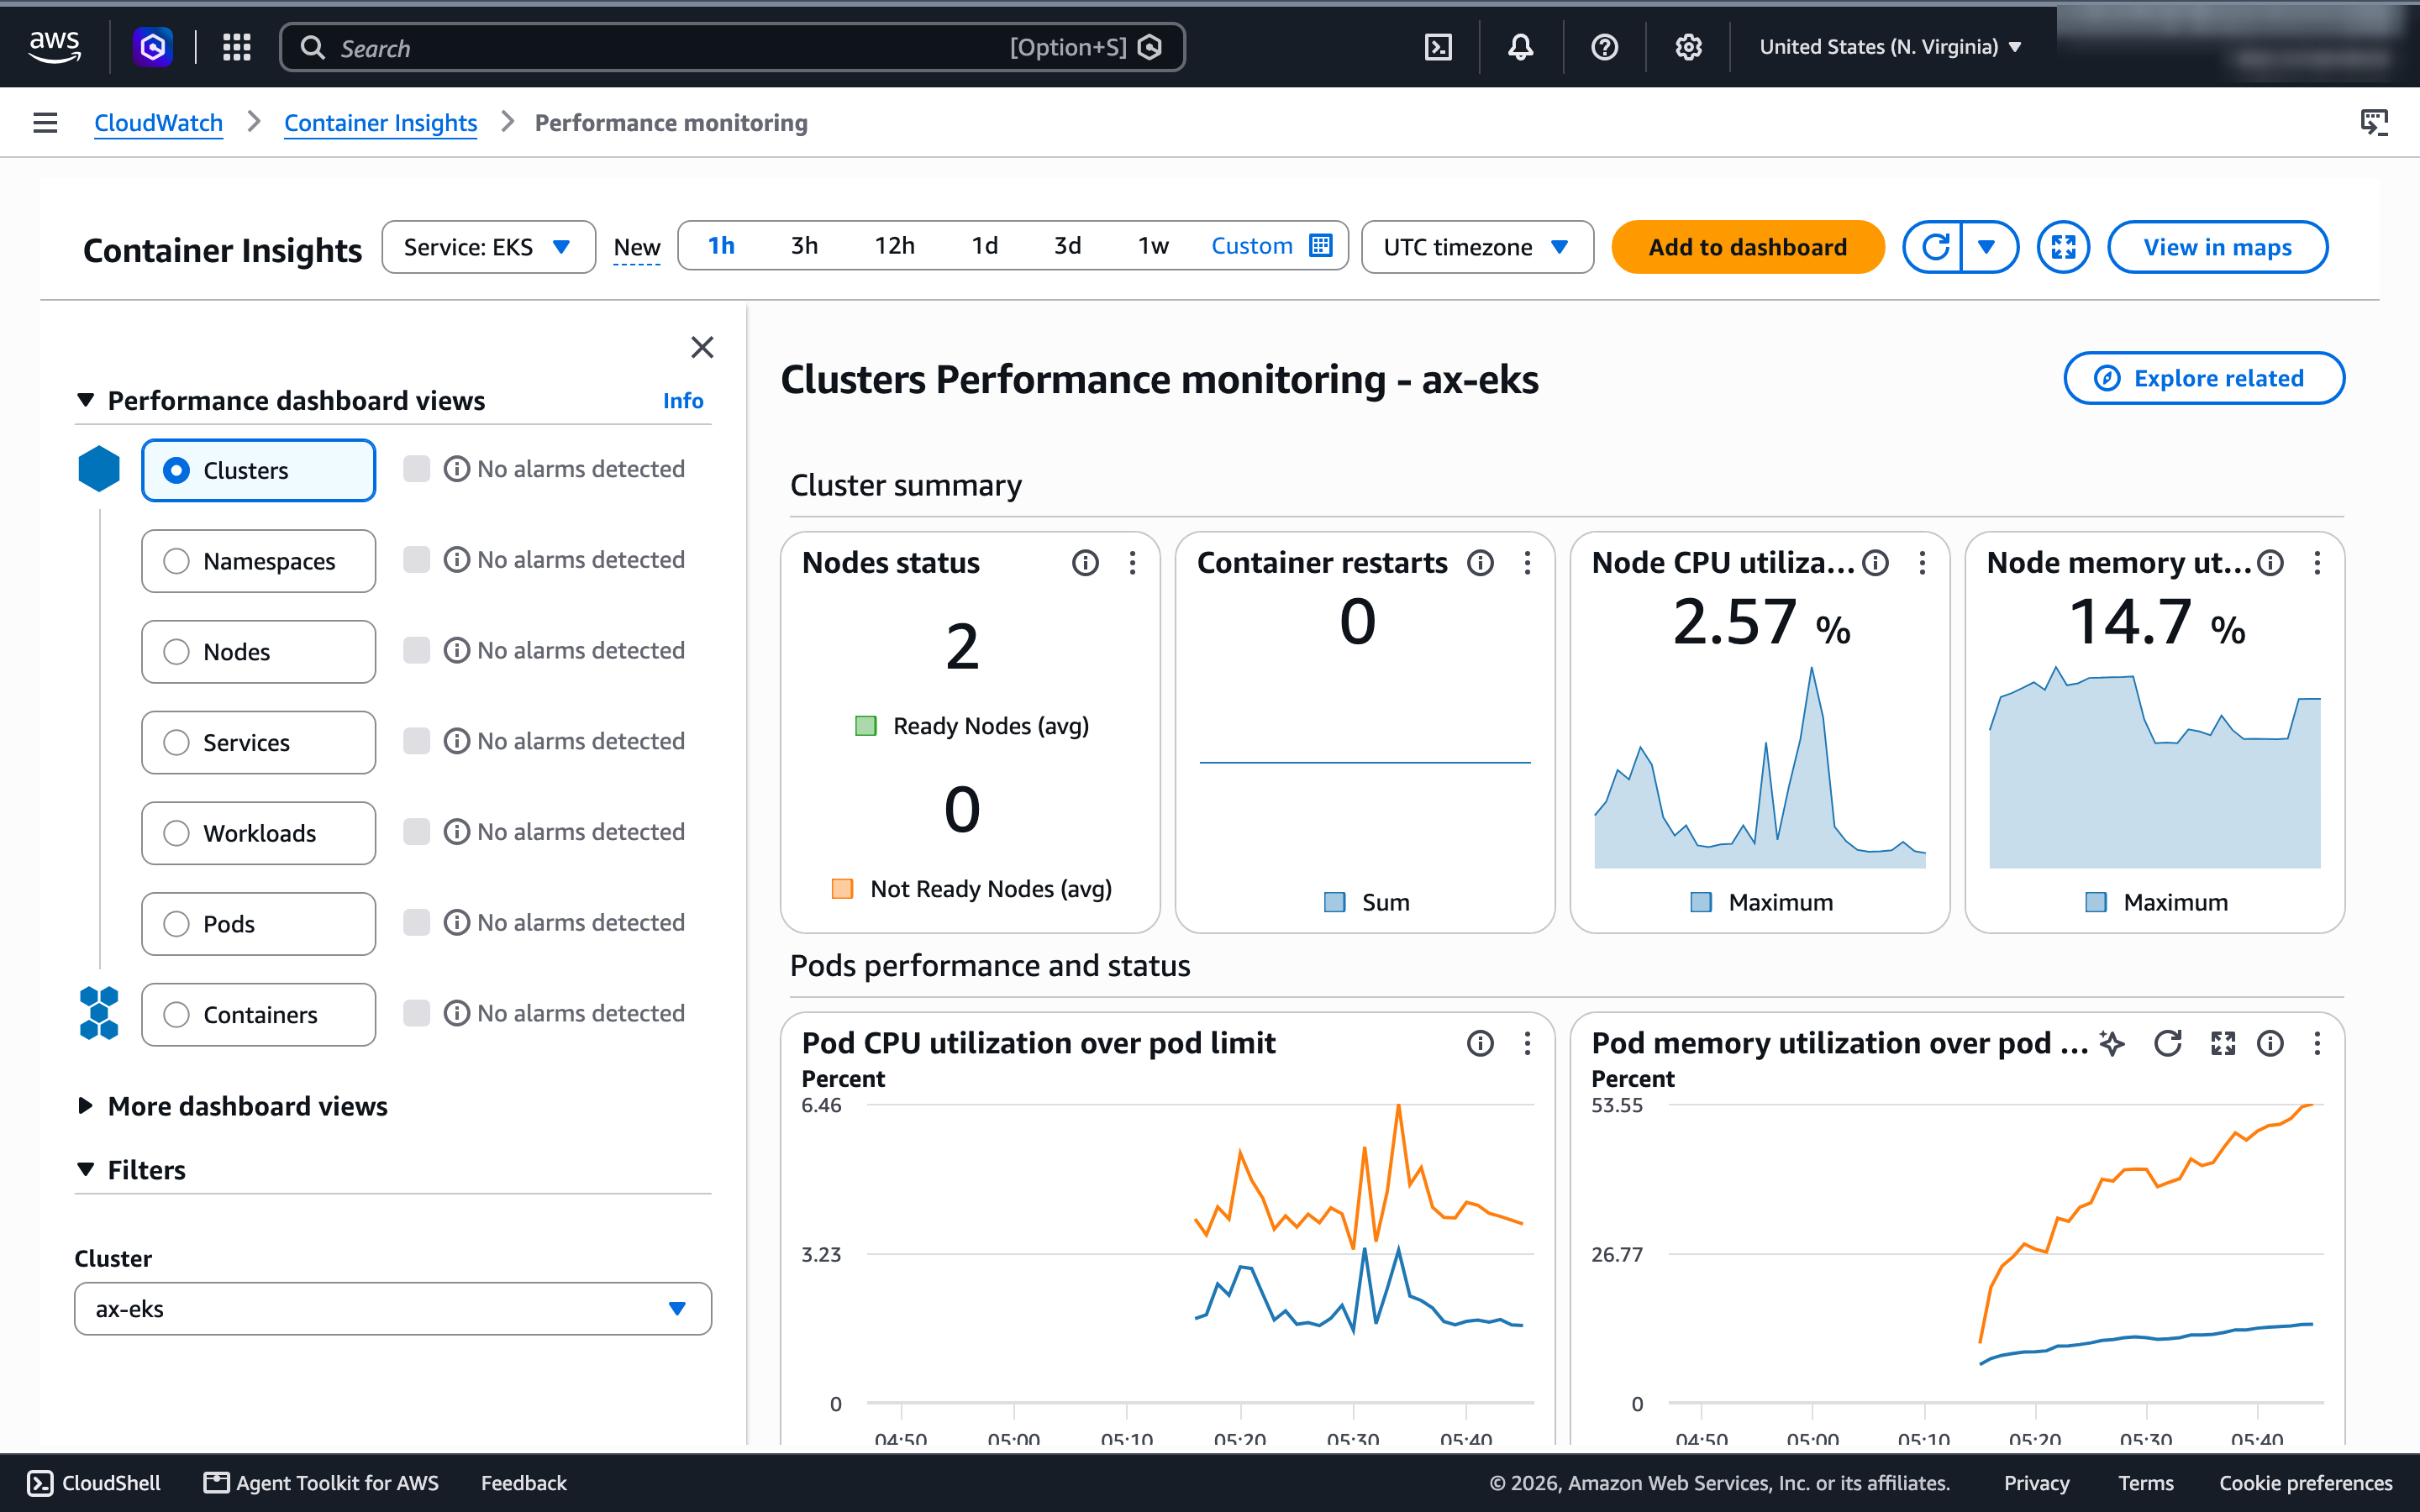
The window starts a few minutes before the clean re-runs, while the leftover tasks from my first attempt were still being deleted, which is the early memory plateau. Across it, the nodes never passed about a third of their CPU on one-minute averages, and memory stayed under 17%. Container Insights confirms the picture from the kubelet samples, at a coarser grain: on two nodes, these workloads run out of booked CPU long before the machines run out of anything. Zero container restarts across all six tests.
Results summary
| Test | Result on 2 × m7i.xlarge |
|---|---|
| Density | 151 idle sandboxes at 50m; CPU bookings are the ceiling, memory ~13 MiB per idle sandbox |
| Latency, 1 → 40 in flight | No errors; resume p50 1.5 → 2.1 s, suspend p50 0.77 → 1.18 s, create ~0.7 s |
| Wake on request | 97 ms at 1 CPU, 291 ms at 250m, 2.2 s at 50m; 30 simultaneous: p99 1.7 s, no errors |
| Control plane | ≤ 0.3 core for ate-api-server at 20 calls in flight; never the bottleneck |
| Noisy neighbors | CPU hogs +74% on victims’ CPU work; disk hogs 6x the write p95 |
| Snapshot storm | 20 suspends in ~1 s; all 20 durable after 5.4 min; 2.1 GB through the NAT gateway |
Pricing
The cluster costs about $0.63 an hour whether or not it’s under load (see part 1). What the stress test added:
| Item | Rate | This test |
|---|---|---|
| Container Insights (enhanced observability) | per metric observation | about an hour; roughly $2.65/day if left on, estimated from AWS’s pricing example |
| NAT gateway data processing | $0.045/GB | ~2.1 GB of snapshots: about $0.10 |
| S3 storage and requests | standard rates | cents |
Cleanup
10_cleanup.py deletes every task in the stress atespace, turns Container Insights off and deletes its log groups, which outlive the add-on:
== tasks in atespace 'stress'
  remaining: 0
== terraform apply -var container_insights=false
  Apply complete! Resources: 0 added, 0 changed, 3 destroyed.
To stop paying for the nodes without tearing everything down, scale the node group to zero. The EKS module ignores later changes to a node group’s desired size, so it’s a CLI call:
aws eks update-nodegroup-config --cluster-name ax-eks \
  --nodegroup-name "$(aws eks list-nodegroups --cluster-name ax-eks --query 'nodegroups[0]' --output text)" \
  --scaling-config minSize=0,maxSize=1,desiredSize=0
The control plane, NAT gateway and EBS volumes still bill, about $5 a day. Part 1’s 99_teardown.sh removes everything, including the PostgreSQL volumes that terraform destroy leaves behind.
Verdict
On two four-core nodes, AX and Agent Substrate held up well. Nothing crashed, no container restarted, latency degraded gently up to 40 calls in flight, 30 simultaneous wakes all succeeded, and the control plane used a fraction of a core while doing it. The limits I hit were bookings, not breakage: Substrate refused cleanly with no worker has room when CPU ran out.
The numbers that matter for sizing an AX fleet:
- Density is a CPU-limit decision. 6 tasks at AX’s default 1 CPU, 30 at 250m, 151 at 50m on the same two nodes. Memory was never close to a limit for idle agents.
- Wake time is the other side of that decision. 97 ms at 1 CPU, 2.2 s at 50m. Pick per-task limits for the wake time you need, not just the count you want to fit.
- CPU limits don’t isolate. Busy neighbors slowed capped tasks by 74%. If latency matters, keep CPU-heavy and latency-sensitive agents on different worker pools or nodes.
- Watch the snapshot path. Uploads wait five minutes, then go out together, through the NAT gateway unless you add a free S3 endpoint.
- Mind the tooling’s edges.
ax get taskssilently stops at 50 tasks, which is easy to miss in scripts that clean up by listing.
Google’s headline figures sit inside what I measured only with qualifiers it doesn’t state: sub-500 ms for a single wake at 250m and up, not at small CPU limits and not for bursts; activations per second set by sandbox boots on a cluster this size, not by the API. On my two nodes, the honest summary is dense for idle, fast for awake, and plan for neighbors.