OpenShell on Amazon EKS: Stress Testing
By Fabio Douek
Jump to section
- Overview
- Architecture
- Setup
- Step 1: Container Insights, metrics only
- Step 2: A sampler
- Step 3: Every test from zero
- Testing
- Test 1: Density until something refuses
- Test 2: Create latency under concurrency
- Test 3: Policy propagation
- Test 4: What each policy layer costs
- Test 5: The gateway under API load
- Test 6: Noisy neighbours
- What CloudWatch Saw
- Results Summary
- Pricing
- Cleanup
- Verdict
Explain (TLDR) like I am...
I tried to squeeze as many robot rooms as possible into two big houses. The houses had plenty of space and power left over, but they ran out of door numbers and parking spots first, so 46 rooms fit one way and 61 another. Next time, I'd count the door numbers first.
The rooms worked fine even when I built 40 at once. But when one robot banged on the shared floor, everyone next door slowed down, and every time I changed the house rules, all the robots on the phone got hung up on.
This post records load tests of OpenShell 0.1.6 on two Amazon EKS nodes. Capacity was bounded by Kubernetes limits on Pods and attached volumes per node, not by compute; no sandbox creation failed or hung under concurrency up to 40, once the shared supervisor pool was accepting sandboxes.
Operational risks to document: every policy change interrupts all open connections in affected sandboxes; sandboxes have no resource limits by default, so one tenant can degrade another; and a trial run observed a deletion that left billable storage behind.
I loaded two nodes until OpenShell refused new sandboxes: 46 with the default design, 61 with the shared supervisor. Vital signs stayed calm throughout, with memory and CPU mostly idle; the limit was the number of Pods and volume attachments each node allows.
Side effects under stress: policy changes sever every open connection, disk-heavy neighbours slow shared disk writes about thirty-sixfold, and CPU limits help only with CPU. Prescribe limits per sandbox and batch policy changes.
Load tests are where a system shows its temperament. This one stayed composed: creating forty sandboxes at once slowed things down but broke nothing, and the control plane answered about two thousand requests a second without a single error.
The tension shows up between neighbours. With no limits, one busy sandbox takes from everyone nearby, and a single policy edit interrupts every conversation in progress in that sandbox. Agreeing on limits and change windows keeps a shared cluster a calm place.
Think of two stages that could host plenty of players, until the venue runs out of dressing rooms and parking spaces. That's the real ceiling here: 46 acts the standard way, 61 with a shared crew.
The band held tempo even when forty acts arrived at once. The trouble is acoustic: one loud drummer bleeds into every neighbouring mic, and each time the setlist changes, every song in progress stops mid-bar. The fix is old stagecraft: give each drummer a booth, and change the setlist between songs.
The capacity story is concrete: two modest nodes hosted 46 isolated agent sandboxes as shipped and 61 with the shared supervisor, with most of their CPU and memory still free. Once set up correctly, creation never failed under load, and the control plane handled about 2,000 requests a second.
The positioning for buyers: plan capacity in Pods and volumes, not cores; set limits per sandbox; and treat policy changes as events that reset connections. With that, the platform scales predictably.
 See the source code here: openshell-stress
Overview
OpenShell, a CNCF Sandbox project since 2026-09-26, has been the subject of five posts in this series: the architecture, an install on Amazon EKS, a sandbox’s lifecycle, policy and egress and AWS credentials. This last part, 6 of 6, asks how much the same two-node cluster can take.
I found no independent OpenShell numbers for ordinary Kubernetes nodes to check against. The figures NVIDIA cites are hardware claims for its own platforms, which this series doesn’t test. So this post measures rather than checks: six tests on two m7i.2xlarge nodes, with nothing added to the cluster except Container Insights, each test starting from zero sandboxes and deleting what it made.
The short version: on these nodes, OpenShell runs out of Kubernetes before it runs out of machine. 46 sandboxes with a supervisor Pod each, 61 with the shared supervisor pool, and both stopped by per-node limits (Pods, then EBS volume attachments) while CPU and memory sat mostly idle. Creates slow down with concurrency but don’t fail once the setup is right, the gateway handles about 2,000 API calls a second, the policy layers add a couple of milliseconds per new connection, and the things that hurt are a policy edit (it cuts every open connection) and a neighbour hammering the node’s disk.
Architecture
Two ways of watching, on purpose. sampler.py reads each node’s kubelet summary API every 2 seconds and writes CPU, memory, Pod counts, attached EBS volumes and the gateway’s own usage to CSV, next to the tests’ own results. Container Insights (metrics only) runs alongside, to see how the same tests look from CloudWatch, which is where most teams would watch them.
Setup
The cluster is part 2’s, unchanged: two m7i.2xlarge nodes (8 vCPUs, 32 GiB) in two availability zones, EKS 1.37, the VPC CNI with network policy enforcement, OpenShell 0.1.6 with one gateway replica on SQLite. Sandboxes run on runc. Part 4’s echo server is the in-cluster destination for the network tests.
Step 1: Container Insights, metrics only
00_container_insights.sh on flips a variable in part 2’s Terraform that adds the Amazon CloudWatch Observability add-on with its agent’s IAM role. The plan added three resources and changed nothing else; the add-on runs one cloudwatch-agent Pod per node, which counts against the Pod limit that turns out to matter in Test 1. It collects metrics only, with no container log shipping (Container Insights stores the metrics themselves as performance log events in CloudWatch Logs).
Step 2: A sampler
sampler.py reads each node’s kubelet summary API (/api/v1/nodes/<node>/proxy/stats/summary) every 2 seconds and writes one CSV row per node: CPU, memory, Pod counts, unscheduled Pods, attached EBS volumes, NetworkPolicies, and the gateway Pod’s own CPU, memory and SQLite volume. Most tests start it in the background; charts.py draws this post’s charts from the tests’ result files.
Step 3: Every test from zero
Each test checks that no other sandboxes exist, creates only sandboxes named p6-*, and deletes everything it made, including anything the gateway forgets (more on that below). Tests that change the gateway’s configuration (the shared supervisor pool, push delivery) apply a Helm overlay and roll the release back to the exact previous revision at the end, also on Ctrl-C, and check that the rendered gateway.toml is what it was.
uv sync
./00_container_insights.sh on
uv run python 01_density.py --variant dedicated
uv run python 02_create_latency.py --topology dedicated
# ... see the README for the full run order
Testing
Test 1: Density until something refuses
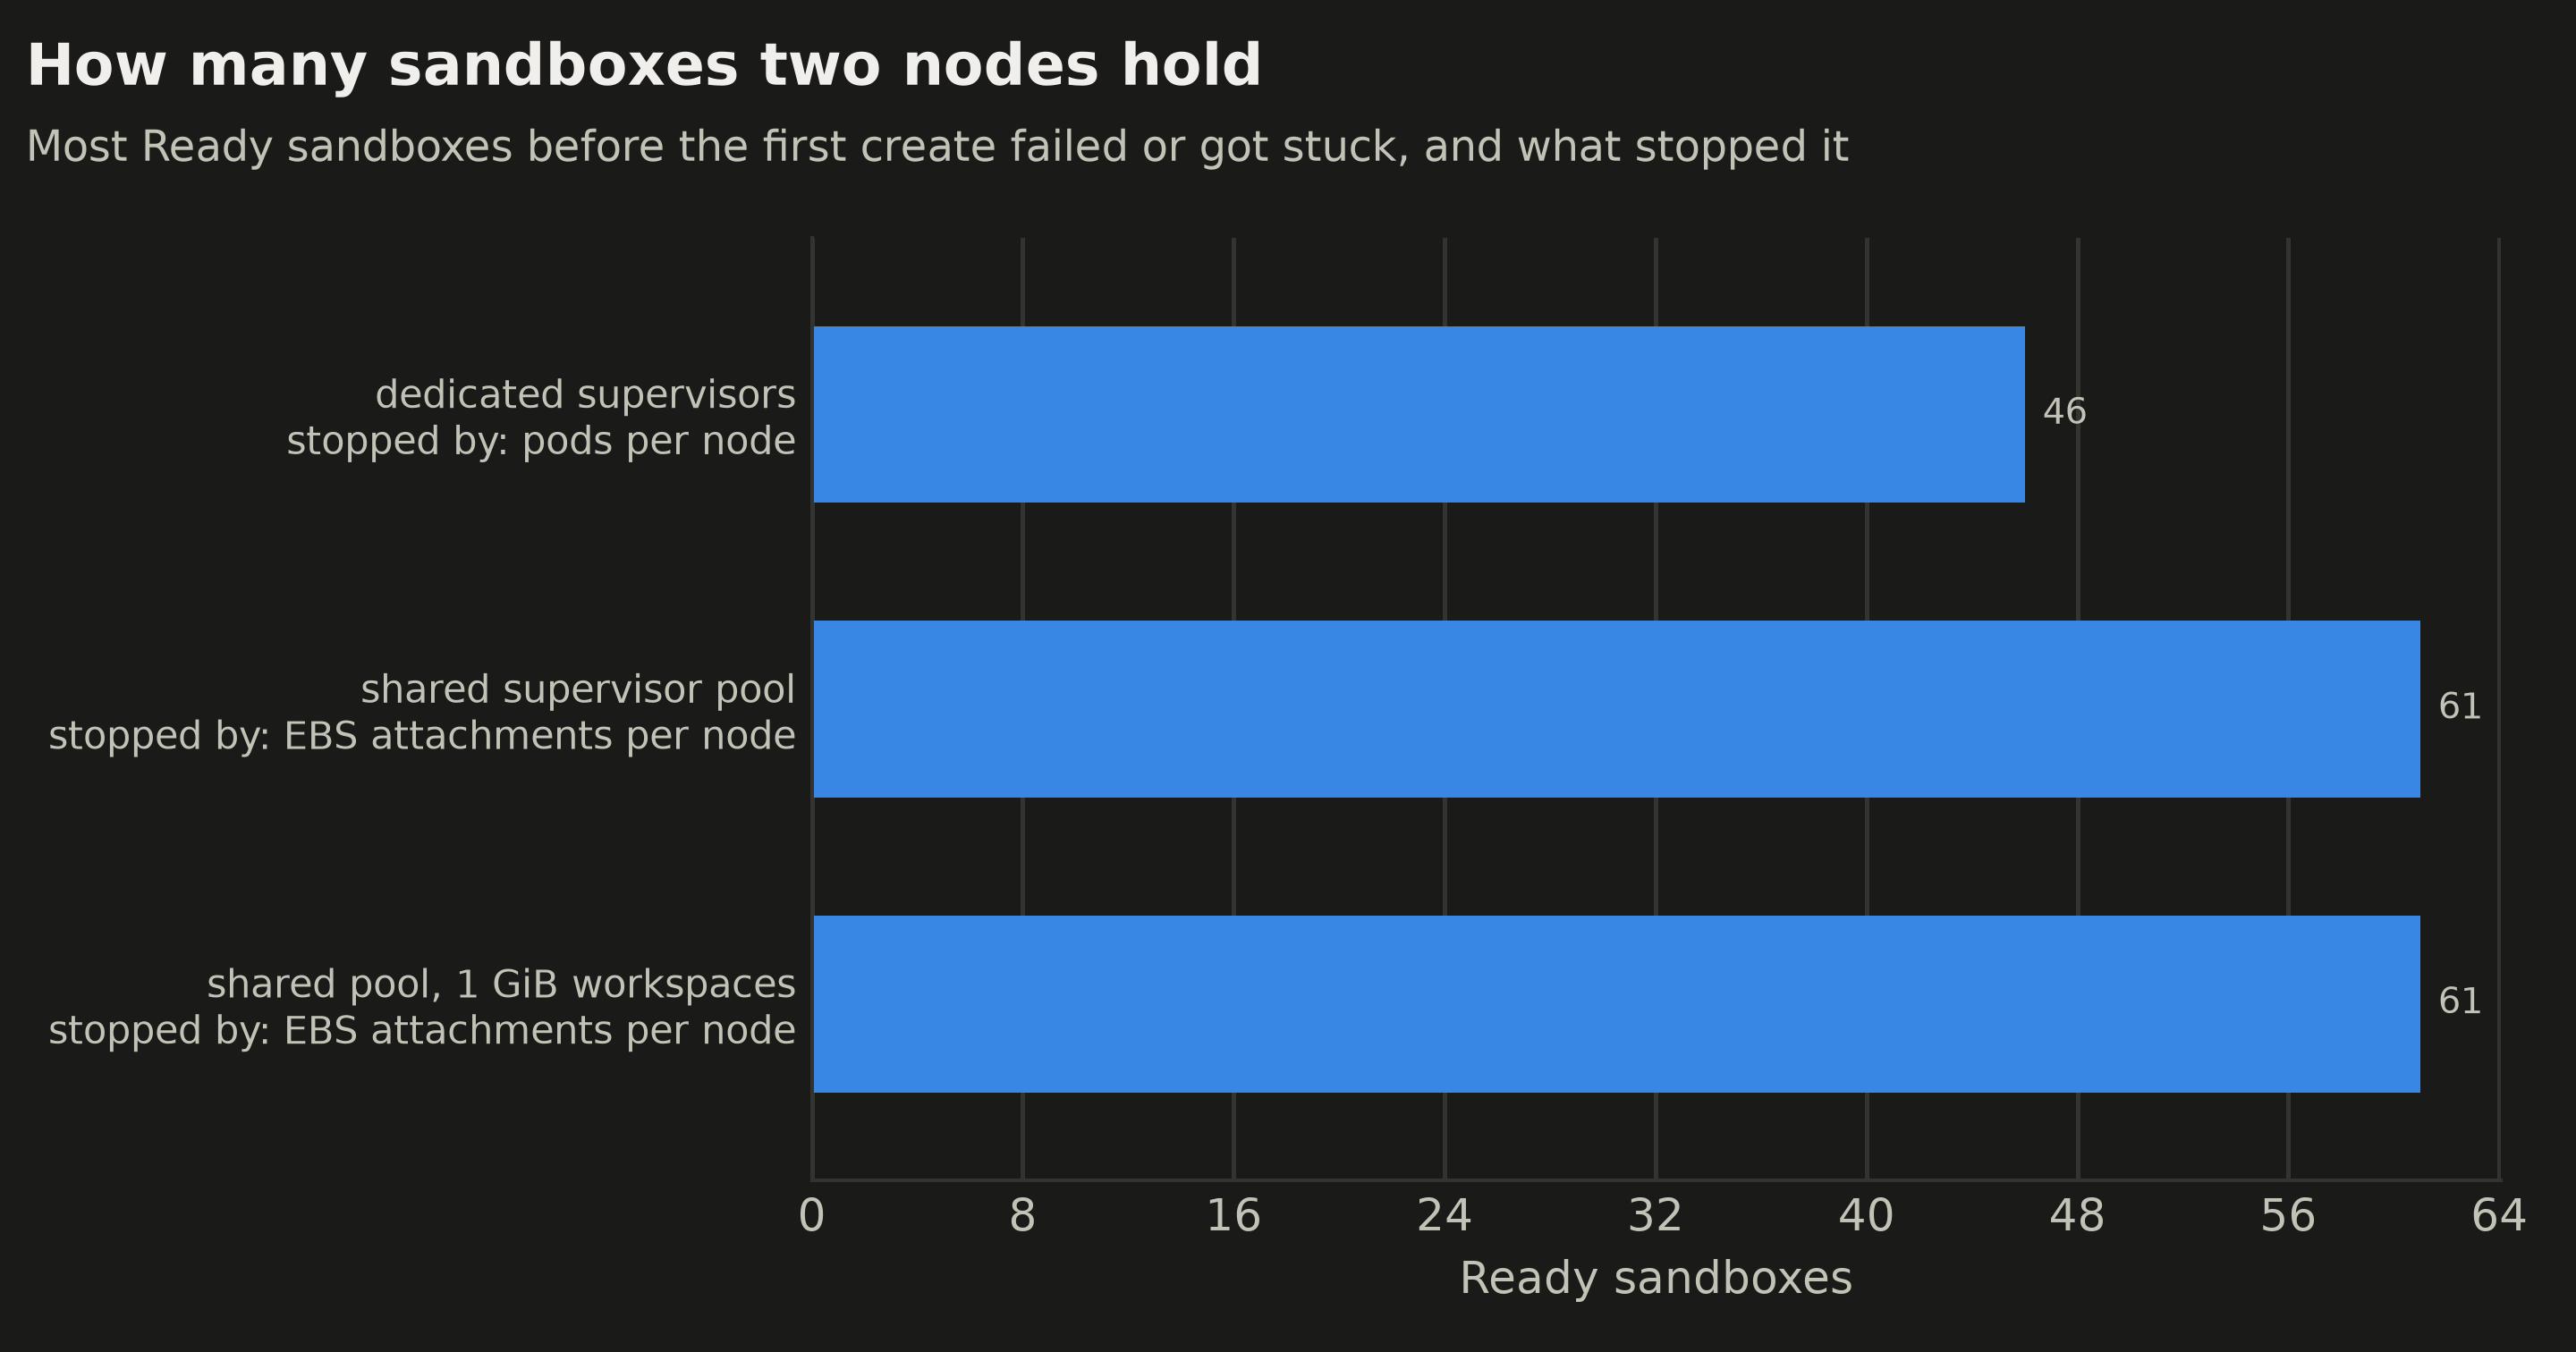
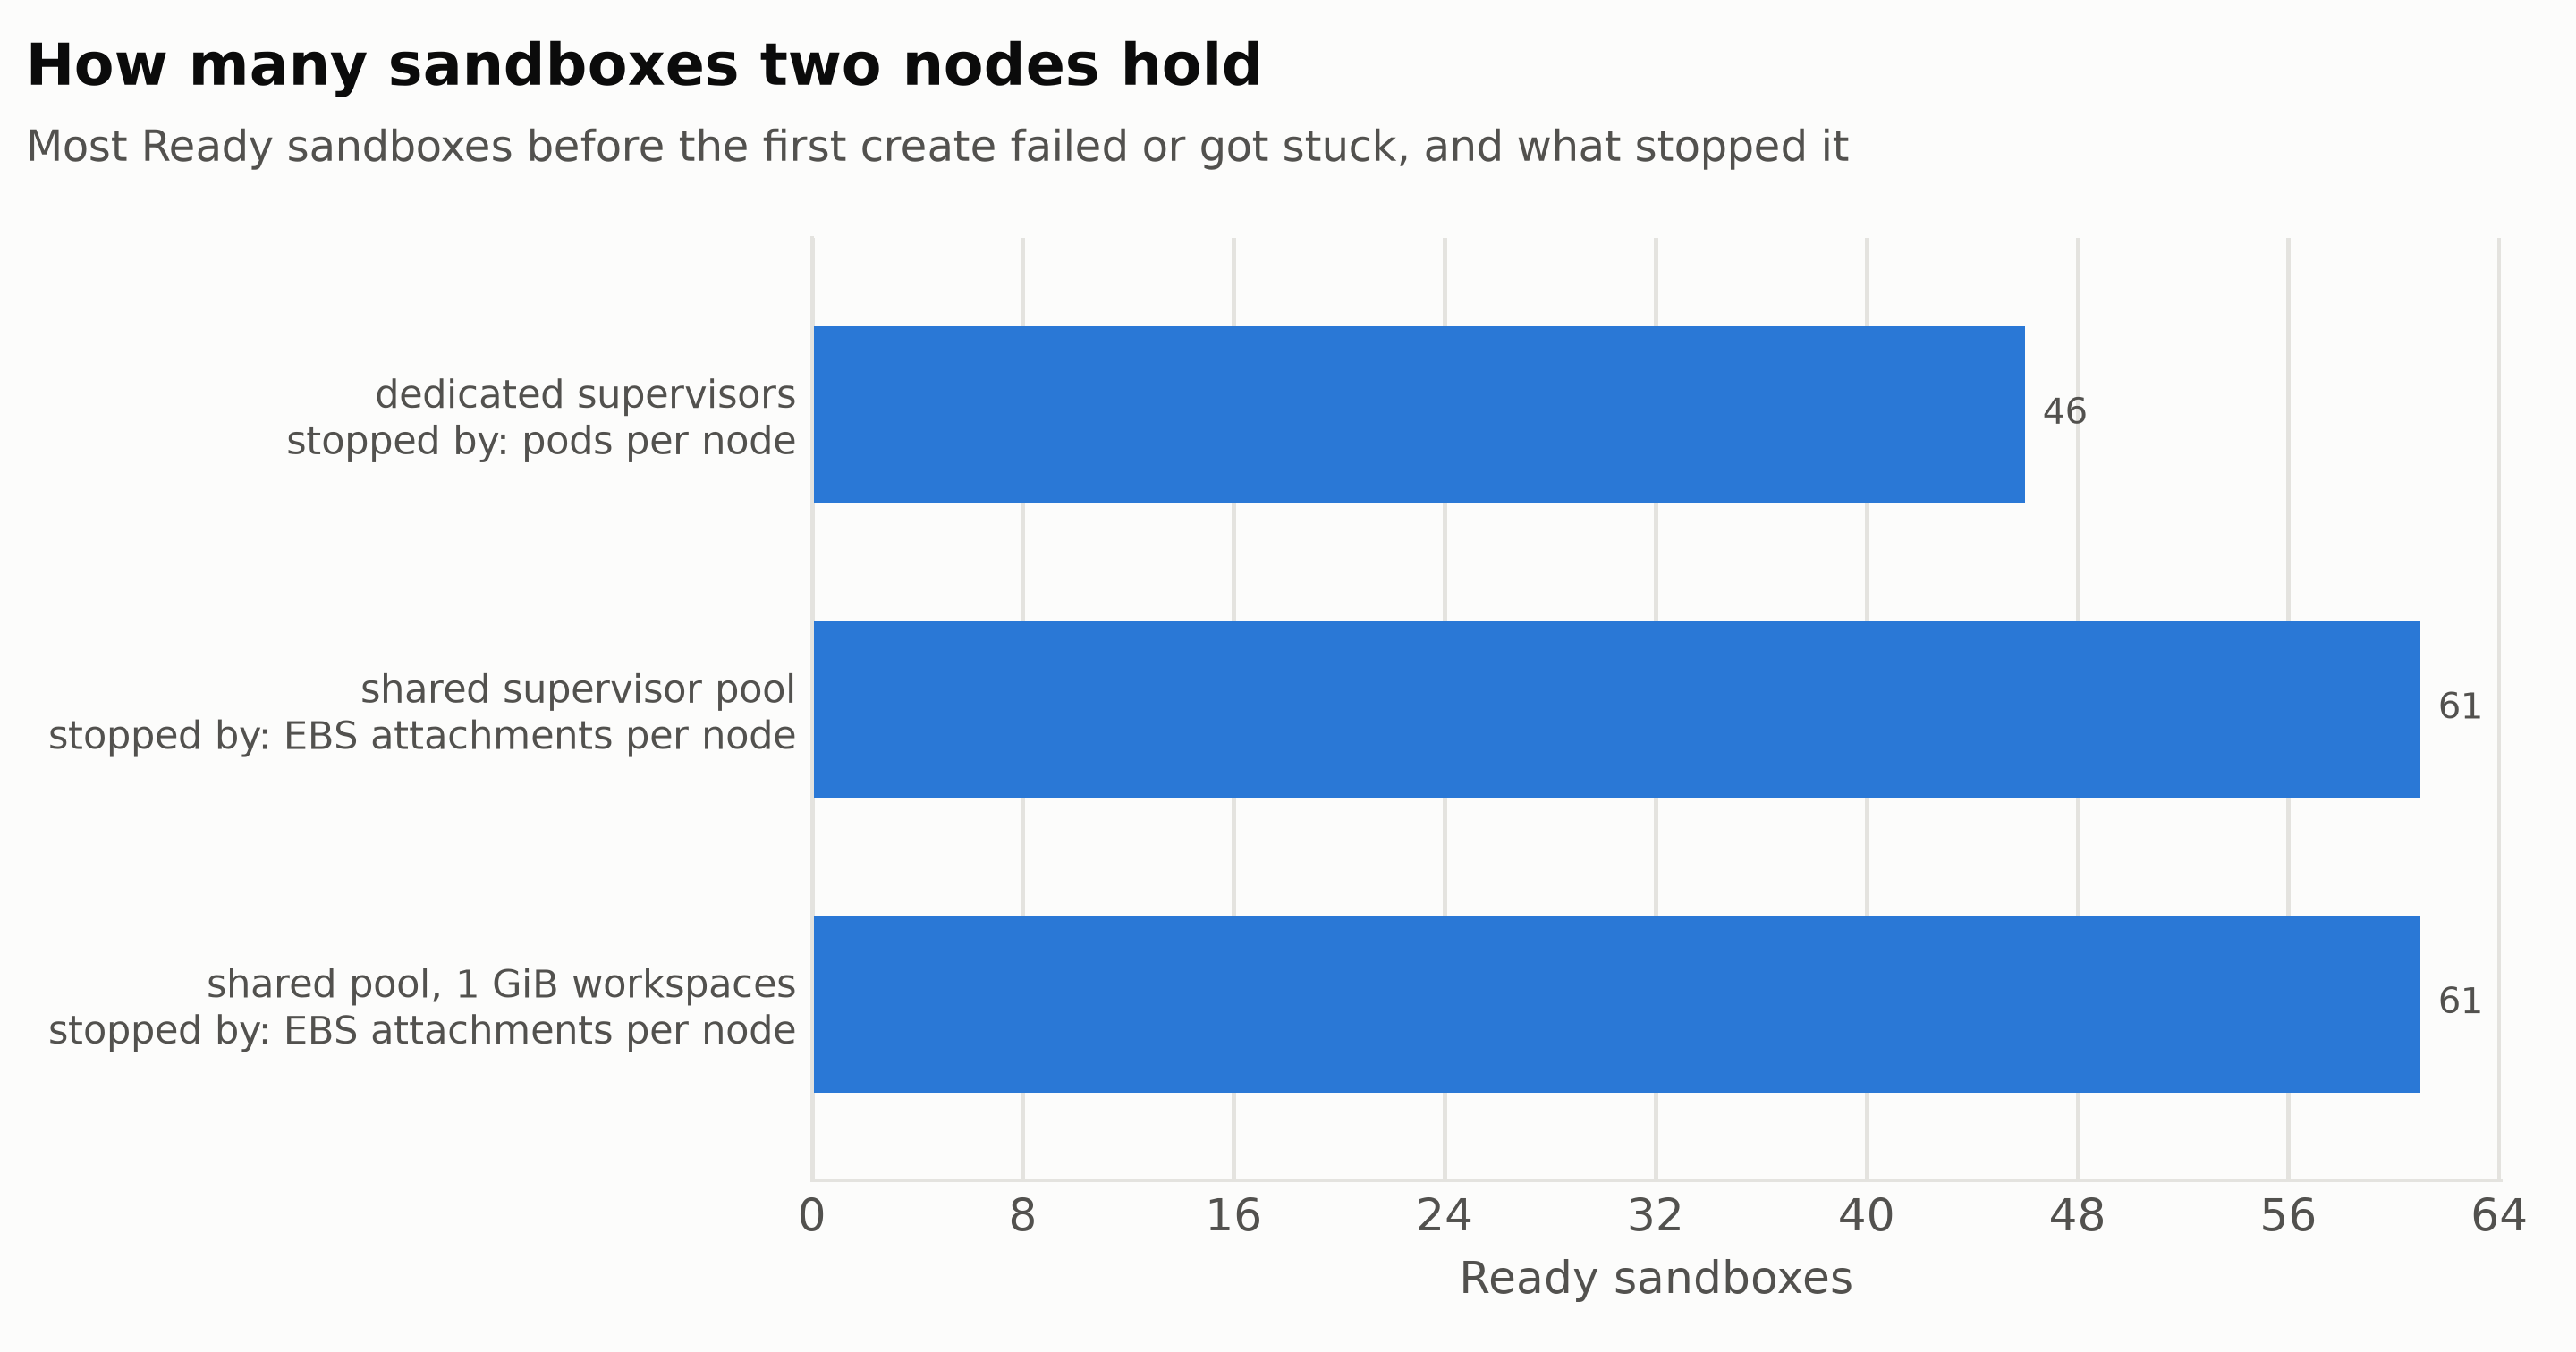
01_density.py creates sandboxes in batches of 10, waits for each to be Ready, and stops at the first sandbox that isn’t Ready within 240 seconds. Then it reads the stuck sandboxes’ Pods, volumes and events to name the cause. Three variants: the default (a supervisor Pod per sandbox), the experimental shared supervisor pool (supervisor_topology = "gateway": one supervisor Deployment, one Pod per member, serving every sandbox), and the pool with 1 GiB workspace volumes instead of 2 GiB.
| Variant | Ready | What stopped it | create→Ready per batch (p50) |
|---|---|---|---|
| Dedicated supervisors | 46 | Pods per node: 58 on each node, “Too many pods” | 14.0 to 17.7 s |
| Shared supervisor pool | 61 | EBS attachments: 31 per node (CSINode) | 9.8 to 15.0 s |
| Shared pool, 1 GiB workspaces | 61 | EBS attachments | 8.7 to 16.3 s |
With a supervisor Pod per sandbox, each sandbox costs two Pods, and an m7i.2xlarge on the VPC CNI allows 58 Pods. The nodes already ran 22 between them (system Pods, the gateway, the CloudWatch agent), so once both nodes held 58 Pods, four sandboxes of the fifth batch couldn’t get all their Pods scheduled (“0/2 nodes are available: 2 Too many pods”); two of their supervisor Pods took the last free slots, which is why the count is 46 and not 47. The shared pool halves the Pods, and the next limit is the EBS volume each sandbox’s workspace needs: 31 attachments per node (the instance’s EBS attachment limit after the root volume, as the node’s CSINode object reports), one of them already used by the gateway’s own volume. Smaller volumes don’t help, since the limit counts volumes, not gigabytes.
CPU and memory weren’t close to a limit. At 46 sandboxes, each node used under 2.8 GiB of its 32 GiB and under 0.9 of its 8 cores; the sandbox Pods together took about 780 MiB per node, roughly 33 MiB per idle sandbox and supervisor pair. Two m7i.2xlarge nodes are sized for far more than 46 idle sandboxes; what they run out of is Pod slots and volume attachments. VPC CNI prefix delegation raises the Pod limit; the volume limit stays as long as each sandbox gets its own workspace volume, which is the default (driver config can mount a different volume at /sandbox, which I didn’t test).
The shared pool needed care. The first runs failed every create with “the shared supervisor has no capacity for another sandbox instance”, because the test started as soon as the pool’s Deployment was rolled out. The gateway only places sandboxes once the pool members have connected. The harness now creates a canary sandbox every 10 seconds until one is accepted; including the canary’s own create and delete, that step took 49 to 110 seconds.
Test 2: Create latency under concurrency
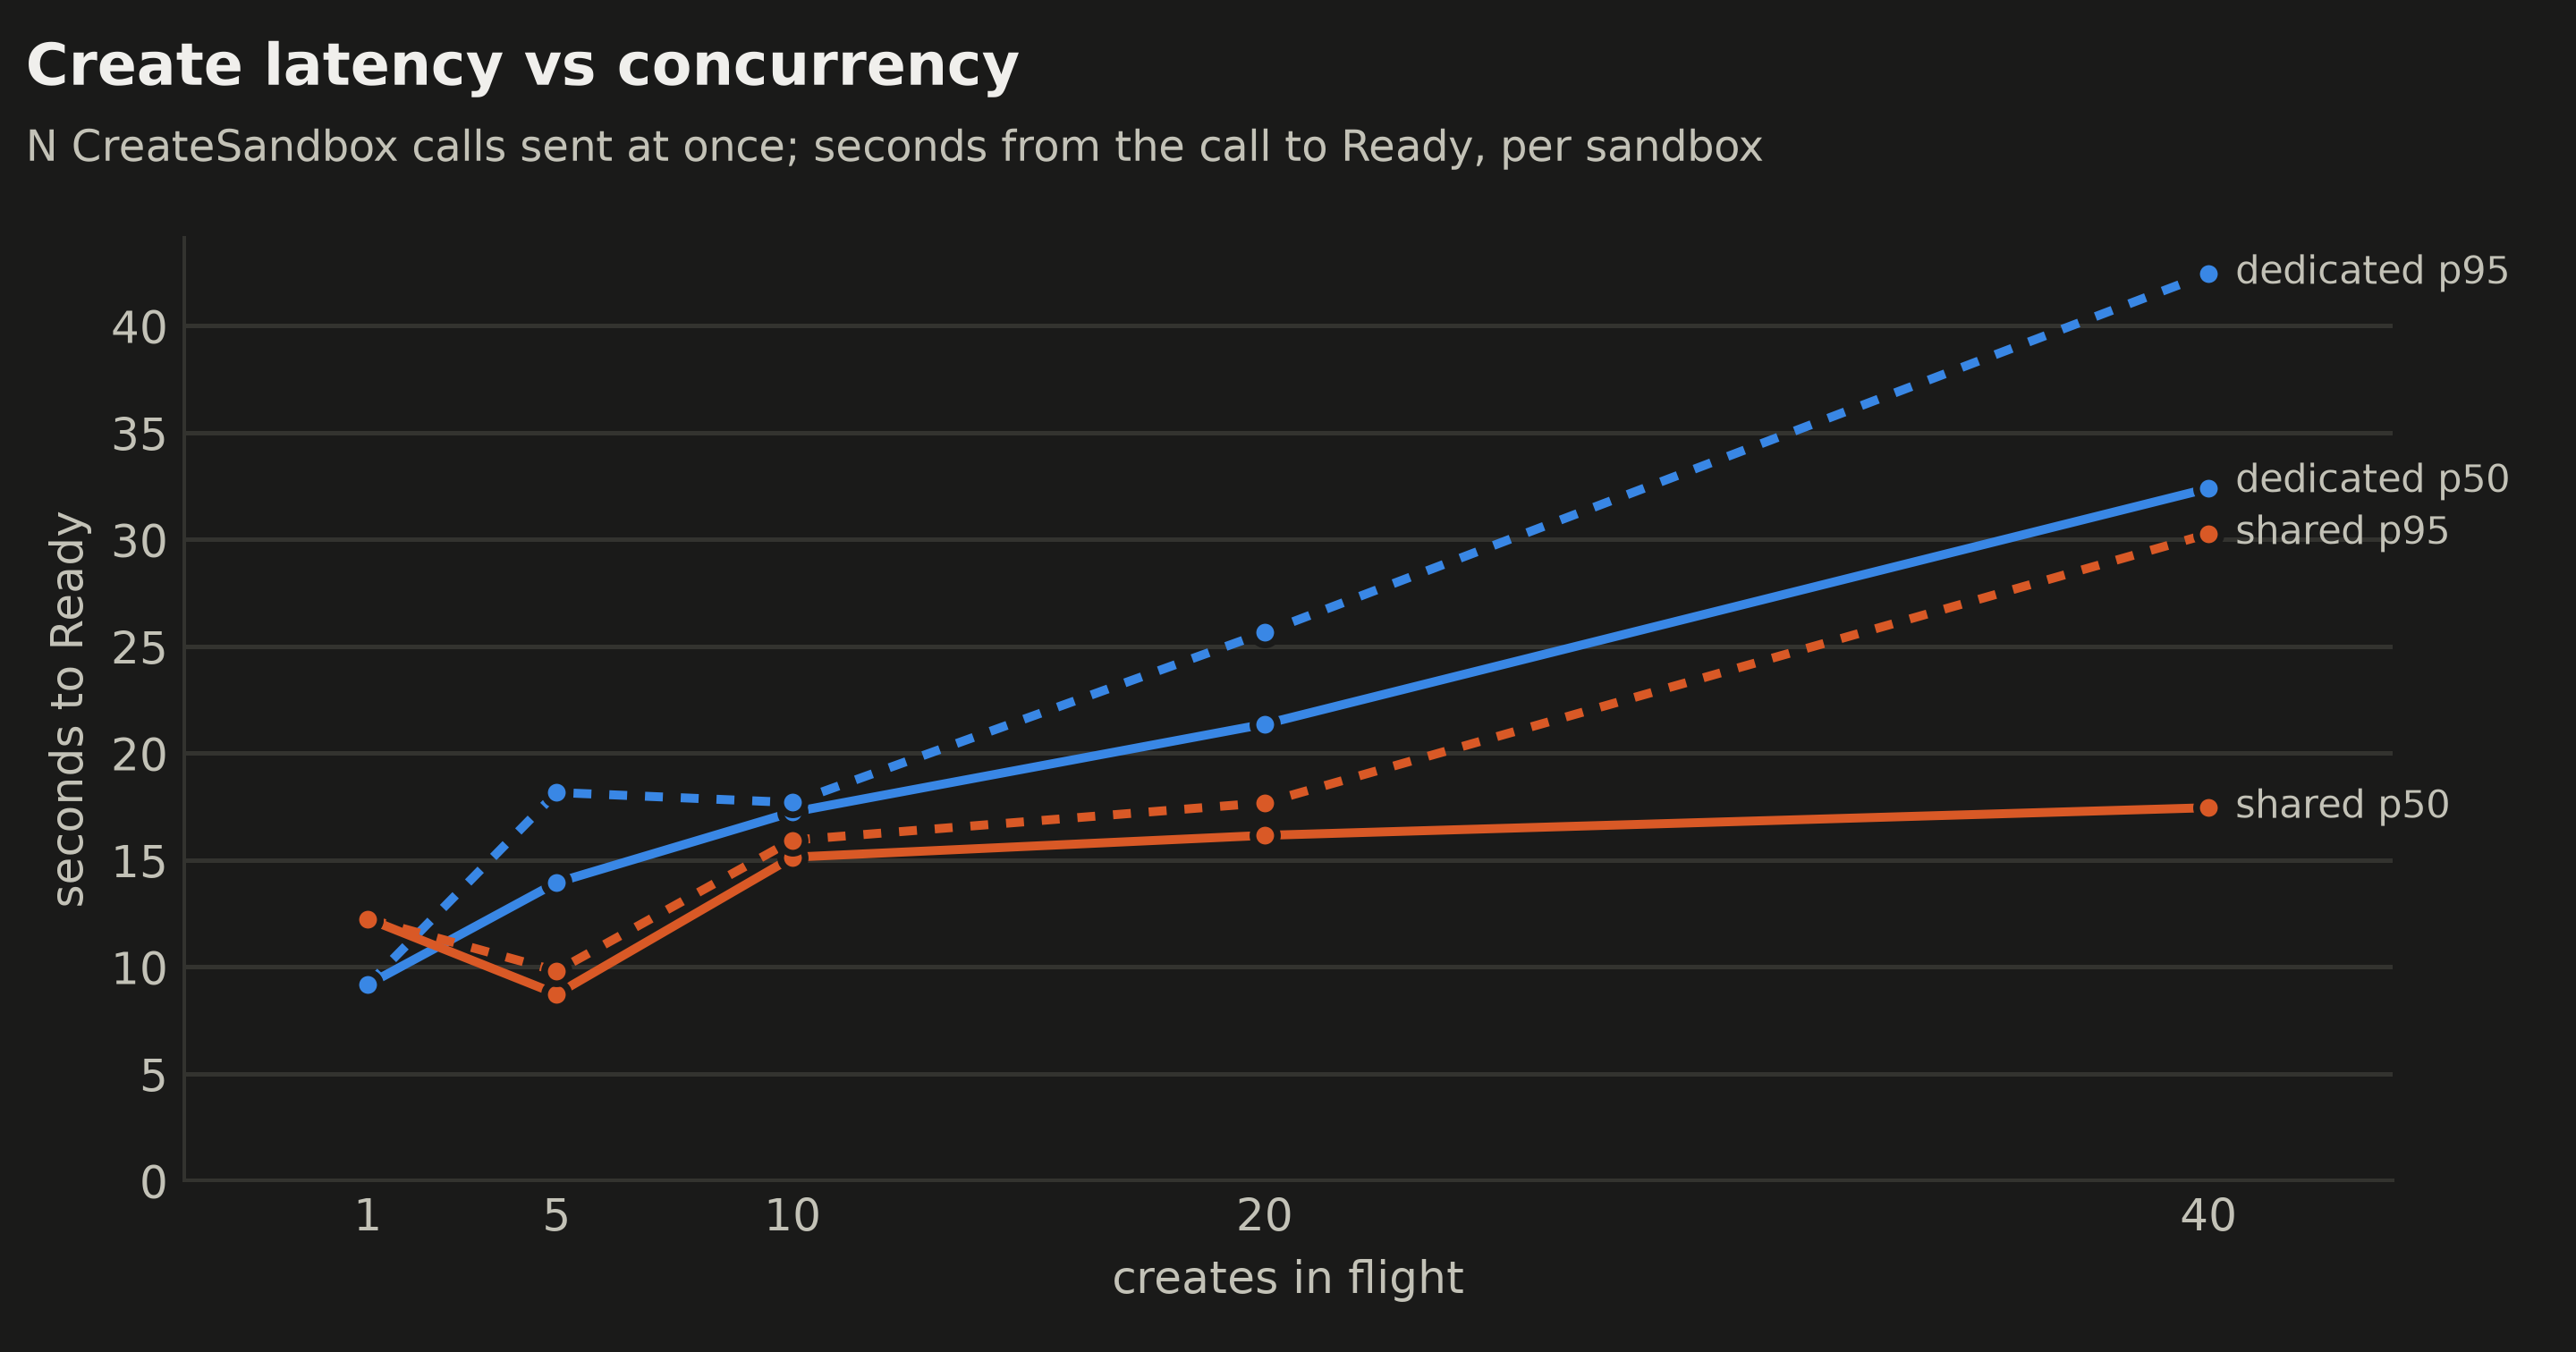
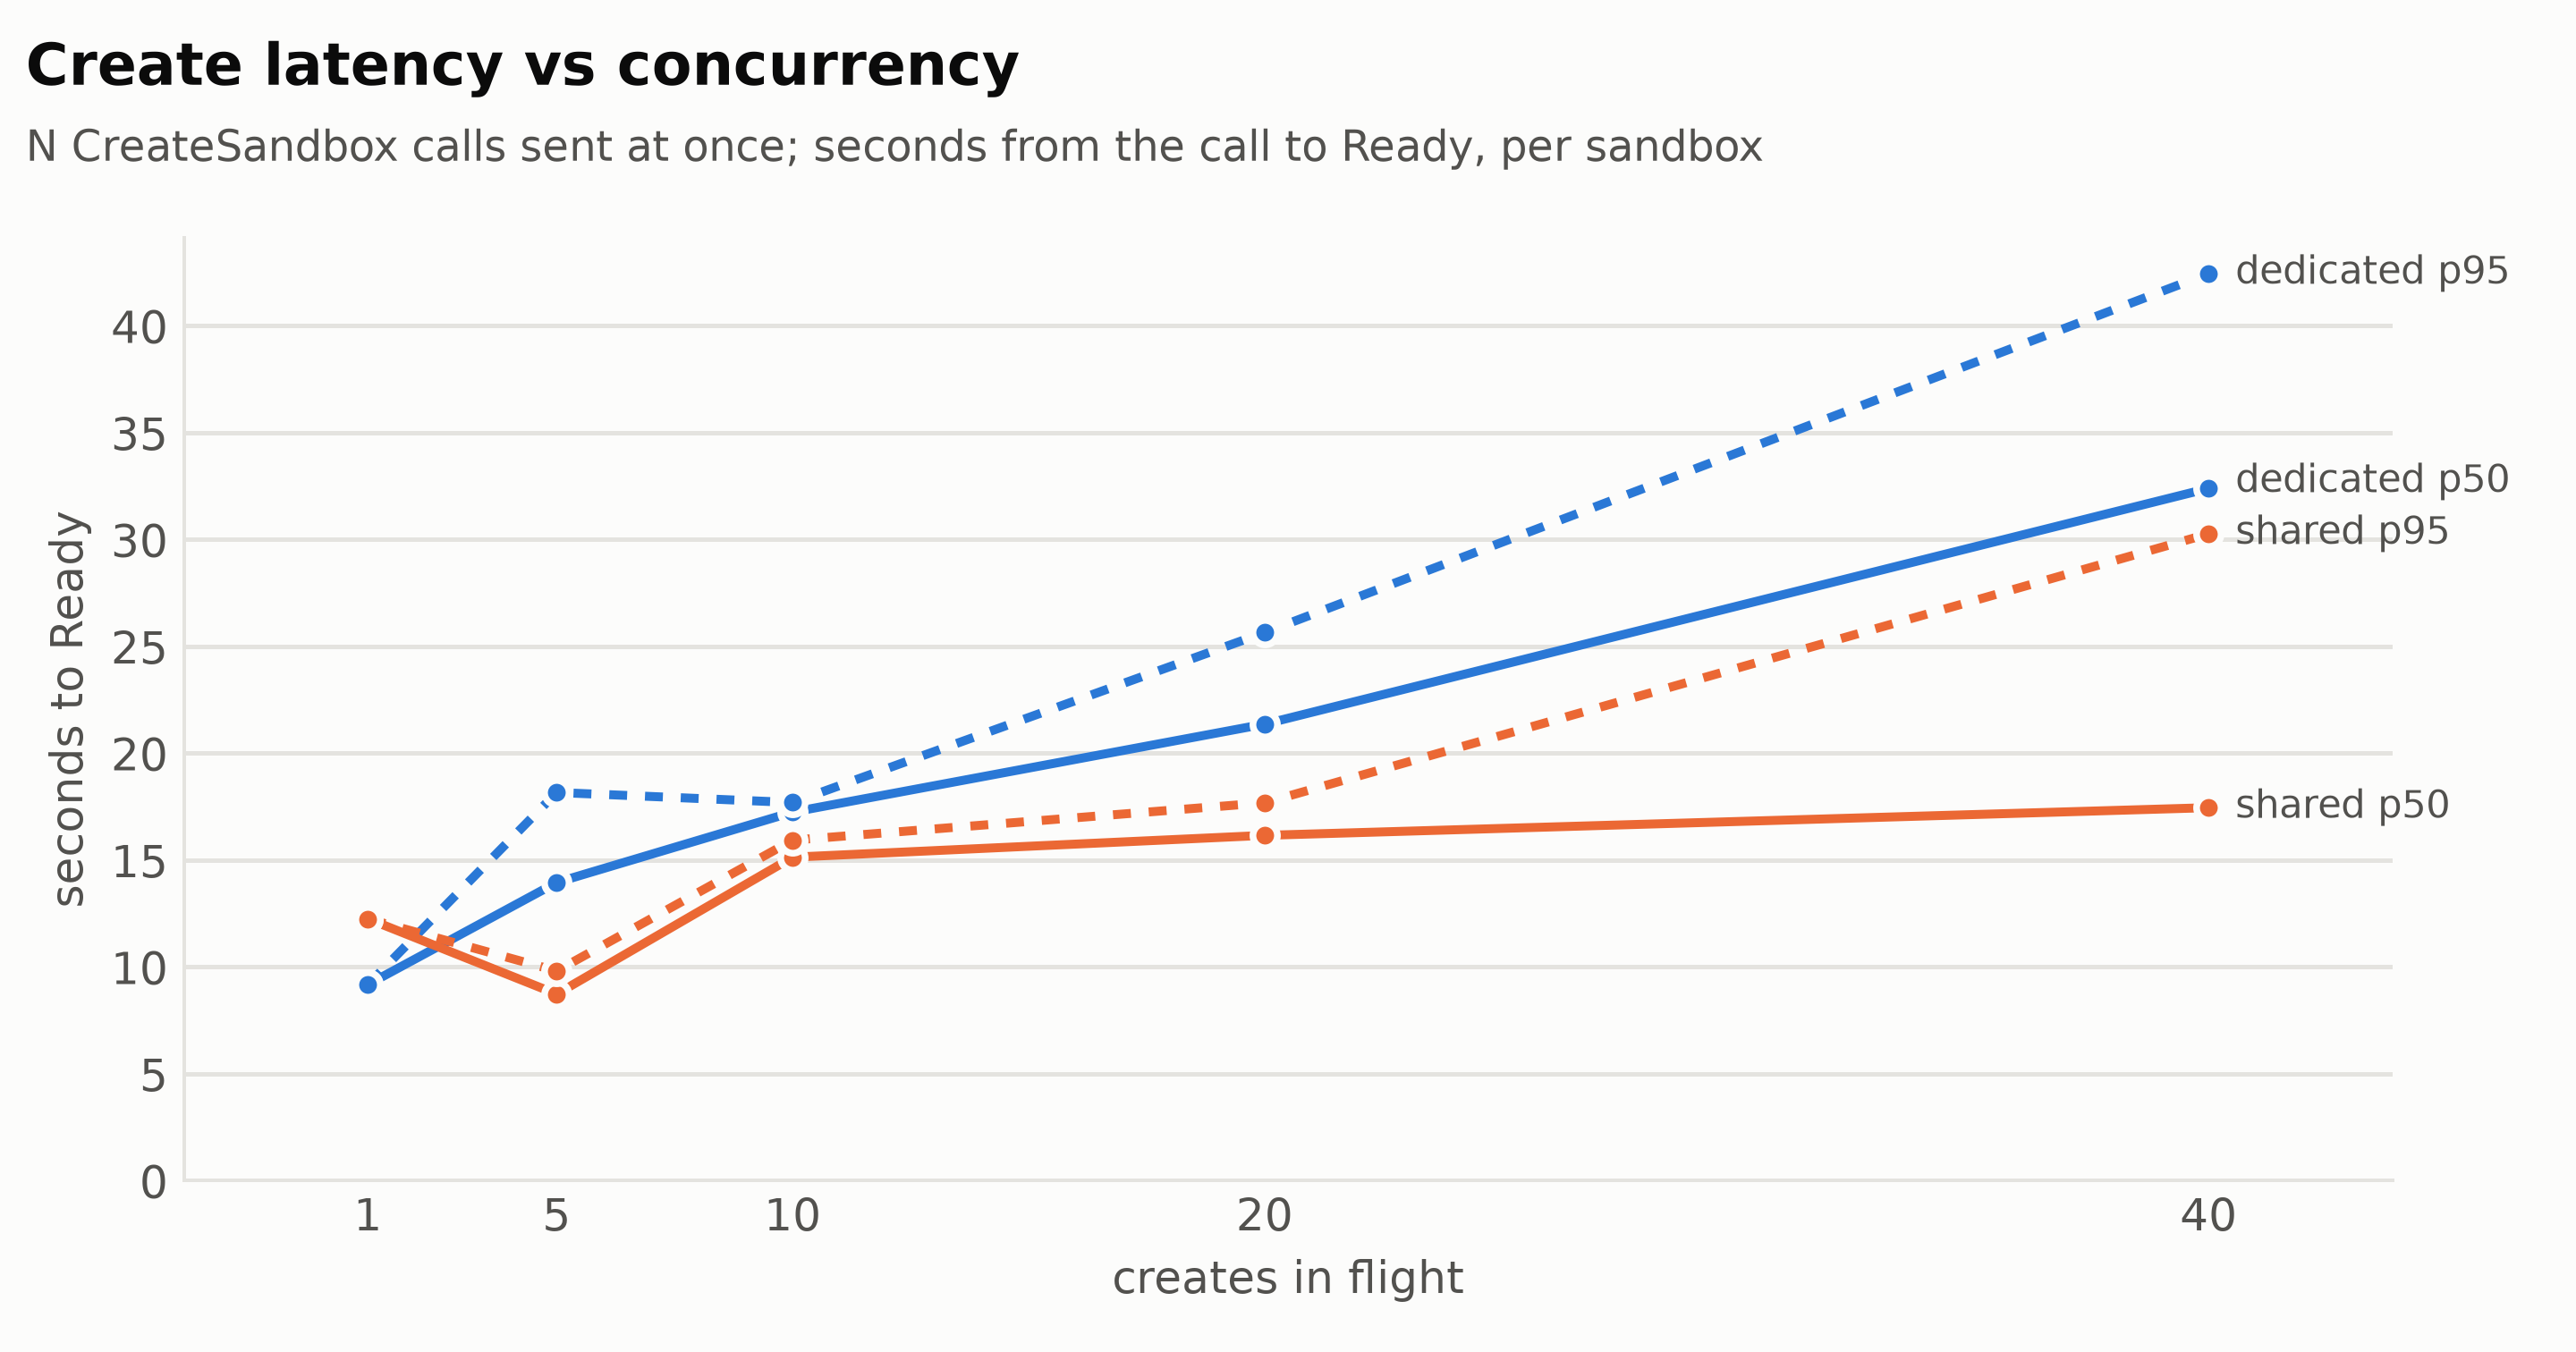
02_create_latency.py sends 1, 5, 10, 20 and 40 CreateSandbox calls at once and times each sandbox from the call to Ready.
| Creates at once | Dedicated p50 / p95 | Shared pool p50 / p95 | CreateSandbox call p50, dedicated / shared |
|---|---|---|---|
| 1 | 9.2 / 9.2 s | 12.3 / 12.3 s | 0.47 / 0.30 s |
| 5 | 14.0 / 18.2 s | 8.7 / 9.8 s | 1.91 / 0.43 s |
| 10 | 17.2 / 17.7 s | 15.1 / 15.9 s | 3.52 / 0.49 s |
| 20 | 21.4 / 25.7 s | 16.2 / 17.7 s | 4.31 / 0.70 s |
| 40 | 32.4 / 42.4 s | 17.5 / 30.3 s | 7.27 / 0.96 s |
Every sandbox reached Ready, none got stuck, and none of the creates failed (the shared-pool numbers are from runs after the pool accepted sandboxes). The gateway’s mutation lock wasn’t the bottleneck (mean wait under 2 ms at every level). What grows is the CreateSandbox call itself with dedicated supervisors, from half a second to over 7 seconds with 40 in flight, probably because each create also has to set up a supervisor Pod with its Secrets and Services. With the shared pool there’s no supervisor Pod to create, and the median for 40 at once (17.5 s) was close to the median for 10 (15.1 s), though the p95 doubled.
Deleting is the slow direction in both: about 31 seconds per sandbox, as in part 2, and 98 seconds (dedicated) or 94 seconds (shared) for 40 at a time, 16 in parallel. In one of the harness’s smoke runs, a delete sent about a second after a sandbox became Ready returned in 26 ms and the gateway forgot the sandbox, while its Kubernetes objects and its EBS volume stayed behind; the scripts now check for that and clean up through Kubernetes. I didn’t see it again in the recorded runs.
Test 3: Policy propagation
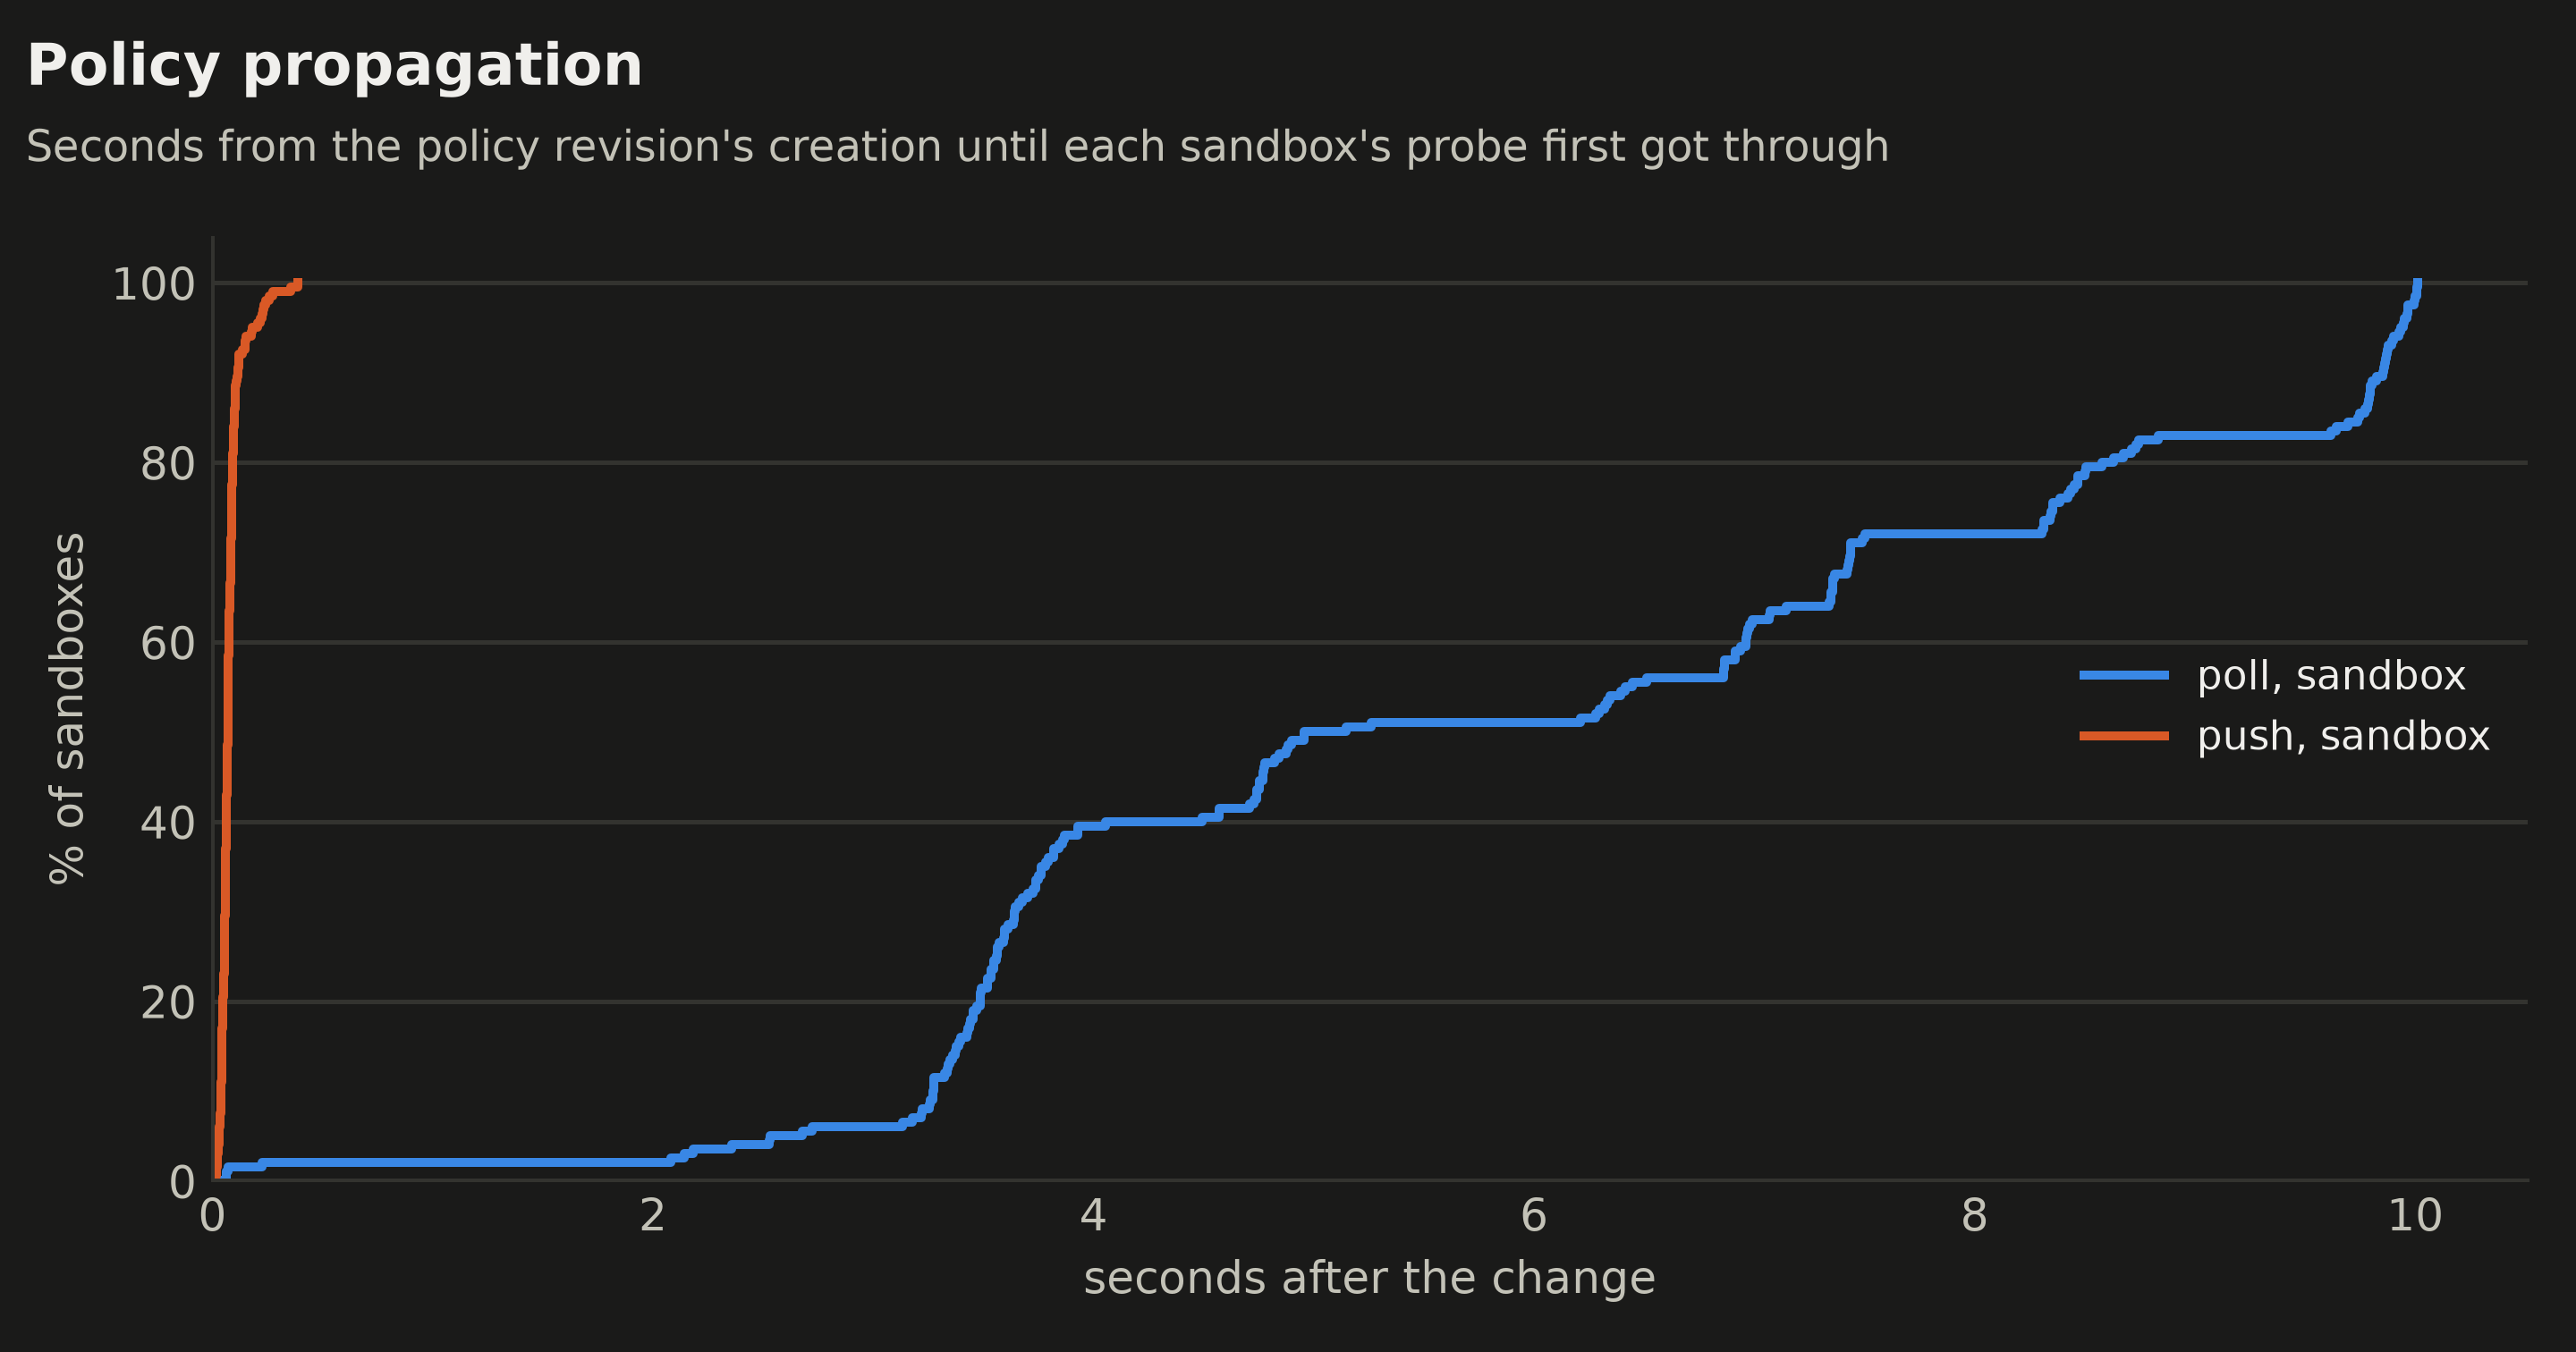
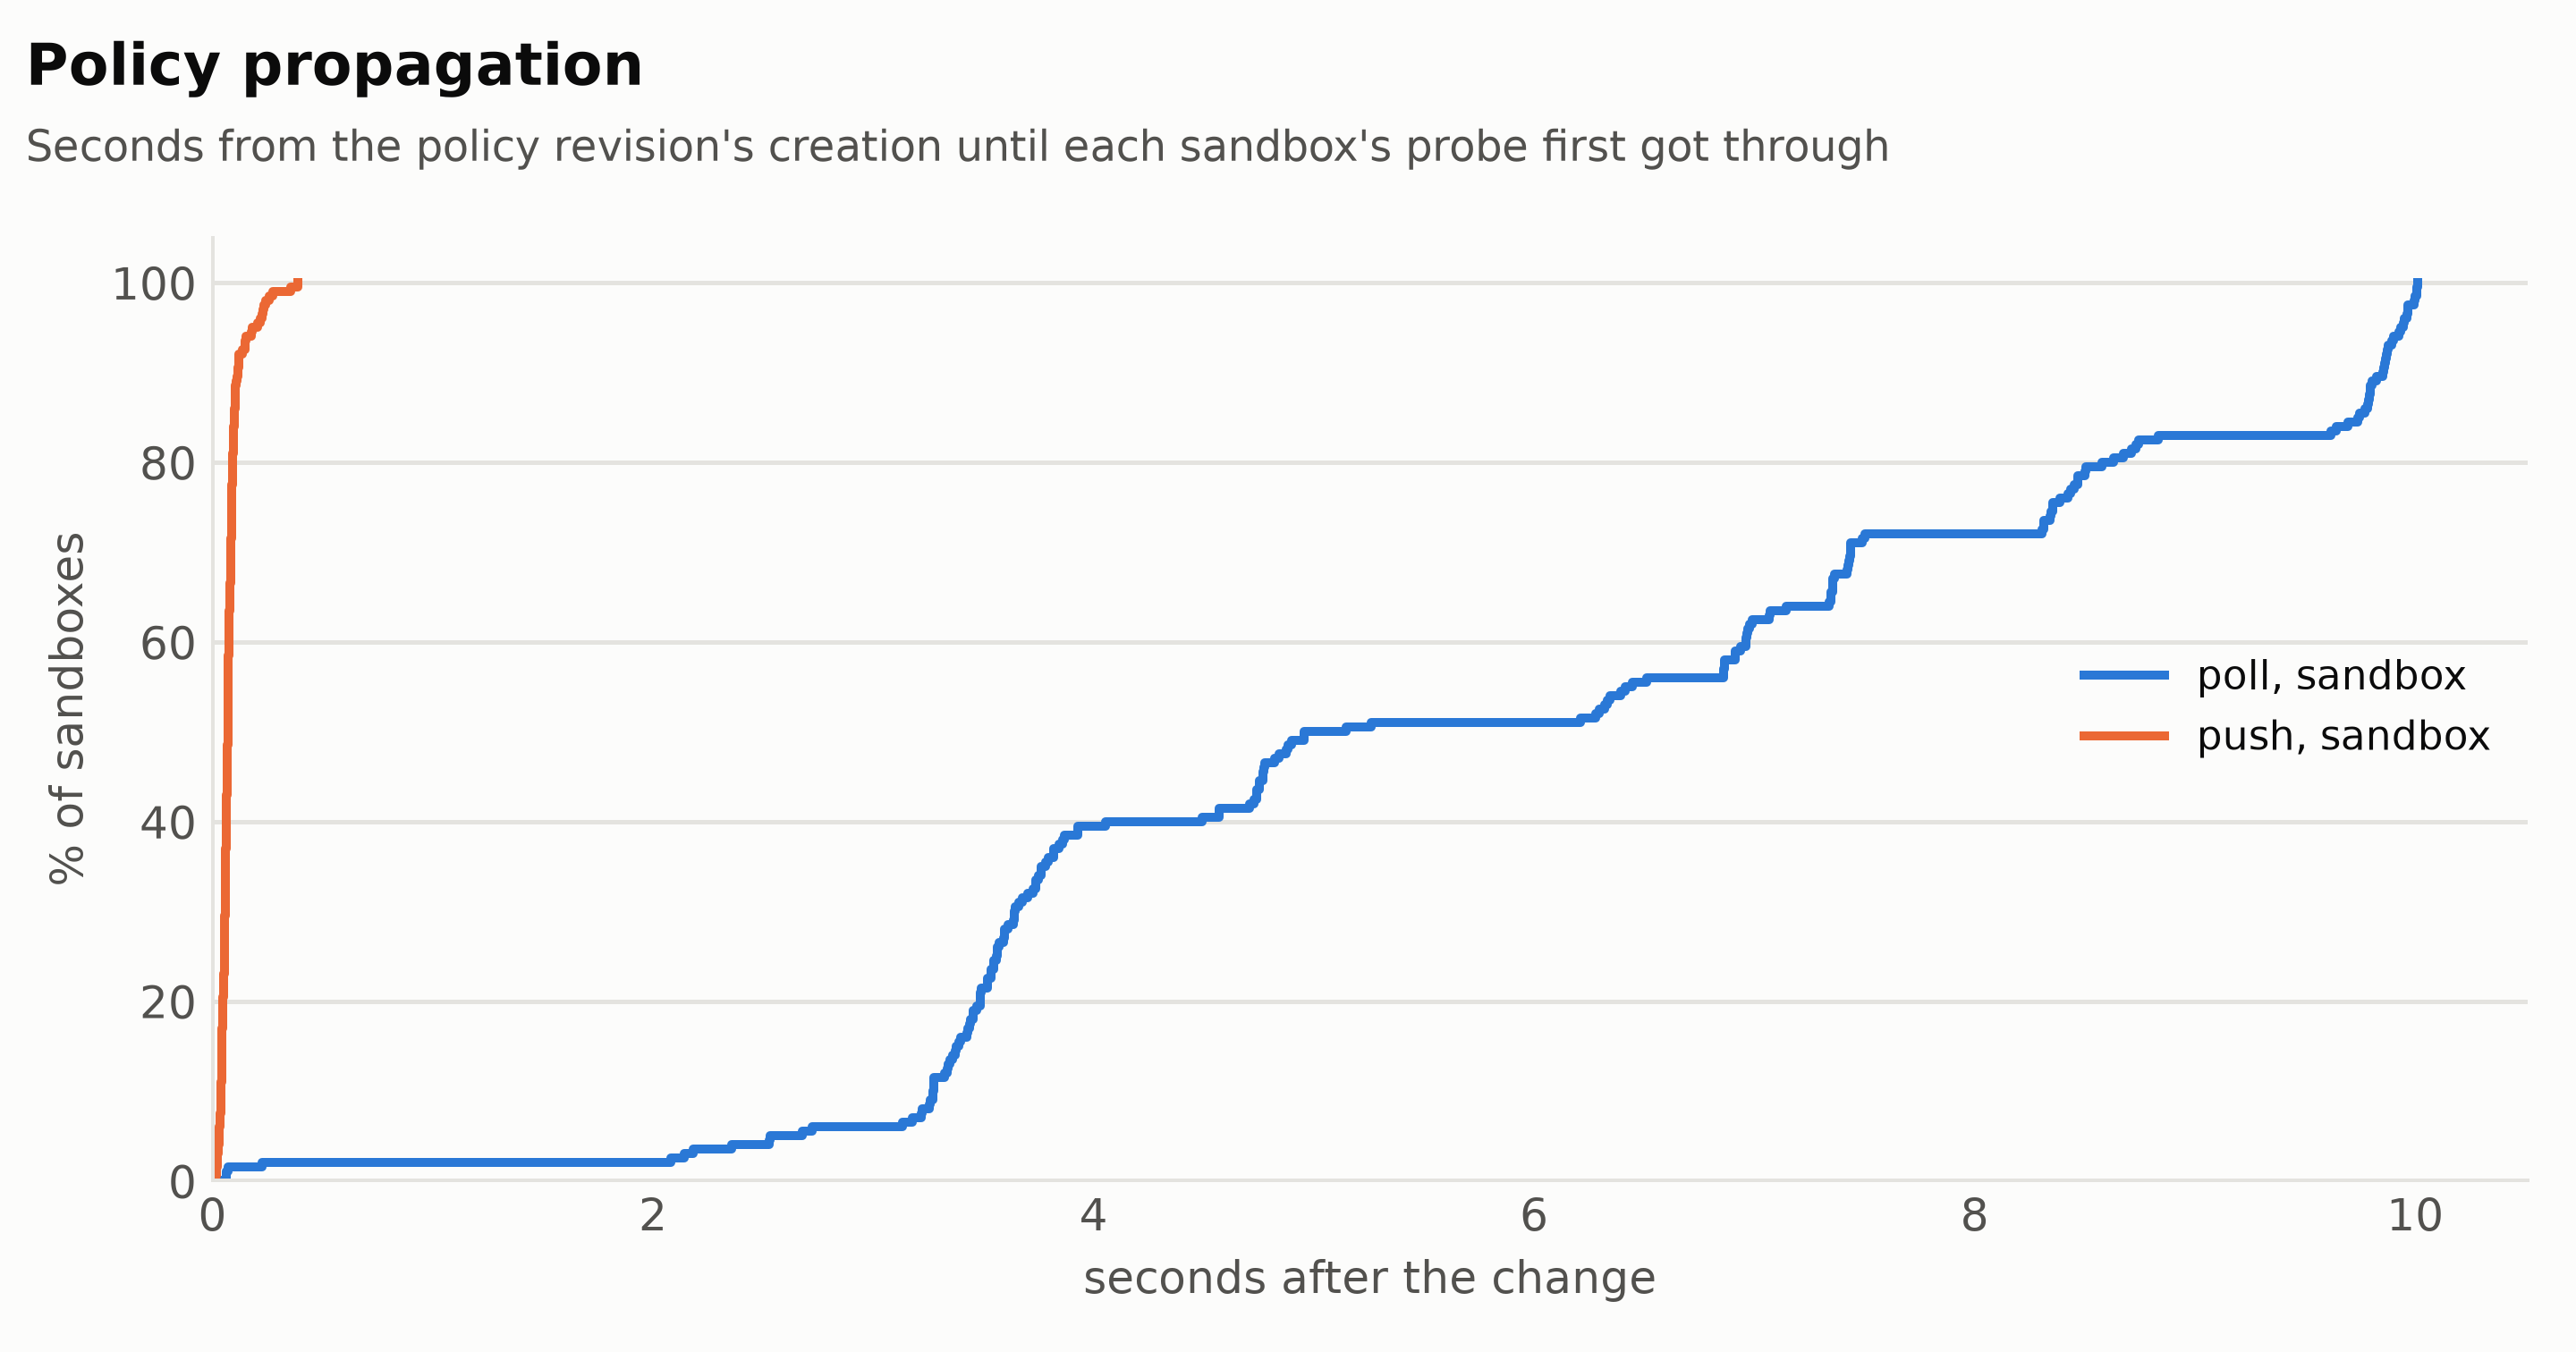
03_policy_propagation.py starts 20 sandboxes, each with a probe that tries the echo server every 50 ms and a 90-second streaming download. One policy change allows the echo server; a second, unrelated change creates a new policy revision. Ten repeats, with the default poll delivery and with push.
| Delivery | Allowed after (p50 / p95 / max, 200 sandbox-changes) | Open streams cut by the unrelated change |
|---|---|---|
| Poll (default) | 4.96 / 9.93 / 10.01 s | 200 of 200 |
| Push | 0.07 / 0.18 / 0.39 s | 200 of 200 |
With polling, a change landed anywhere within the 10-second interval, mostly after the first 3 seconds; push was effectively immediate. Part 4 measured 7.9 to 12.5 seconds with polling and 1.3 seconds with push, but it timed from the CLI call through repeated sandbox exec round trips; the probes here run inside the sandbox every 50 ms, so they time the delivery alone. What doesn’t change is the cost: every new policy revision cut every open stream in the sandbox it reached, including a change that had nothing to do with it. Part 4 showed this for one sandbox. Here each of the 20 per-sandbox edits cut its sandbox’s download; a gateway-wide policy change, which I didn’t run, would reach every sandbox at once.
One thing went wrong in the poll run’s cleanup: a delete got “storage is (re)initializing” (HTTP 429) from the Kubernetes API, and that sandbox took a later cleanup pass to go. CloudWatch shows 8 API server 5xx responses during the same test.
Test 4: What each policy layer costs
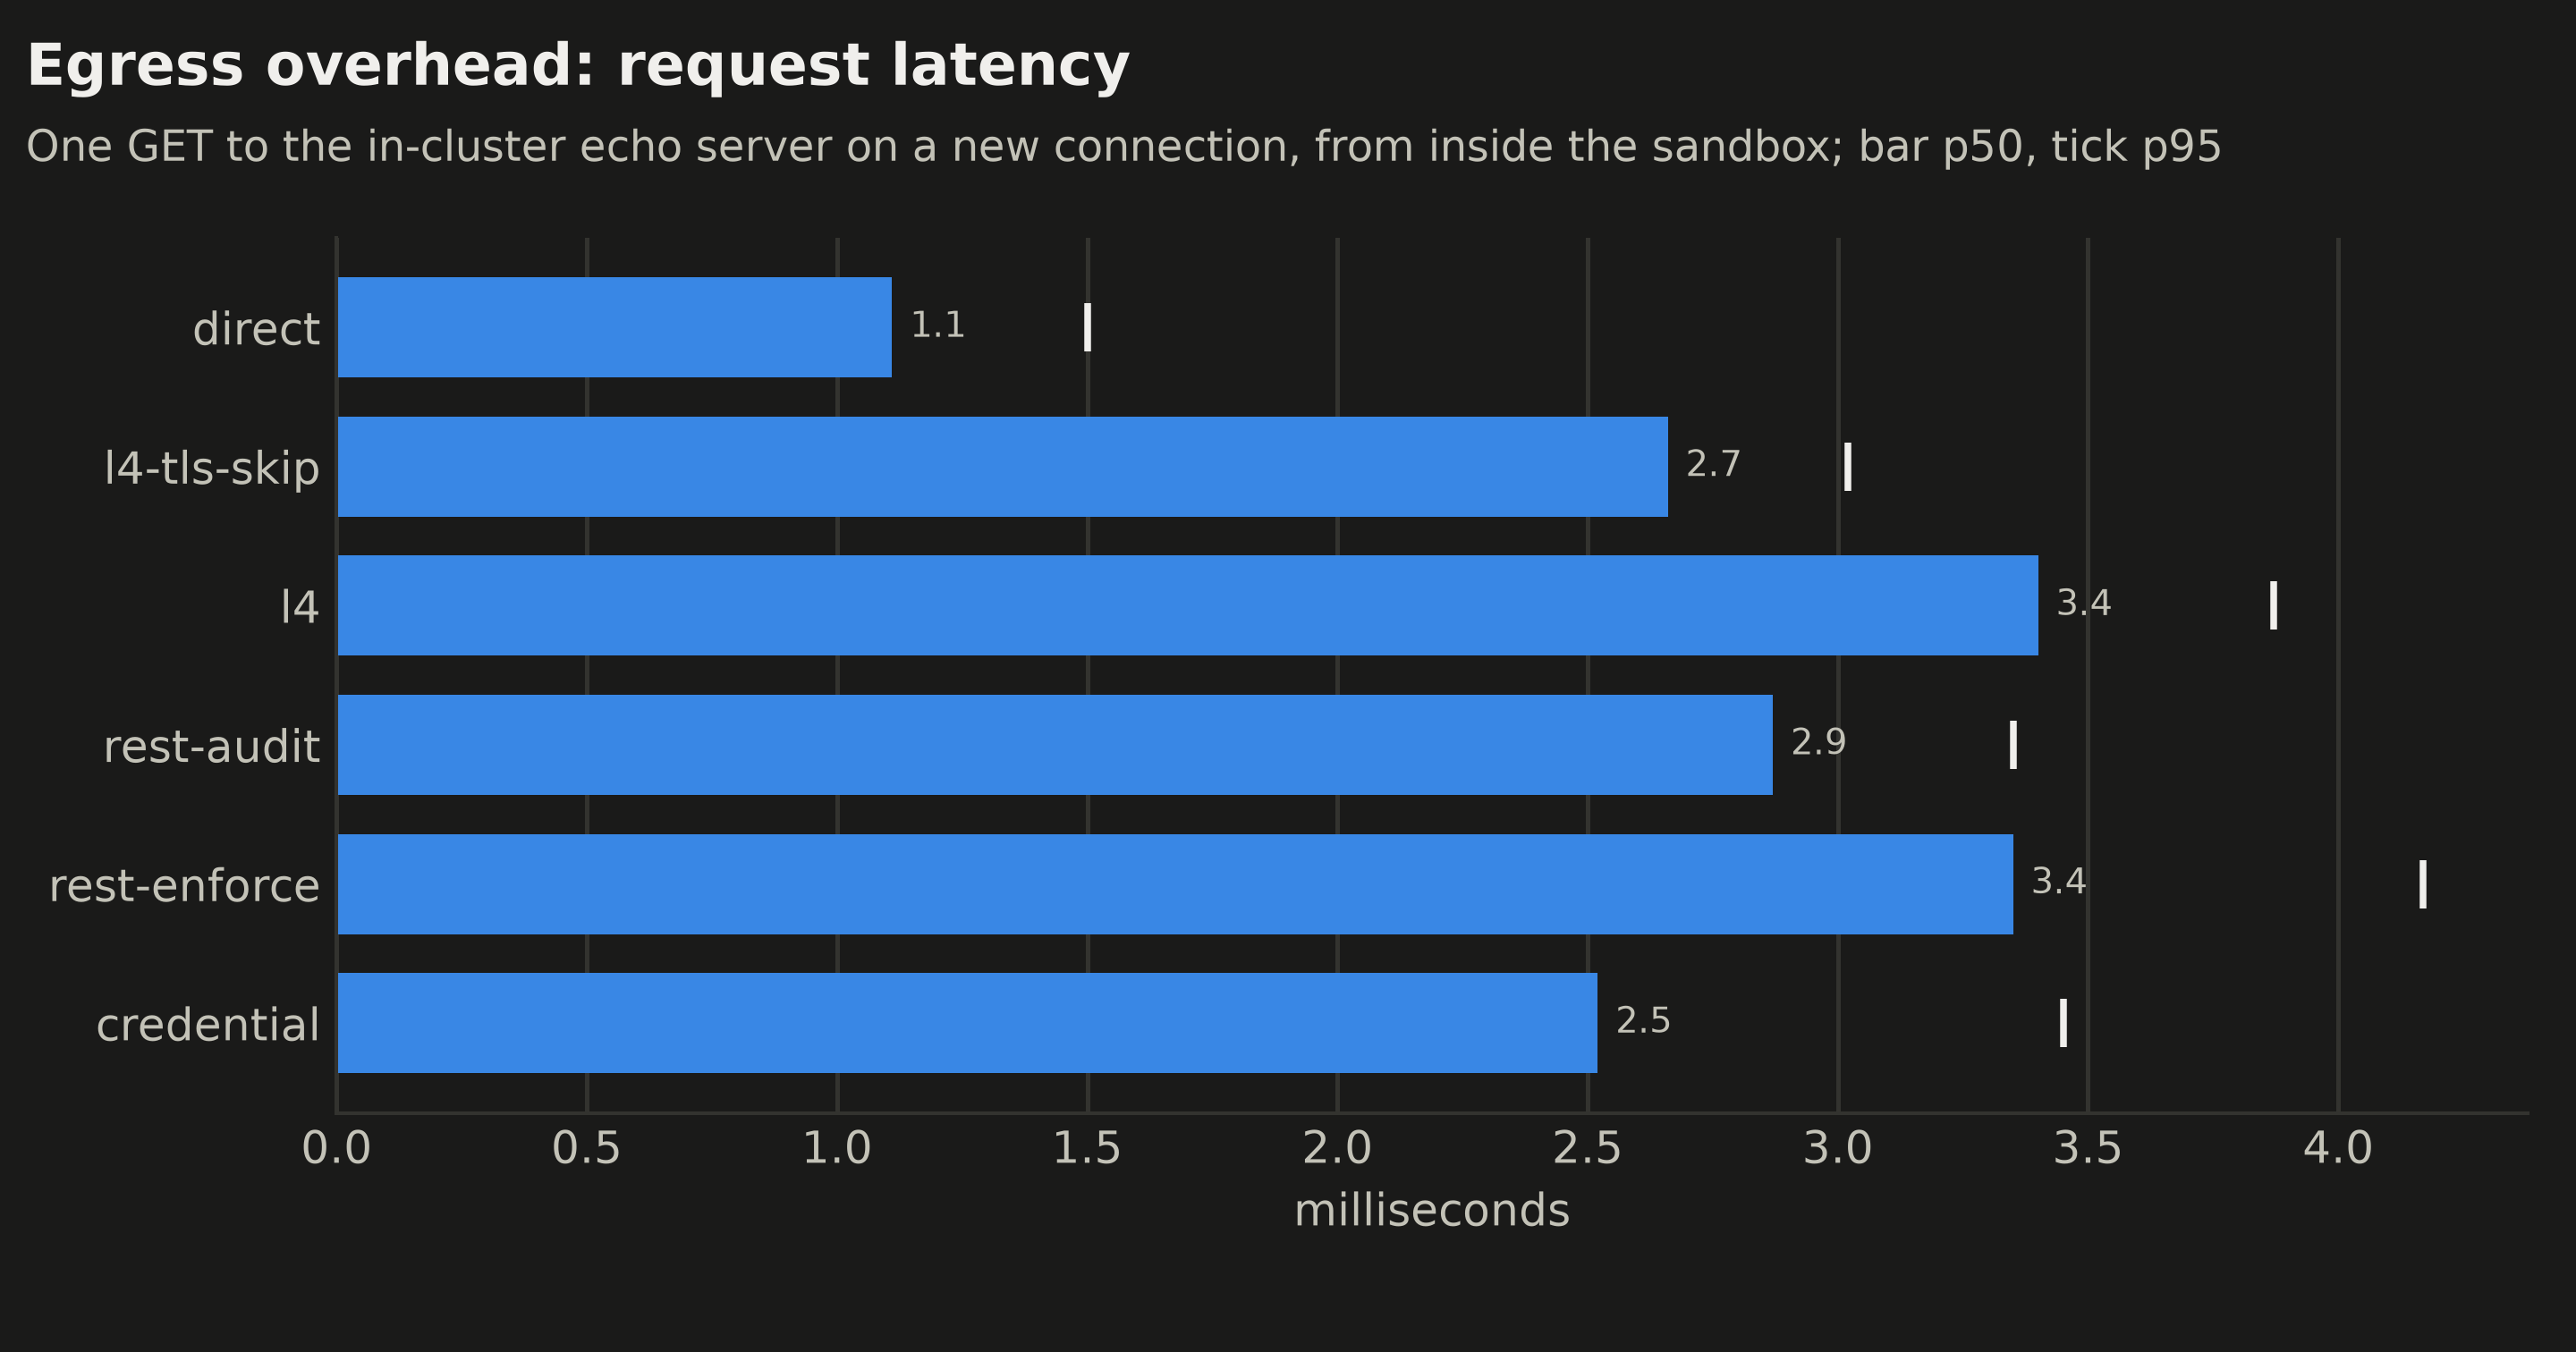
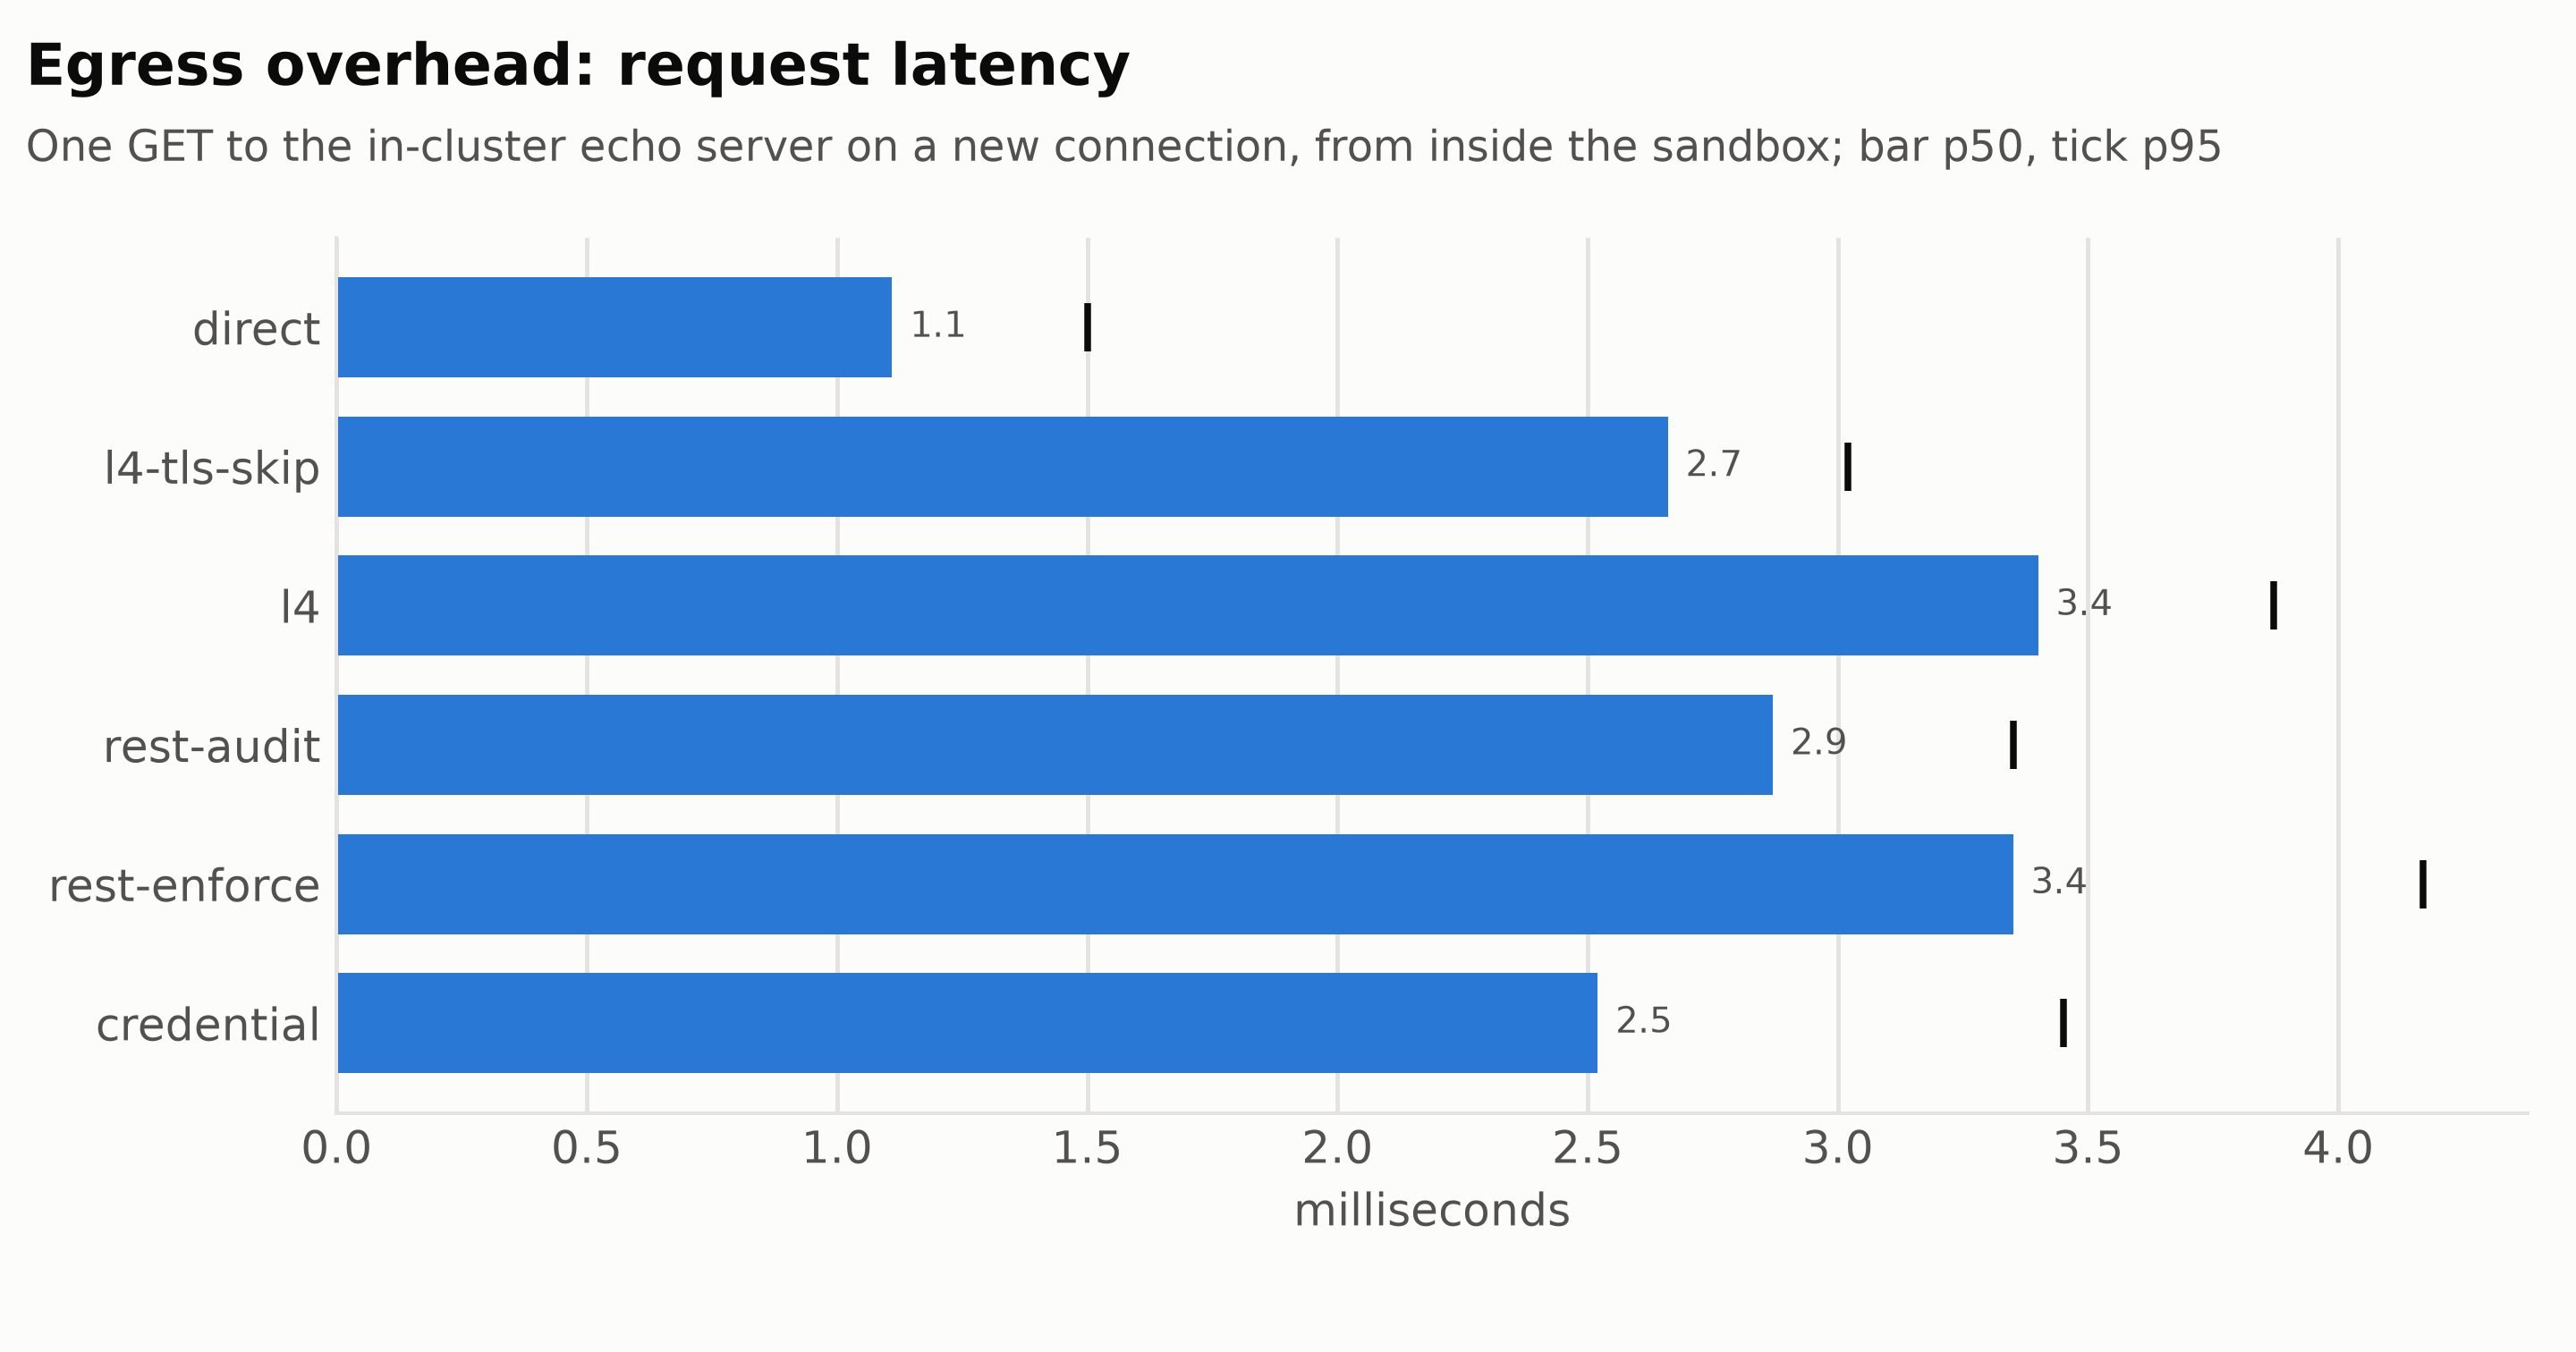
04_egress_ladder.py runs the same benchmark from one sandbox under rising policy work: L4 with tls: skip (the supervisor relays bytes without looking at them), L4 (no request rules, but the supervisor checks each HTTP request’s host and path), a REST rule in audit mode, a REST rule enforced, and a substituted credential. The baseline is a plain Pod on the same node. The echo server, the workload and its supervisor were all on one node; the variant with the supervisor on the other node never ran, because the scheduler put the supervisor next to the workload in 10 out of 10 tries.
| Rung | New connection p50 / p95 | Upload |
|---|---|---|
| Direct (a plain Pod) | 1.11 / 1.50 ms | n/a |
L4, tls: skip | 2.66 / 3.02 ms | 172 MiB/s |
| L4 | 3.40 / 3.87 ms | 178 MiB/s |
| REST, audit | 2.87 / 3.35 ms | 164 MiB/s |
| REST, enforce | 3.35 / 4.17 ms | 169 MiB/s |
| Credential substituted | 2.52 / 3.45 ms | 101 MiB/s |
Going through OpenShell adds about 1.4 to 2.3 ms to a new connection to an in-cluster service: the runtime traps the connect, the Sandbox Protocol carries it to the supervisor, and the supervisor dials. Each rung ran once, and the differences between them are small enough that I wouldn’t read an order into them. Uploads went through at 160 to 180 MiB/s, except with a credential substituted, at 101 MiB/s. I don’t have throughput numbers for the direct baseline: all its uploads and about half of its requests-per-second run failed with an OSError in my harness, so those figures are left out, and the L4 and REST-enforce throughput runs each had 8 timeouts, so I’d not compare requests per second across rungs either.
Against an AWS endpoint over HTTPS, with keep-alive, the p50 went from 3.06 ms direct to 3.27 ms with tls: skip, 3.35 ms with TLS terminated and 3.57 ms with a REST rule enforced: TLS termination and inspection cost a fraction of a millisecond per request once the connection is open. New HTTPS connections cost more, 7.2 ms direct against 9.6 to 10.2 ms through OpenShell.
I left out a rung with SigV4 signing, so this ladder doesn’t measure what signing costs; part 5 covers what it does.
Test 5: The gateway under API load
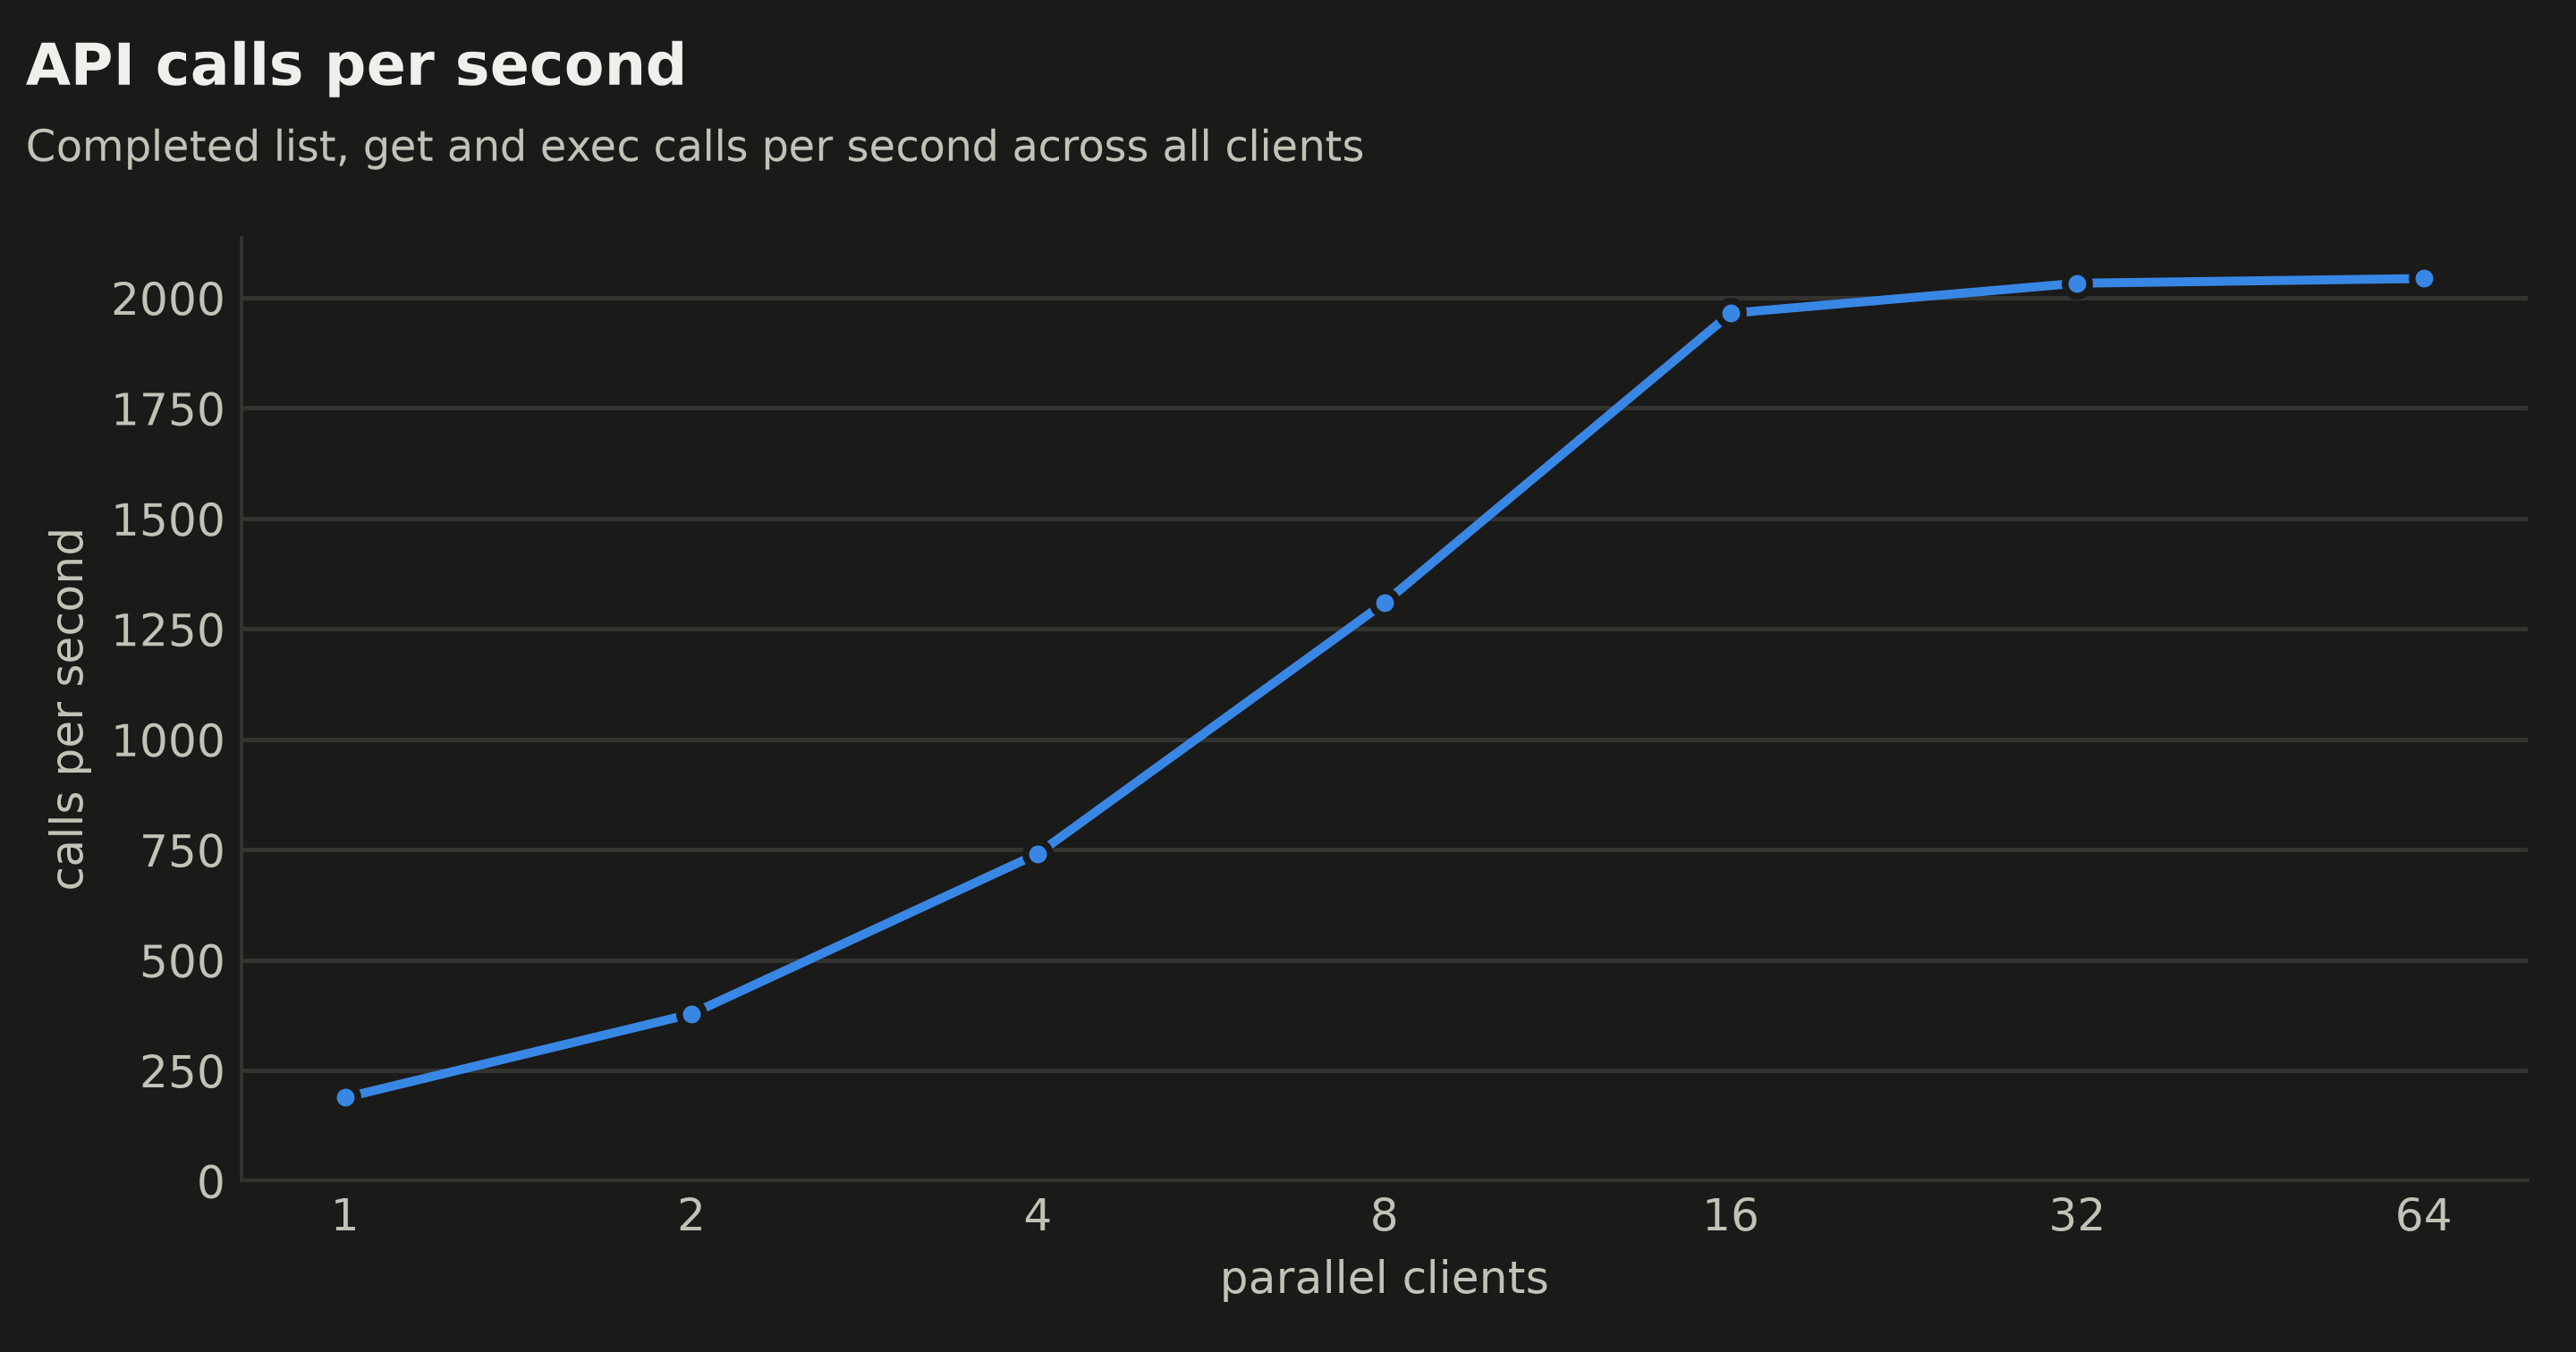
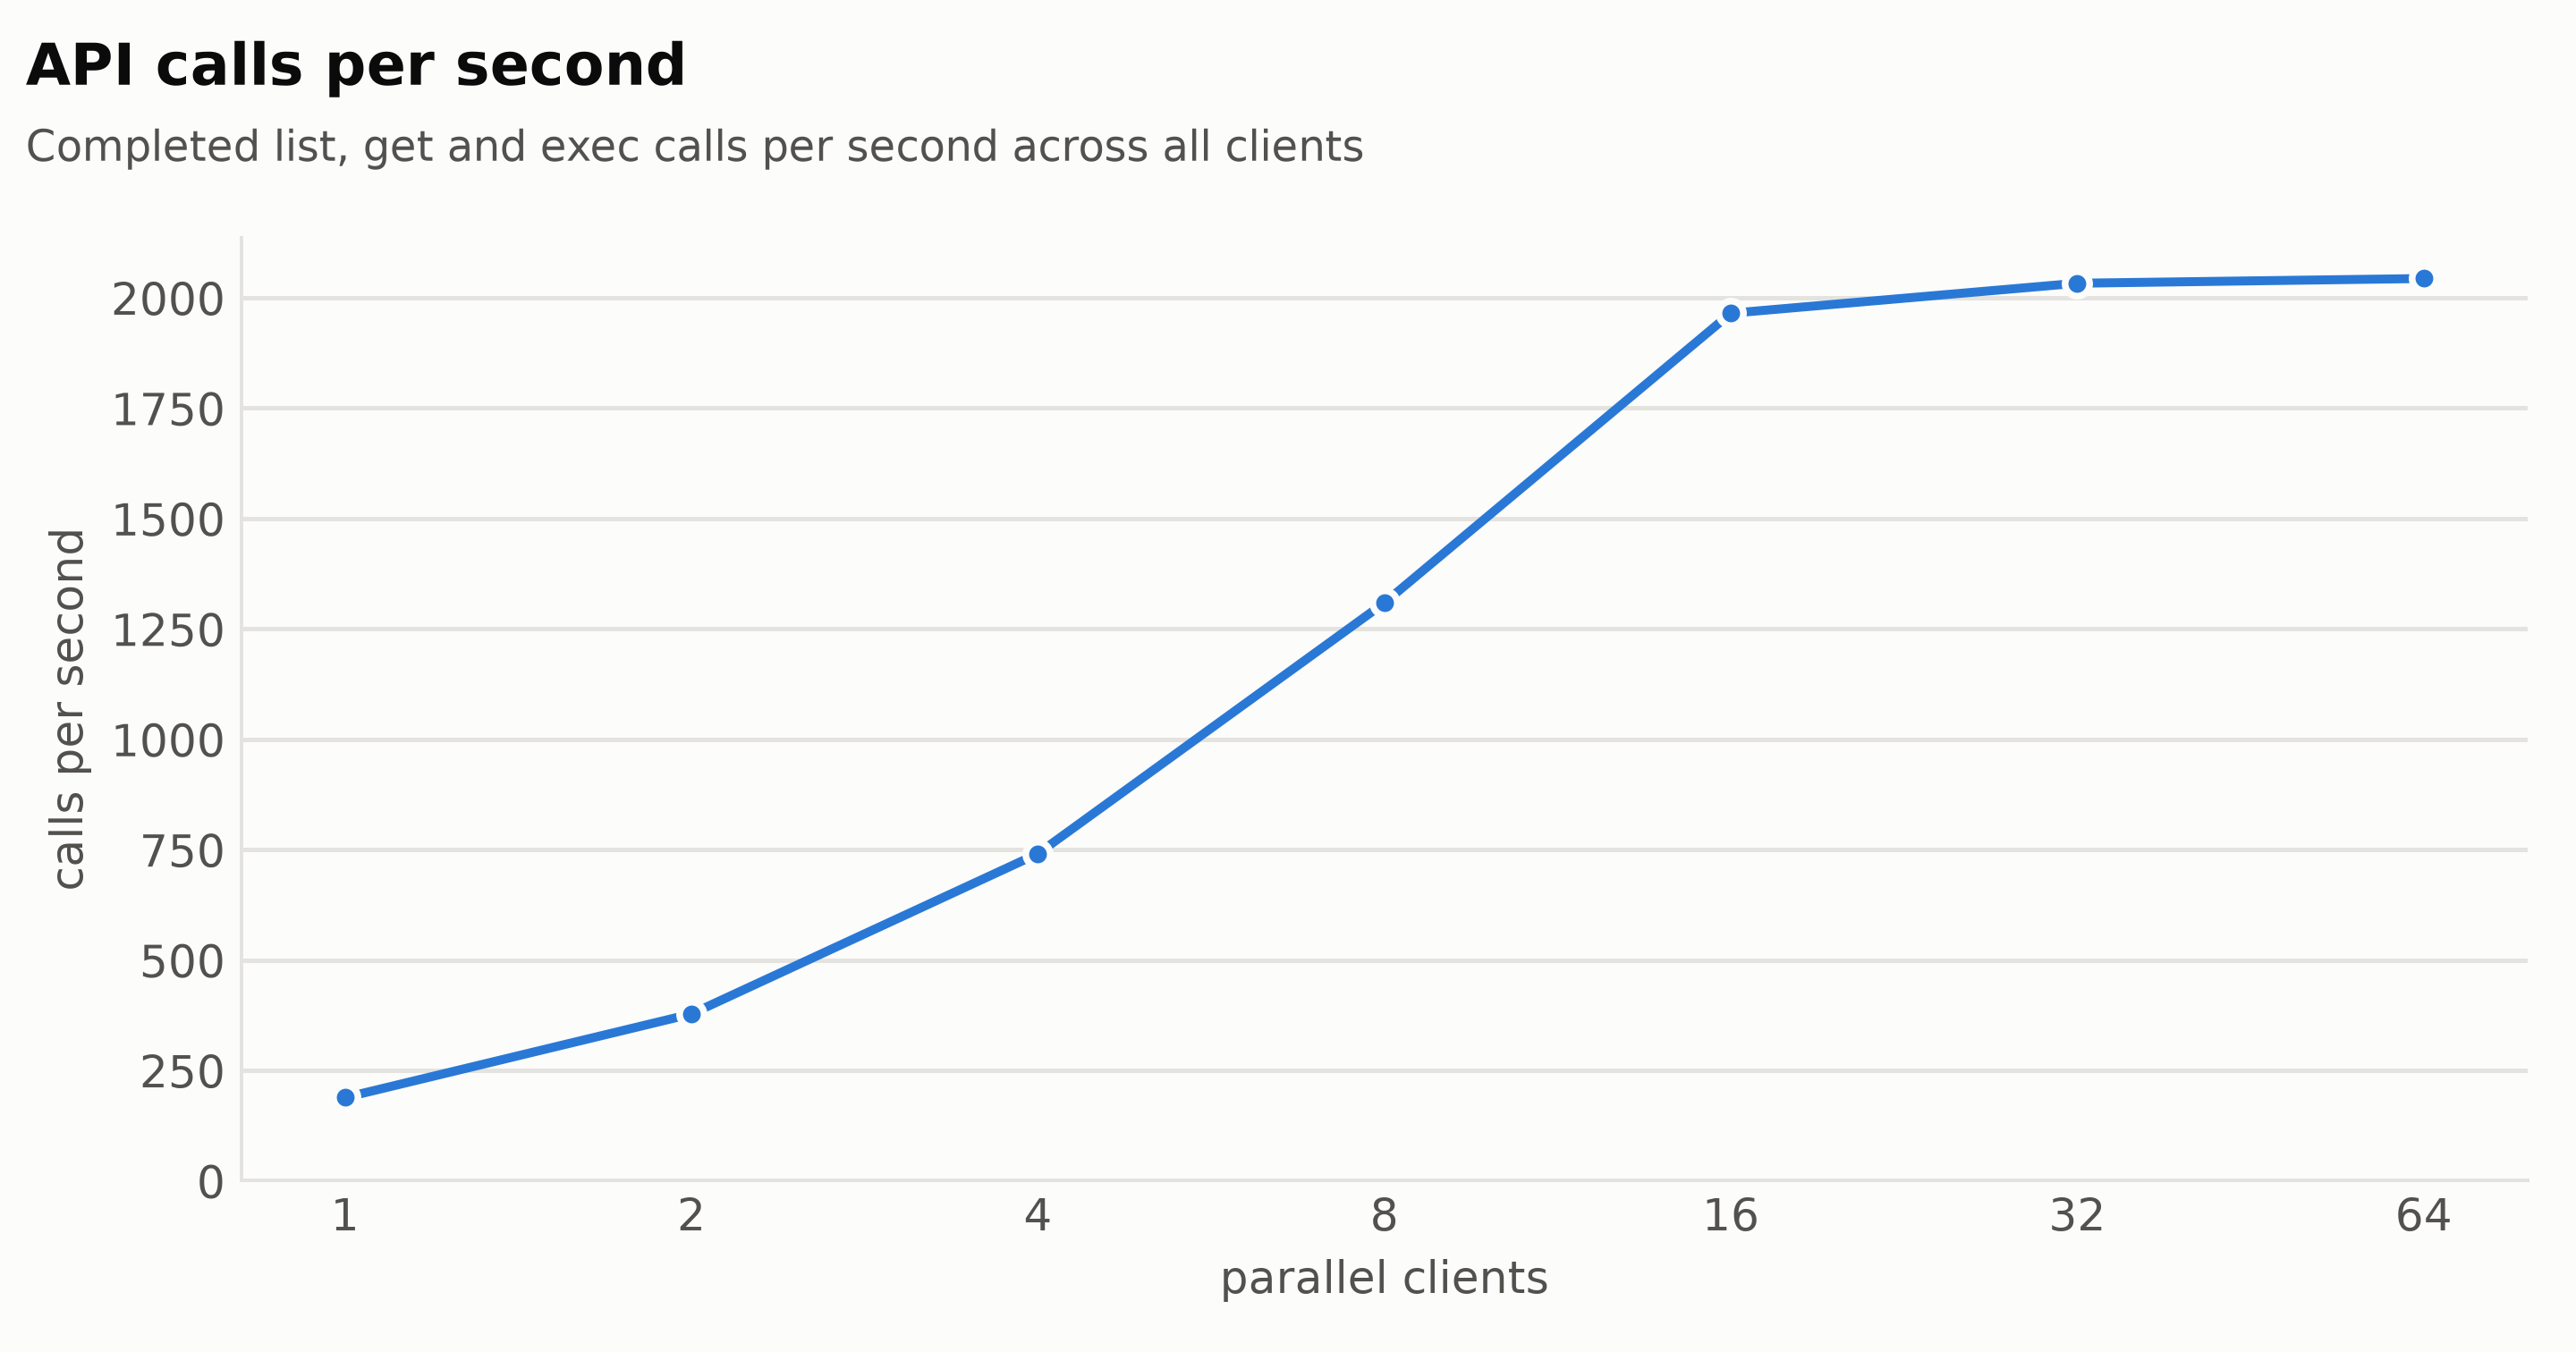
05_control_plane.py runs 1 to 64 parallel API clients, each cycling list, get and exec against five sandboxes, from a Pod inside the cluster: in a smoke run, every call from the laptop paid about 90 ms for the port-forward. The gateway is one replica with no resource limits.
| Clients | Calls/s | list p50 | exec p50 / p95 | Gateway CPU | Gateway memory |
|---|---|---|---|---|---|
| 1 | 189 | 1.9 ms | 13.1 / 17.7 ms | 0.23 cores | 83 MiB |
| 8 | 1,309 | 2.0 ms | 14.6 / 22.9 ms | 1.80 cores | 102 MiB |
| 16 | 1,965 | 2.2 ms | 17.9 / 42.5 ms | 2.65 cores | 107 MiB |
| 64 | 2,044 | 2.3 ms | 20.1 / 384.9 ms | 2.73 cores | 126 MiB |
No errors at any level. Throughput levels off at about 2,040 calls a second with the gateway at about 2.7 cores. I can’t say that’s the gateway’s limit: its node was then at about 6 of its 8 cores, and my load client is a single Python process. list and get stay at about 2 ms; exec, which opens a session through the sandbox’s supervisor, goes from 13 to 20 ms at the median and to 385 ms at the p95 with 64 clients. A Health call, the transport floor, took 0.89 ms.
Test 6: Noisy neighbours
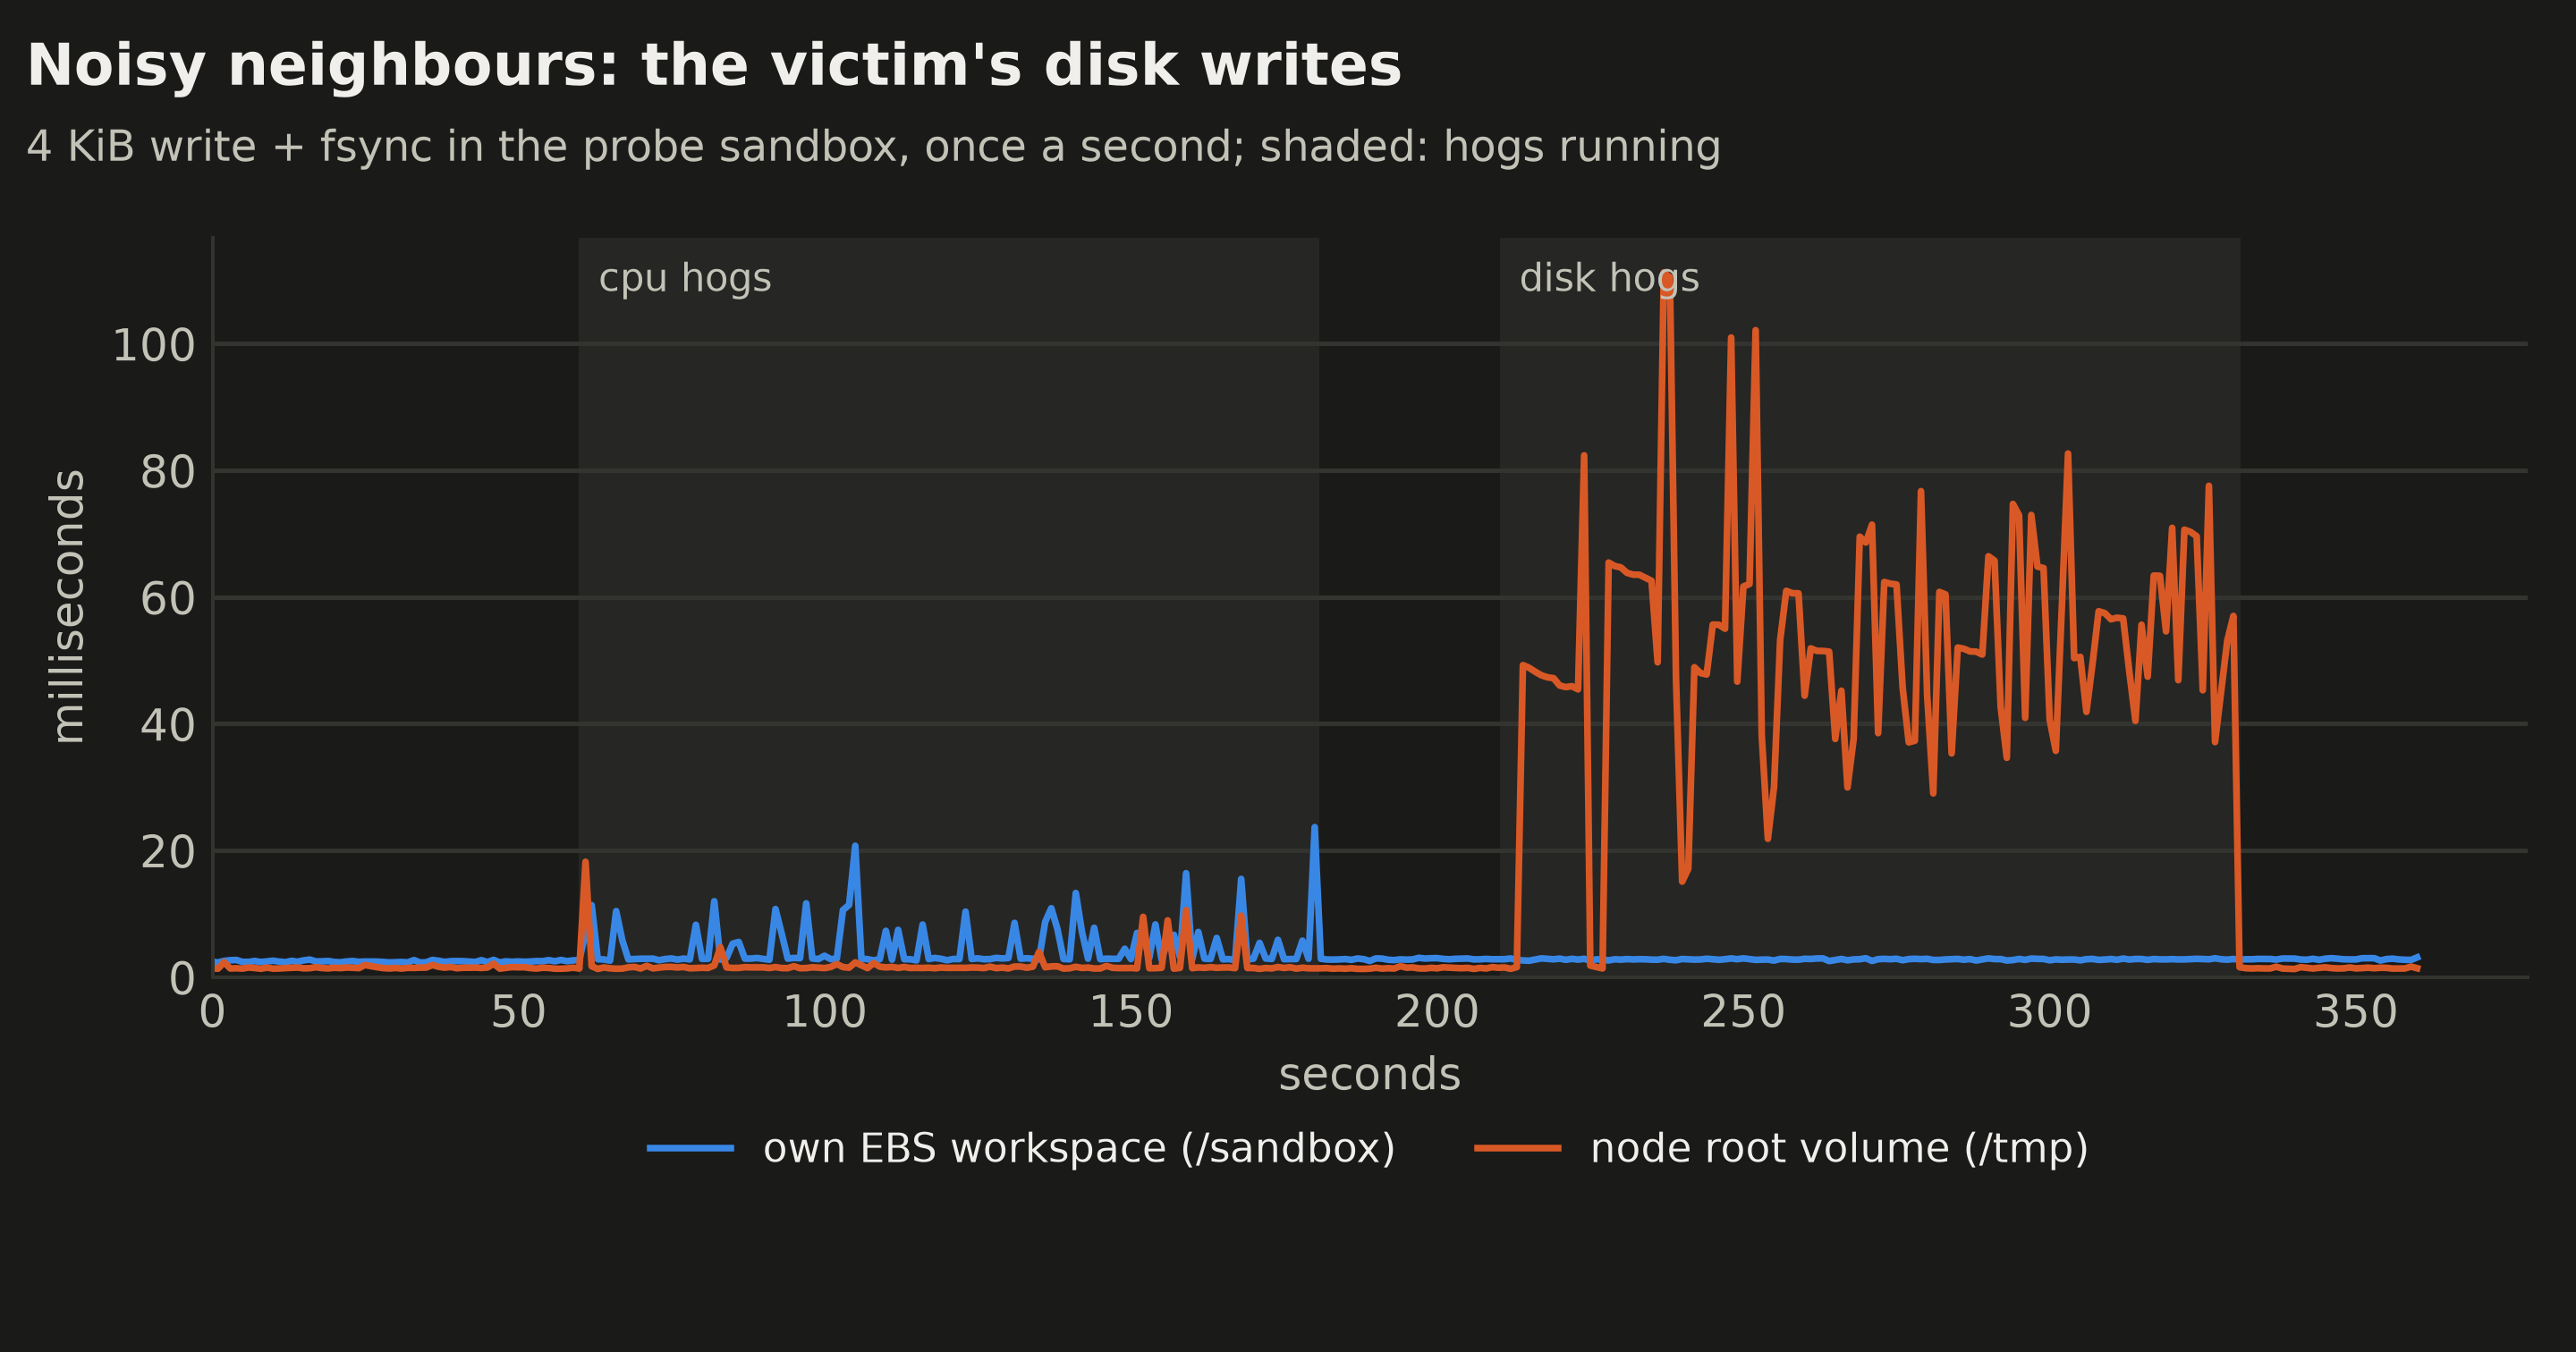
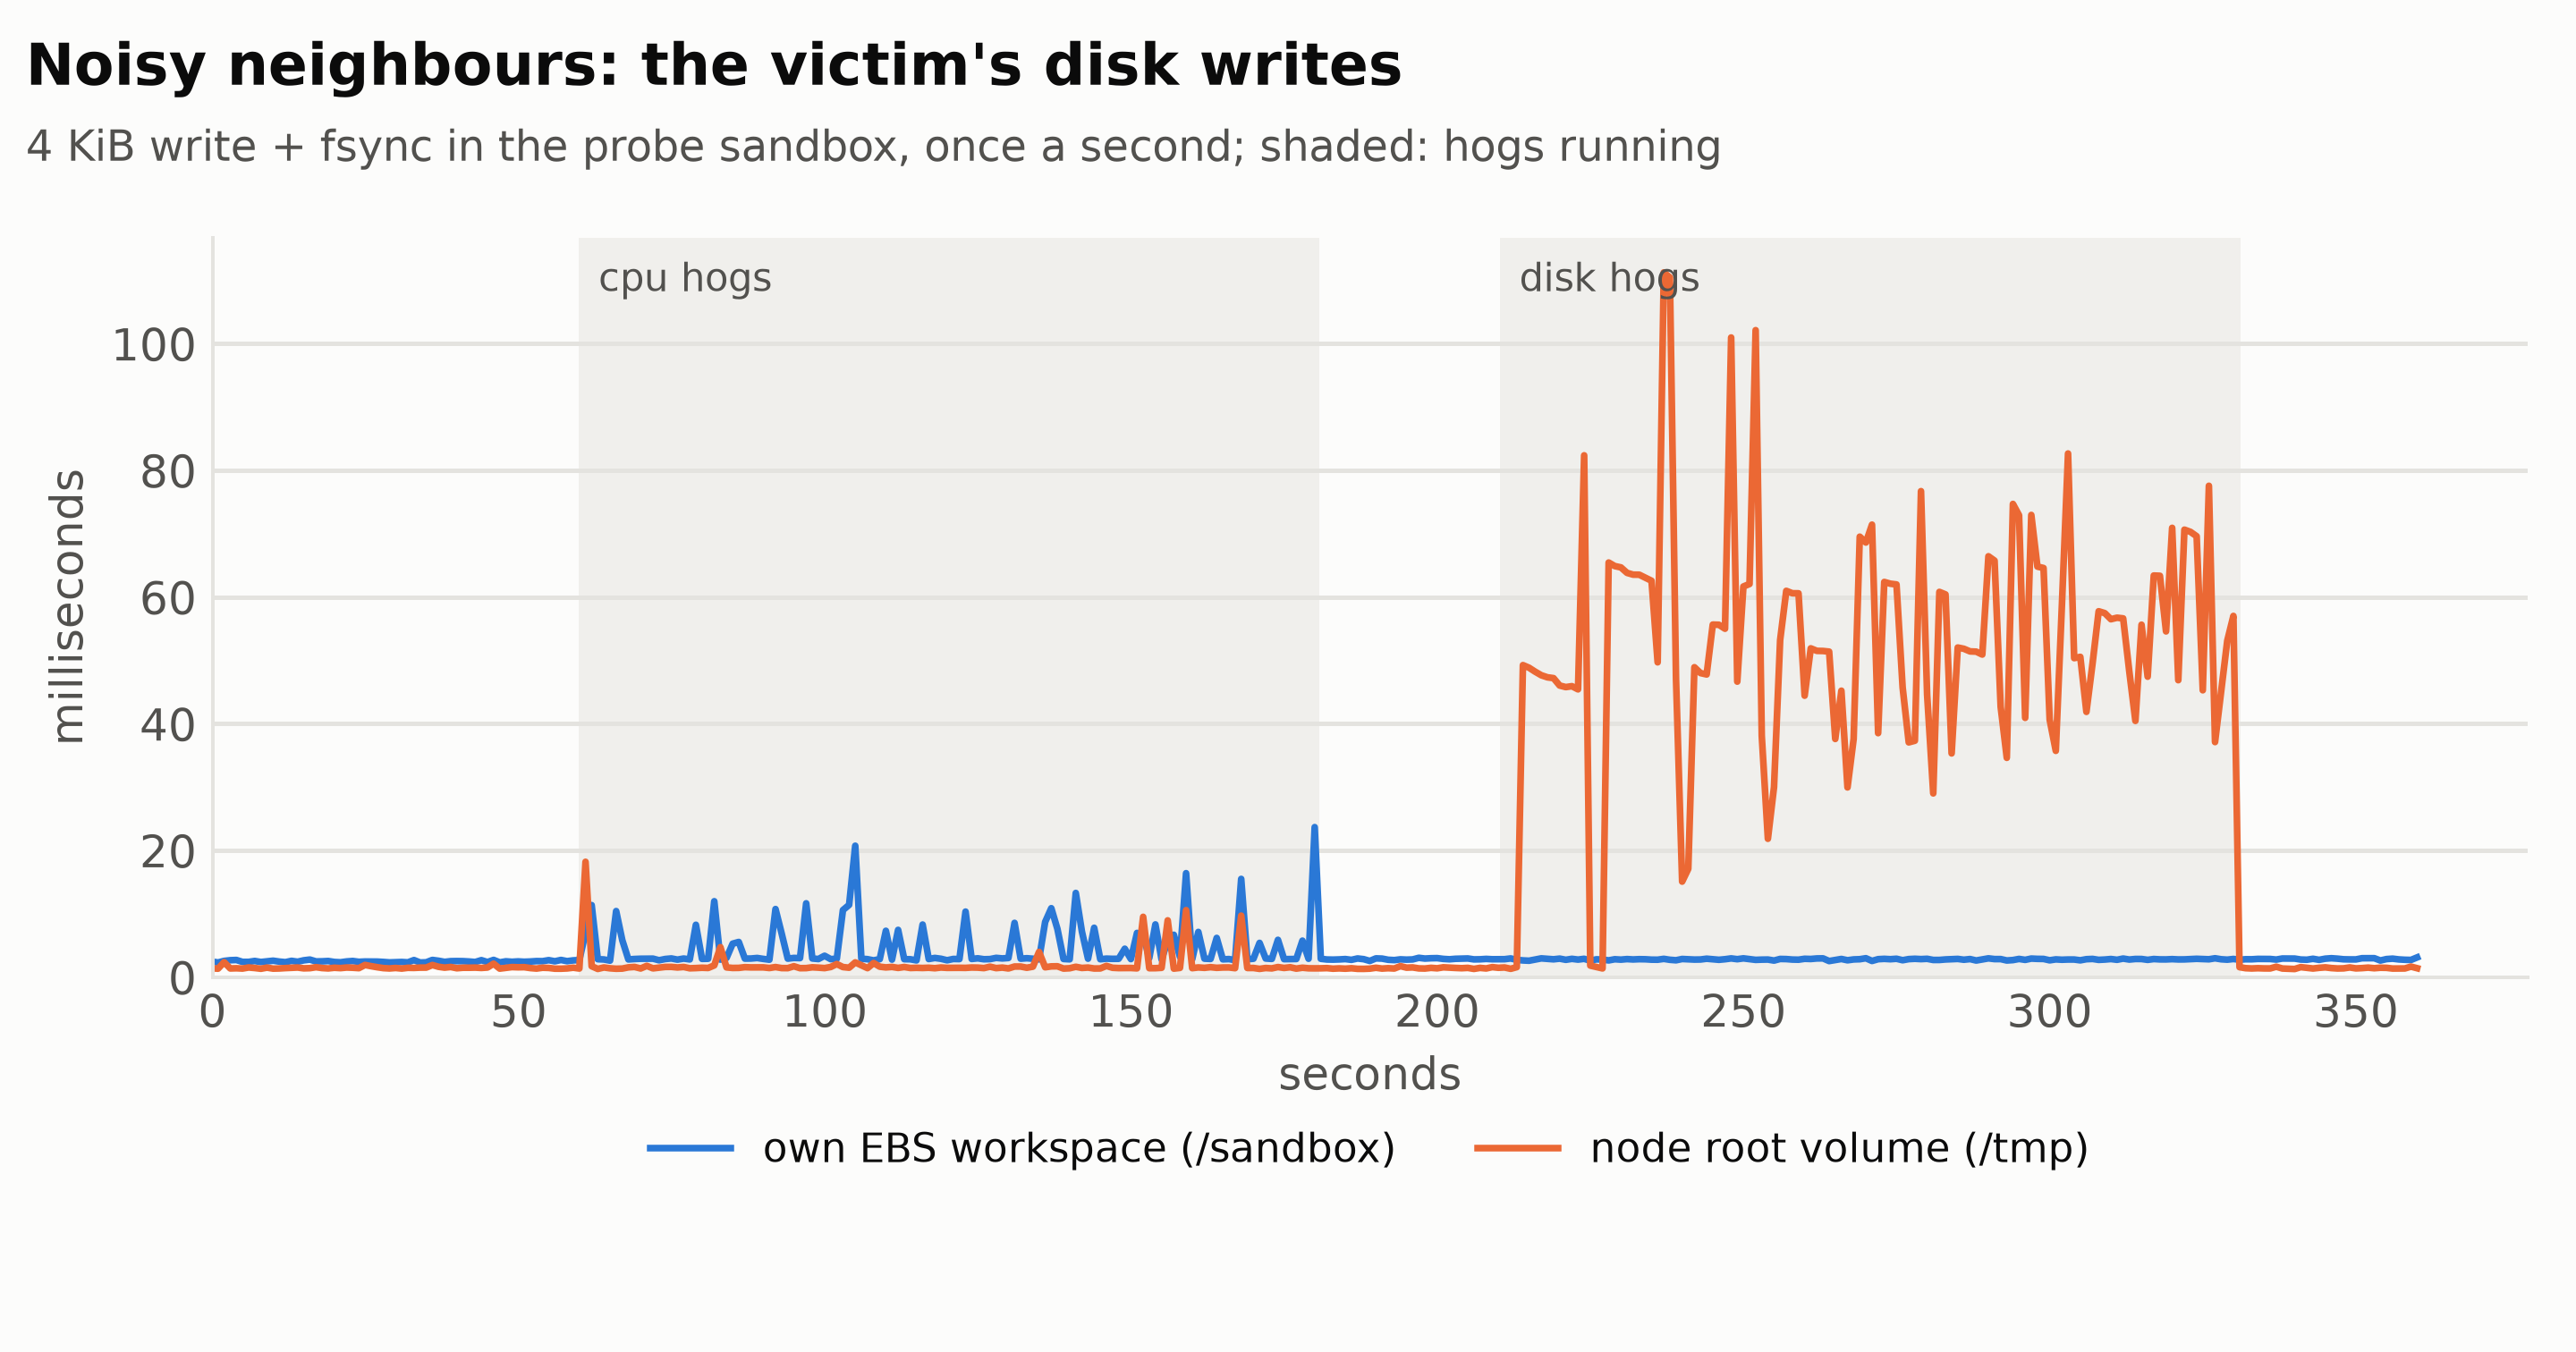
06_noisy_neighbors.py puts a probe sandbox on one node next to three hog sandboxes: first CPU hogs (8 threads each), then disk hogs writing to the node’s root volume and their own workspaces. The probe measures a fixed piece of CPU work, an fsync on its own EBS workspace and on the node’s root volume, and a request to the echo server, once a second. The probe’s node isn’t the echo server’s, so its echo request crosses nodes, unlike Test 4’s, and starts from a higher baseline. The second run limits each hog to 1 CPU.
| Probe, p50 | Baseline | CPU hogs | CPU hogs, 1 CPU each | Disk hogs | Disk hogs, 1 CPU each |
|---|---|---|---|---|---|
| CPU work | 10.6 ms | 20.6 ms | 15.0 ms | 10.7 ms | 10.7 ms |
| Request to the echo server | 6.1 ms | 15.5 ms | 7.4 ms | 6.2 ms | 7.2 ms |
fsync, own EBS workspace | 2.5 ms | 2.9 ms | 2.9 ms | 2.8 ms | 2.8 ms |
fsync, node root volume (/tmp) | 1.4 ms | 1.5 ms | 1.5 ms | 51.5 ms | 53.6 ms |
Sandboxes have no resource limits unless you set them (--cpu, --memory), and OpenShell’s isolation layers don’t add any. Three unlimited CPU hogs doubled the probe’s CPU time and more than doubled its request latency; a 1-CPU limit per hog cut most of that. The disk hogs didn’t touch the probe’s own EBS volume, but they made fsync on the node’s root volume about 36 times slower, and CPU limits did nothing for it. Everything a sandbox writes outside /sandbox, its /tmp included, shares the node’s root disk with every other sandbox on that node.
What CloudWatch Saw
Container Insights saw the same tests, one data point a minute. node_number_of_running_pods peaked at 58 on a node during the dedicated density run, the Pod limit Test 1 hit, and cluster_number_of_running_pods at 116. node_cpu_utilization stayed under 10% for the density, create and propagation tests, reached about 42% during the egress ladder and 72% under API load, and 100% on the hogs’ node with the noisy neighbours; node_memory_utilization never went above 9%. The API server reported 8 responses with a 5xx status during the policy propagation test.
Two things it doesn’t show. Nothing in Container Insights knows about sandboxes, so a sandbox stuck in Provisioning is just a Pending Pod, and the density ceiling looks like an ordinary scheduling failure. And at one data point a minute, a create storm that takes 40 seconds is a single point. For OpenShell itself, the gateway exposes Prometheus metrics on port 9090 (supervisor sessions, config delivery, gRPC calls), which a Prometheus scraper or the CloudWatch agent’s Prometheus support could collect; I read them directly in Test 5.
Results Summary
| Result | |
|---|---|
| Density, a supervisor Pod per sandbox | 46 sandboxes; stopped by Pods per node (58) |
| Density, shared supervisor pool | 61; stopped by EBS attachments per node (31) |
| Density, shared pool with 1 GiB workspaces | 61; same limit |
| Node use at 46 sandboxes | under 2.8 GiB of 32 GiB memory and 0.9 of 8 cores per node |
| Shared pool after a switch | creates refused until the pool members connected (the canary step took 49 to 110 s) |
| Create→Ready, 1 / 40 at once, dedicated | 9.2 s / 32.4 s p50 (42.4 s p95) |
| Create→Ready, 1 / 40 at once, shared pool | 12.3 s / 17.5 s p50 (30.3 s p95) |
| Stuck or failed creates | 0 (shared pool: once it accepted sandboxes) |
| Delete | about 31 s per sandbox |
| Policy propagation, poll / push | p50 4.96 s, max 10.0 s / p50 0.07 s, max 0.39 s |
| Open streams cut by an unrelated policy change | 200 of 200 |
| New connection to an in-cluster service | 1.1 ms direct, 2.5 to 3.4 ms through OpenShell |
| HTTPS keep-alive request, direct vs REST enforced | 3.06 ms vs 3.57 ms |
| Gateway API throughput | about 2,040 calls/s at about 2.7 cores, no errors |
| Noisy CPU neighbours | probe CPU work 10.6 → 20.6 ms; 15.0 ms with 1-CPU limits |
| Noisy disk neighbours | node root volume fsync 1.4 → 51.5 ms; own EBS workspace unaffected |
Pricing
The tests ran on part 2’s cluster with nothing added except Container Insights, from about 06:10 to 08:10, including the re-runs of the shared-pool tests. At part 2’s idle rate of about $0.98 an hour (two m7i.2xlarge nodes, the EKS control plane, the NAT gateway and the root volumes), that’s roughly $2 of cluster time.
The rest is small:
| Item | Price | For these tests |
|---|---|---|
| Workspace volumes, up to 61 × 2 GiB gp3 | $0.08/GB-month | under $0.02 an hour at the peak |
| Container Insights | billed per metric observation (CloudWatch pricing) | switch it off afterwards |
Sandboxes on these nodes are cheap: 46 idle ones used a few percent of two nodes that cost $0.81 an hour together. The cost of density here is the cost of Pod slots and volume attachments, so check those limits for an instance type before its vCPUs and memory.
Cleanup
./99_cleanup.sh               # anything a killed script left: p6 sandboxes, Pods, Helm overlays
./00_container_insights.sh off
cd ../openshell-eks
./99_teardown.sh              # the whole cluster, at the end of the series
Each test deletes what it created and puts back any gateway change; 99_cleanup.sh is for when a script was killed hard. It also removes Sandbox resources the gateway no longer lists, the orphans described in Test 2.
Verdict
Two m7i.2xlarge nodes ran 46 OpenShell sandboxes as shipped and 61 with the shared supervisor pool, and in both cases the cluster ran out of per-node Pod slots and EBS attachments (instance limits that Kubernetes enforces) long before it ran out of CPU or memory. That’s the practical lesson for sizing: count Pods (two per sandbox by default) and EBS attachments (one per sandbox), not gigabytes and cores. Prefix delegation in the VPC CNI lifts the first, and the shared pool halves it; the second stays as long as every sandbox gets its own volume, which is the default.
Under load, OpenShell behaved well. Creates slowed with concurrency but never failed or got stuck once the setup was right, the gateway served about 2,000 API calls a second from one replica with no errors, and the policy layers cost a couple of milliseconds per new connection. The shared pool is the faster way to create many sandboxes, but it’s experimental, and after each switch to it the gateway refused sandboxes until the pool members had connected.
The behaviours to design around:
- Policy changes are disruptive at scale. Every revision cuts every open connection in every sandbox it reaches, and with polling it takes up to 10 seconds (about 5 at the median). Batch policy edits, and use push delivery if agents wait on them.
- There are no resource limits by default. A CPU-heavy sandbox slows its neighbours, and a disk-heavy one slows everything that writes to the node’s root volume, which CPU limits don’t fix. Set
--cpuand--memory, keep scratch data in/sandbox, and consider separate node pools for heavy agents. - Deletes are slow, and one can orphan. About 31 seconds each, and in one smoke run a delete right after
Readyleft a sandbox’s objects and its volume behind. Check for leftoverSandboxresources and volumes after bulk deletes. - Watch it with OpenShell’s own metrics. Container Insights sees Pods and nodes, not sandboxes.
That’s the end of the series. Over six parts, OpenShell 0.1.6 on EKS turned out to be a careful design with sharp edges: the agent doesn’t hold its credentials (with one known exception in 0.1.6, covered in part 5), the isolation fails closed, and the egress model is precise, while the defaults (audit mode, telemetry on, no limits, no VM isolation on these nodes) and a handful of bugs need attention before anything important runs in it. Part 1 is where to start if you’re deciding.